Sunday, June 26, 2022

Environmental factors predict risk of death: study

air pollution
Credit: Pixabay/CC0 Public Domain

Along with high blood pressure, diabetes, and smoking, environmental factors such as air pollution are highly predictive of people's chances of dying, especially from heart attack and stroke, a new study shows.

Led by researchers at NYU Grossman School of Medicine and the Icahn School of Medicine at Mount Sinai, the study showed that exposure to above average levels of outdoor air pollution increased risk of death by 20%, and risk of death from  by 17%.

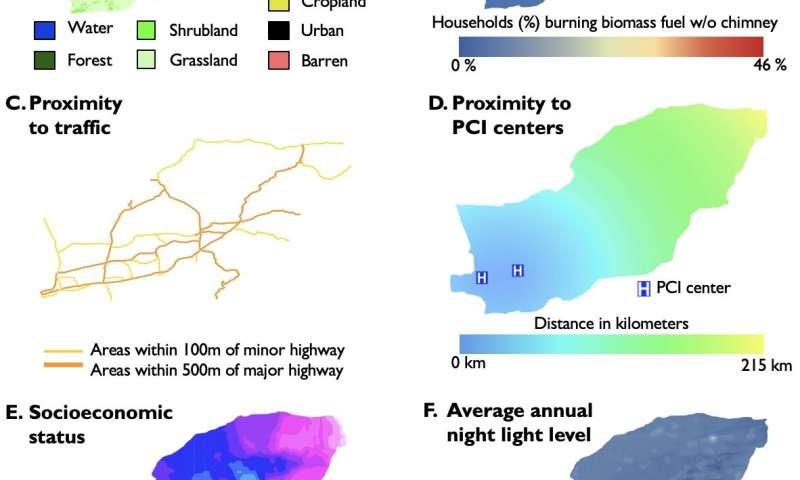
Using wood- or kerosene-burning stoves, not properly ventilated through a chimney, to cook food or heat the home also increasd overall risk of death (by 23% and 9%) and cardiovascular death risk (by 36% and 19%). Living far from specialty  and near busy roads also increased risk of death.

Publishing in the journal PLOS ONE online June 24, the findings come from personal and environmental health data collected from 50,045 mostly poor, rural villagers living in the northeast Golestan region of Iran. All study participants were over age 40 and agreed to have their health monitored during annual visits with researchers dating as far back as 2004.

Specific environmental exposures may help predict increased risk of death from cardiovascular disease
Spatial models for six spatial environmental factors across Golestan Province, Iran.
 These models were used to assign environmental exposures to individuals based on their 
location of residence. Credit: Plos One / Mount Sinai Health System

Researchers say their latest investigation not only identifies environmental factors that pose the greatest risk to heart and overall health, but also adds much-needed scientific evidence from people in low- and . Traditional research on environmental risk factors, the researchers note, has favored  in high-income countries with much greater access to modern health care services.

Compared with those who have easier access to specialized , those living farther away from clinics with catheterization labs able to unblock clogged arteries, for example, were at increased risk of death by 1% for every 10 kilometers (6.2 miles) of distance. In Golestan, most people live more than 50 miles (80 kilometers) away from such modern facilities.

Study results also showed that the one-third of study participants who lived within 500 meters (1,640 feet) of a major roadway had a 13% increased risk of death.

"Our study highlights the role that key environmental factors of indoor/outdoor air pollution, access to modern health services, and proximity to noisy, polluted roadways play in all causes of death and deaths from cardiovascular disease in particular," says study senior author and cardiologist Rajesh Vedanthan, MD, MPH.

"Our findings help broaden the disease-risk profile beyond age and traditional personal risk factors," says Vedanthan, an associate professor in the Department of Population Health and the Department of Medicine at NYU Langone Health.

"These results illustrate a new opportunity for health policymakers to reduce the burden of disease in their communities by mitigating the impact of environmental risk factors like  on cardiovascular health," says study lead author Michael Hadley, MD, a fellow in cardiology and incoming assistant professor of medicine at Mount Sinai.

By contrast, the study showed that other environmental factors included in the analysis—low neighborhood income levels, increased population density, and too much nighttime light exposure—were not independent predictors of risk of death, despite previous research in mostly urban settings suggesting otherwise.

For the investigation, researchers analyzed data gathered through December 2018. They then created a predictive model on overall death risk and  risk from cardiovascular disease.

The research team plans to continue its analysis and hopes to apply the predictive model to other countries with the aim of fine-tuning its predictive capacity. They say their new tool could serve as a guide for evaluating the effectiveness of environmental, lifestyle, and personal health changes in reducing mortality rates worldwide.

According to the World Health Organization, one-quarter of all deaths worldwide are now attributable to , including poor air and water quality, lack of sanitation, and exposure to toxic chemicals. Household air pollution linked to higher risk of heart attacks, death

More information: Spatial environmental factors predict cardiovascular and all-cause mortality: Results of the SPACE Study, PLoS ONE (2022).

Journal information: PLoS ONE 

Provided by NYU Langone Health 

Long-awaited federal study finds threat to Boundary Waters from hardrock mining

mining
Credit: Pixabay/CC0 Public Domain

Hardrock mining on public land in northern Minnesota risks contaminating the Boundary Waters Canoe Area Wilderness, even with measures designed to head off those problems, a long-awaited federal study says.

The environment assessment released Thursday by the U.S. Forest Service buttresses the Biden Administration's quest for a 20-year moratorium on hardrock mining on more than 200,000 acres in Superior National Forest next to the Boundary Waters.

The Forest Service report was released following years of controversy and a concerted effort to keep its work secret. Launched at the end of the Obama Administration, the study was canceled in 2018 by the Trump Administration which declared it an unnecessary "roadblock" to minerals exploration in the Rainy River Watershed, which drains into the Boundary Waters. President Joe Biden restarted the study.

During the Trump Administration, members of Congress and the Minnesota Department of Natural Resources tried unsuccessfully to get access to the research. Some of the repeated requests, including from the Star Tribune, were met with blacked out pages.

Becky Rom, National Chair of the Campaign to Save the Boundary Waters, said she is still plowing through the report—and at least 18 scientific studies attached to it. She said she feels "satisfaction" that the Forest Service was able to complete its work.

"The American people can read it, and  can be based on this nonbiased, non partisan report," Rom said.

Rom wants Congress to impose a permanent ban on hardrock mining on the federal land in the Rainy River Watershed, in Superior National Forest next to the Boundary Waters. Legislation that would do that, sponsored by U.S. Rep. Betty McCollum, D-Minn, had a hearing last month in the House Natural Resources Subcommittee on Energy and Mineral Resources.

McCollum issued a statement Thursday saying the Boundary Waters demands permanent protection.

"The proposed 20-year withdrawal is absolutely justified—and to avoid the type of political intervention we previously saw from the Trump administration, my legislation must pass to permanently protect this federal Wilderness and the interests of the American people in perpetuity," it said.

There is no Senate companion bill. Minnesota Senators Amy Klobuchar and Tina Smith have publicly said they were waiting for the study to be released before committing to further action.

The report lays out the potential consequences of allowing hardrock mining, and barring it, on nearly 20 resources, such as , tribal needs, recreation, wildlife and the local economy.

Chris Knopf, executive director of Friends of the Boundary Waters, applauded the report's environmental justice findings.

Native American people and low-income communities in Cook and St. Louis Counties in northeast Minnesota would be disproportionately affected by potential acid mine drainage pollution "due to  associated with the harvesting and consumption of wild rice, fish and fowl from the region," the report said.

In addition to seeking the moratorium, the Biden Administration in January canceled the two federal minerals leases for the proposed Twin Metals underground copper-nickel mine next to the Boundary Waters.

Twin Metals spokeswoman Kathy Graul issued a statement saying the Forest Service report is not based on science but aimed at stopping mining in northeast Minnesota. That will hurt the country's ability to supply its own clean energy minerals, she said, which contradicts the Biden administration's goals.

The company remains committed to the Twin Metals mine plan, she said.

"We have longstanding valid existing mineral rights," Graul said. "We remain confident that we will move this project forward."

After a 30-day public comment period, the report will be finalized and sent to Department of Interior's Bureau of Land Management for review and recommendation. Interior Secretary Deb Haaland is expected to make a decision on the 20-year hardrock mining moratorium by the end of the year.US moves to end ban on new uranium mining near Grand Canyon

2022 StarTribune.
Distributed by Tribune Content Agency, LLC.

World's dirtiest oil and gas fields are in Russia, Turkmenistan and Texas

oilfield
Credit: Unsplash/CC0 Public Domain

Oil and natural gas fields in Russia, Turkmenistan and Texas are the most climate-damaging on Earth, according to a first-of-its kind analysis that looks at greenhouse-gas emissions across entire supply chains and finds they vary widely. The dirtiest fields emit more than 10 times as much carbon dioxide equivalent as the least emissions-intensive sites, it finds.

Released Thursday by the nonprofit Rocky Mountain Institute, the Oil Climate Index plus Gas (OCI+) web tool ranks 135 global oil- and gas-producing resources—which together account for half of the world's supplies of those commodities—based on a full life-cycle analysis of their 2020 emissions. Russia's Astrakhanskoye natural gas field has the biggest footprint across its supply chain because of prolific leaks on pipelines and other infrastructure "downstream," according to the analysis. Turkmenistan's South Caspian basin and the Permian Basin in West Texas rank second and third; the majority of their emissions arise "upstream," during production.

Created by researchers at RMI, Stanford University, the University of Calgary and Koomey Analytics, the OCI+ tool and an accompanying report conclude that significant fossil-fuel emissions occur not just at the point of combustion, but directly at the wellhead and during processing, refining, and transportation. RMI estimates that the U.S. Environmental Protection Agency's greenhouse gas reporting program undercounts oil and gas industry emissions by a factor of two. The project received funding from the philanthropic organization of Michael Bloomberg, the founder and majority owner of Bloomberg LP, which owns Bloomberg News.

Methane, a  that is the primary component of natural gas and a powerful global-warming agent, accounts for more than half of operational emissions at sites worldwide. Curbing the flaring and venting of the gas and ensuring that oil-field equipment is working properly can help significantly reduce upstream emissions, the report says, calling methane reductions "the highest priority for the oil and gas sector."

The initiative draws on years of research by academics and nonprofit institutions, public data and satellite images. It boils down to the questions, "Who has the worst barrel, and who are the suckers buying the bad stuff?" said Deborah Gordon, senior principal of climate intelligence at RMI, the research lead. That's where the spotlight needs to be to combat climate change, she said.

Oil and gas prices have surged after demand rebounded from the COVID-19 pandemic and due to dislocations caused by Russia's war on Ukraine. Despite growth in renewable power generation, global reliance on  is poised to grow before tapering amid a transition to alternatives like wind and solar. Yet the urgency to cut emissions has grown. A United Nations-backed panel of scientists recently warned that emissions must be significantly reduced by 2030 to help avoid the catastrophic impacts that would result from warming exceeding the Paris Agreement targets of 1.5° and 2° Celsius.

The report recommends buying fuel locally as much as possible to save on transport-related emissions, but according to the OCI+ analysis, Europe might actually avoid some emissions by buying gas from the U.S. that is super-chilled into liquid and shipped across the ocean rather than from Russia. Sourcing gas from Russia is "horrid" because of leaks, Gordon said: On the OCI+ digital emissions map, Russia's pipeline system jumps out in bright yellow and orange due to concentrated methane emissions. (New York City and Boston, which have aging pipe infrastructure, show up as smaller, less intense hot spots, while Russia's liquefied natural gas export terminal in Siberia is a blip.)

For decades, policies have targeted reducing emissions from cars and power plants, which puts the responsibility on the consumer with little transparency on emissions from producers themselves, Gordon said. "Conventional wisdom is that the consumer is responsible for 86% of the emissions from the barrel." But the research shows that's not the case for the most polluting oil and gas fields, she said.

The researchers also estimated a price for carbon, and OCI+ shows how accounting for life-cycle emissions would tack on more than $50 per barrel for the highest-emitting sites. If a fee reflecting the  to carbon were imposed today, the production-weighted average cost for the 135 fields would be $7 per barrel of oil equivalent, less than $1 for refiners and $4 for shippers, according to the analysis. The values are based on a cost of $56 per metric ton that was modeled by the U.S. government. (Carbon fees can be adjusted in OCI+ to account for different scenarios.)

Aging oil and gas fields become more GHG-intensive as more energy and water are needed to extract the fuel from underground. The average emissions of a typical large oil field will double over 25 years, according to past research. Two prime candidates for decommissioning are the Minas field in Indonesia and Wilmington in California, since they already require large injections, Gordon said.

The  also breaks out the share of sites' emissions from flaring, or burning off excess natural gas. This practice is notoriously common in the Permian Basin, where oil is the most profitable fuel and natural gas is a nuisance byproduct.

"The Permian looks terrible," Gordon said, but "if Texas cleans up its act and really focuses on not leaking methane and not flaring its gas, it will be there right at the top" of the lowest-emitting areas."Energy sector methane emissions underreported: report

2022 Bloomberg L.P.
Distributed by Tribune Content Agency, LLC.

Drought hits Italy's hydroelectric plants

The Po River is suffering its worst drought for 70 years. 
The Po River is suffering its worst drought for 70 years. .

Hydroelectric power in Italy has plunged this year thanks to a drought that has also sparked water restrictions and fears for agriculture, industry sources said Friday.

Hydropower facilities, mostly located in the mountains in the country's north, provide almost one fifth of Italy's energy demands.

But the lack of rain is causing problems, at a time when Rome is desperately trying to wean itself off its dependence on Russian gas due to the war in Ukraine.

"From January to May 2022, hydro production fell by about 40 percent compared to the corresponding period in 2021," a spokesman for Utilitalia, a federation of water companies, told AFP.

"Hydro production has been steadily decreasing since July 2021," he said, blaming "the severe shortage of water even at high levels".

An industry source told AFP that while the situation was constantly changing, estimates for the first six months of 2022 suggest nationwide hydroelectric generation will be almost half the equivalent period of 2021.

One small plant near Piacenza, southeast of Milan, was shut indefinitely on June 21 due to low levels on the River Po that feeds it, the Enel energy company said.

"Considering the current drought situation, other hydro plants are not operating at full capacity," a spokesman added, without giving further details.

The Po River is Italy's largest reservoir of fresh water. Much of it used by farmers, but is suffering its worst drought for 70 years.

Italy's largest agricultural association, Coldiretti, said the drought is putting over 30 percent of national agricultural production and half of livestock farming in the Po Valley at risk.

On Friday, the northern region of Lombardy called a state of emergency due to the drought, that recommends, among other measures, less water use by consumers and directs mayors to curtail non-essential water use, such as street washing and watering parks and sportsgrounds.

Further to the west in Piedmont, water is being rationed in more than 200 municipalities, according to the ANSA news agency.

The Maggiore and Garda lakes are both far lower than usual for this time of year, while further south, the level of the River Tiber that runs through Rome has also dropped.

Italy's Po Valley rations water amid record drought

© 2022 AFP

Murdering the dead: Amadeo Bordiga on capitalism and other                           disasters

Climate change affects the likelihood of armed conflict

Climate change affects the likelihood of armed conflict
Climate change affects the likelihood of armed conflict. Credit: UPV

Climate change influences the likelihood and duration of armed conflicts in Africa. This is the finding of a study carried out by a team from the INGENIO Institute, a joint center of the Universitat Politècnica de València (UPV) and the Consejo Superior de Investigaciones Científicas (CSIC), together with the University of Rome III and the University of Urbino Carlo Bo, published in the latest issue of the journal Economía Política.

The team of researchers based their study on data from the African continent from 1990 to 2016. Using a negative binomial regression , they assessed whether certain climatic phenomena, in combination with the socio-economic characteristics of the areas studied, affected the likelihood of a conflict breaking out and, if it did, its duration.

Among its findings, the study states that a prolonged increase in temperature and precipitation increases the probability of conflict beyond the affected area by four to five times, specifically in populations up to a radius of about 550 km.

The study also concludes that, in Africa,  due to drought increase the possibility of conflict, especially if  persist for at least three years. Conversely, excess rainfall triggers conflict, but in a very short period of time.

Implications for adaptive policies

"The results we have obtained have far-reaching implications for territorial policies on the African continent. For example, changes in  influence the likelihood of conflict over large areas, which means that the design of climate adaptation policies must consider the particularities of each territory," says Davide Consoli, a researcher at the INGENIO Institute and one of the authors of the study.

The INGENIO, University of Rome and University of Urbino team also points out that the persistence of violence requires the implementation of  adaptation strategies designed in combination with peacekeeping measures, especially in those areas most prone to armed conflict.

"These measures are essential in the design and implementation of adaptive strategies for climate resilience. In fact, poorly designed adaptation interventions can exacerbate existing inequalities and increase the risk of ," concludes Consoli.Physical intimate partner violence in Colombia costs $90 million annually 


More information: Federica Cappelli et al, Climate change and armed conflicts in Africa: temporal persistence, non-linear climate impact and geographical spillovers, Economia Politica (2022). DOI: 10.1007/s40888-022-00271-x
Provided by Universitat Politècnica de València

Theories on socio-political evolution put to the test

Theories on socio-political evolution put to the test
Apparent stasis interspersed by periods of rapid change, associated with major
 technological “revolutions”, triggered by novel military technologies. The longest period o
no systematic change was during the nearly two millennia between the Iron/Cavalry 
Revolution and the Gunpowder Revolution. Although empires rose and fell during this
 period, the maximum areas of empires fluctuated around the 3 million square kilometer
 level. [Brown curve: average territory of the three largest polities. Tan shading: mean ± SD
 (note the logarithmic scale of the Y-axis)]. 
Credit: Seshat: Global History Database

During the past 10,000 years—the Holocene—human societies became larger and ever more complex. An international team of scientists led by Peter Turchin from the Complexity Science Hub Vienna (CSH) set out to test various theories on what drove this process. According to its analyses of data from Seshat: Global History Databank, the best explanation for the evolution of socio-cultural complexity is a combination of increasing agricultural productivity and the invention, or adoption, of military technologies (most notably, the invention of iron weapons and cavalry in the first millennium BCE). The study just appeared in the journal Science Advances.

Many theories need to be tested

"Countless explanations have been offered over the years to explain the incredible 'Holocene transformation,'" Peter Turchin points out. Some theorists, like Jared Diamond, say that the transition to agriculture was both the necessary and sufficient condition for the rise of complex societies. Other theories focus on conflict theories, class struggle, the threat from external warfare or functionalist explanations, e.g., that complex social organization evolved to solve certain problems faced by societies.

"All these theories could cite historical examples seemingly supporting their putative mechanisms; but none have ever proven decisively more convincing than the others," says Turchin, who leads a team investigating Social Complexity and Collapse at the CSH. Along with fellow members of the Seshat: Global History Databank project, he applied the tried-and-true scientific method: determine what each body of  proposes as the key factors driving the rise of complexity and see which one best explains the available empirical evidence. The results reveal that many long-standing and influential theories receive little support from data.

Plow and sword drive human history

The best explanation for the observed patterns offers the framework of cultural evolution. "Essentially, the conflict between groups over territory and resources put a tremendous selective pressure on societies," Turchin explains. It favored societies that were ever larger, more populous, could store more information and communicate effectively at greater distances and were capable of mobilizing larger numbers of people for common projects like defense and maintaining public infrastructure. "While previous theories contained some of these elements, for the first time a single, coherent framework has been provided and demonstrated with the historical record," says Turchin.

The scholars also identified several major "transformations" during the Holocene: Following the invention of key technologies like bronze and later iron smelting or cavalry warfare and associated tactics, the scale of the largest societies rose dramatically before leveling off to a relatively stable size. New innovations and cultural adaptations continued to build until another breakthrough was achieved, propelling societies to new heights before stabilizing again, while the whole process began anew.

Big Data reveal decisive patterns

"This paper is the culmination of more than a decade of intensive collaboration," says Harvey Whitehouse, corresponding author on the paper and one of the founding directors of Seshat. "Our study utilized more than a hundred variables—meticulously coded—relating to 373 societies that flourished between 9600 BCE and 1900 CE. With the help of such 'big' data we are able to place theories of world history head-to-head and see which ones win."

The scientists view this study as a breakthrough in the understanding of how  have evolved since the very first farmers settled down thousands of years ago. In the future, the team will adopt similar methods to test the diverse group of ideas that have been proposed in other areas of research, such as the causes of societal collapse or the role of religious ideology in cultural evolution.

The ultimate goal, as Turchin puts it, is to "put those influential ideas that do not bear out against the empirical record to bed, once and for all."What drove the invention of military technologies?

More information: Peter Turchin et al, Disentangling the Evolutionary Drivers of Social Complexity: A Comprehensive Test of Hypotheses, Science Advances (2022). DOI: 10.1126/sciadv.abn3517. www.science.org/doi/10.1126/sciadv.abn3517

Journal information: Science Advances 

Provided by Complexity Science Hub Vienna 

USA

Arsenic in private well water contributes to low birth weight even at low levels

well water
Credit: Unsplash/CC0 Public Domain

In the largest epidemiologic study of arsenic and birth outcomes to date, researchers from the University of Illinois Chicago and collaborating institutions estimated arsenic levels in U.S. private well water sources by county and compared estimates to documented birth outcomes. They found an association between estimated groundwater arsenic concentration and risk of low birth weight.

The findings, which are reported in the journal Environment International, suggest that efforts to reduce arsenic in private wells could help more babies be born at healthy weights, particularly in .

Arsenic is a natural element that, in some forms, is highly toxic when consumed through  used for drinking, food preparation or crop irrigation. All  in the U.S. are required to monitor , but private wells—which are used by 14% of people in the country—are unregulated. As a result, there is limited comprehensive data on the extent of arsenic contamination and associated  in the U.S.

"While we have known that arsenic is dangerous, this lack of data on exposures from private wells has left some U.S. communities disproportionately vulnerable to adverse health events from the contaminant," said study co-author Maria Argos, associate professor of epidemiology and associate dean for global health at the UIC School of Public Health. "Developing a method to estimate these  was the first step in understanding the true exposure risk for all people living in the U.S."

Using several machine learning algorithms, the researchers characterized the probability that specific ranges of arsenic concentration occurred in groundwater sources in nearly all 3,000-plus counties in the conterminous U.S.

"These machine learning models are based on data collected by the USGS from over 20,000 private wells located throughout the U.S.," said Melissa Lombard, hydrologist at the U.S. Geological Survey, who is also a co-author of the study. "The models allow us to estimate arsenic in areas where there are no data. The development of the models was a collaboration between hydrologists and epidemiologists to explore connections between arsenic exposure from drinking water and human health outcomes."

Probabilistic model estimates and private well usage data were linked to all live birth certificates issued in 2016. The researchers compared the models to data on , which are tracked by public health departments, looking at gestational age and .

While there was no observed association in gestational age, there was an inverse association with birthweight, even at moderately low levels.

The model predicted that counties with a higher probability of private well arsenic concentrations exceeding 5 micrograms per liter were associated with a birth weight 1.8 grams lower than average. Similarly, counties with a higher probability that private well arsenic concentrations exceeded 10 micrograms per liter—the standard followed by the —were associated with a 2.8-gram reduction in birth weight, compared to average.

The researchers said the association they found is somewhat limited because the analysis was based on estimates of exposures rather than individual-level measured exposures, but the limitations of their model may be an underestimate of the true association.

"Birth outcomes are an indicator of health and chronic disease risk throughout the lifespan, and the results of our study offer evidence that building awareness of exposures and expanding testing resources in communities that rely on private wells should be a public health priority," Argos said.

Additional co-authors of "Arsenic in private well water and birth outcomes in the United States" are Catherine Bulka, Molly Scannell Bryan, Melissa Lombard, Scott Bartell, Daniel Jones, Paul Bradley, Veronica Vieira, Debra Silverman, Michael Focazio, Patricia Toccalino, Johnni Daniel, Lorraine Backer, Joseph Ayotte and Matthew Gribble. Collaborating institutions include the National Institutes of Health, the U.S. Centers for Disease Control and Prevention, the University of North Carolina and the University of Alabama.New report shows high levels of arsenic and uranium in some wells

More information: Catherine M. Bulka et al, Arsenic in private well water and birth outcomes in the United States, Environment International (2022). DOI: 10.1016/j.envint.2022.107176

Journal information: Environment International 

Provided by University of Illinois at Chicago 

New study offers insight into past—and future—of west-side wildfires

Peer-Reviewed Publication

USDA FOREST SERVICE - PACIFIC NORTHWEST RESEARCH STATION

Smoke plume from the Riverside Fire on Mount Hood National Forest, Oregon, in September 2020 

IMAGE: SMOKE PLUME FROM THE RIVERSIDE FIRE ON MOUNT HOOD NATIONAL FOREST, OREGON, IN SEPTEMBER 2020 view more 

CREDIT: USDA FOREST SERVICE

When the 2020 Labor Day Fires torched more than 300,000 hectares over the span of two weeks in parts of western Oregon and Washington, they devastated communities and put the threat of west-side fires squarely into focus. A new study led by the USDA Forest Service’s Pacific Northwest Research Station examines the context surrounding the fires and offers insight into the historical role of large, high-severity fires—and the future of wildfires—west of the Cascades.   

"Without a doubt, the 2020 Labor Day Fires were a significant fire event on many levels, and one that was a wake-up call for the region,” said Matthew Reilly, research forester and lead author of the study, which is published in the journal Ecosphere. “The goal of our study was to help understand how this event compared to past west-side fires so that we can help inform adaptation strategies aimed at preventing or mitigating similar events in the future.” 

Drawing from a literature review, extensive historical data, and new analysis, Reilly and his co-authors explored five questions surrounding the 2020 Labor Day Fires: how the 2020 fires compared with historical fires in the region, the role of weather and climate, the effects of forest management and pre-fire forest structure on burn severity, the impacts of these fires on west-side landscapes, and what can be done to adapt to similar fires in the future. Ultimately, they found that the 2020 fires were remarkably consistent with historical fires on the west side, both in terms of their timing and size and the cause of their rapid spread—dry conditions combined with strong east winds.  

“Our findings suggest that these severe fires are normal for west-side landscapes when you look at historical fire regimes at longer time scales,” Reilly said. In fact, the researchers identified similarly large historical fires in the early 20th century under similar weather conditions—some even burning right around Labor Day—in some of the same locations that burned in 2020.  

Because of the abundant and productive forests characteristic of the west side and the driving role of extreme winds, conventional fire management tools used in dry forests, like prescribed burning and fuels management, will likely be less effective in west-side forests than they are on the east side. This is particularly the case, their study found, when fire weather conditions are as extreme as those witnessed during the 2020 fires.

“Our study indicates we need very different approaches and adaptation strategies in west-side forests compared to those we use in dry forests,” Reilly said. 

The study was conducted as part of the Pacific Northwest Research Station’s ongoing West-side Fire Research Initiative, which was launched in 2019 to develop science-based tools to help resource managers respond to wildfire risk in west-side forests. The study’s coauthors are from the Washington State Department of Natural ResourcesUniversity of WashingtonOregon State University, and USDA Forest Service’s Pacific Northwest Region.   


Highlights

  • The 2020 Labor Day Fires were much larger and more severe than others in the recent record, but they were remarkably consistent with many historical fires. Strong east winds and dry conditions are the common denominators in both large historical fires of the past and the 2020 fires.  
     
  • Forest management and fuel treatments are unlikely to influence fire severity in the most extreme wind-driven fires, like the 2020 Labor Day Fires. Pre-fire forest structure, largely the result of previous forest management activities, had little effect on burn severity when east winds were strong during the 2020 fires.
     
  • Fuel treatments around homes and infrastructure may still be beneficial under low and moderate fire-weather conditions. 
     
  • Adaptation strategies for similar fires in the future in west-side communities might, instead, focus on ignition prevention, fire suppression, and community preparedness.  


Multiple lab analyses of Antarctic minerals offer a better understanding of Mars

Multiple Lab Analyses of Antarctic Minerals Offer a Better Understanding of Mars
Elizabeth C. Sklute uses a Bruker ALPHA Fourier-transform infrared spectrometer to study the mineral products created through the bioreduction of iron (hydr)oxides by microbes. Credit: E.C. Sklute, PSI.

Results of multiple and complementary lab analyses of minerals found in samples of material from Antarctica could give scientists a better understanding of the surface and subsurface environment of Mars, and indicate locations of potentially habitable subsurface locations, says a new paper by Planetary Science Institute Research Scientist Elizabeth C. Sklute.

Samples of intermittent brine discharge at Blood Falls at the terminus of Taylor Glacier, Antarctica were collected by Jill Mikucki of the University of Tennessee, Knoxville across two field seasons. The brine flows out from a subsurface body of water that has been isolated for possibly thousands of years. The brine flow deposits material that [is the] surface manifestation of a subsurface environment that hosts a thriving community of microbial life. Initially the brine is clear, but the deposits reddens with time on the surface, earning Blood Falls its name. These surface grab samples were tested at Sklute's lab using Fourier transform infrared, Raman, visible to near-infrared, and Mössbauer spectroscopies. Samples were further characterized using microprobe and inductively coupled plasma optical emission spectroscopy for chemistry, and X-ray diffraction, scanning electron microscopy, and transmission  for mineralogy, crystallography, and chemistry.

"We took dry samples and we analyzed them by shining light of different wavelengths at them. Each wavelength of light makes the bonds and atoms in a sample react in a different way. Using them all together, it lets us figure out what is there," said Sklute, lead author of "A Multi-Technique Analysis of Surface Materials From Blood Falls, Antarctica" that appears in Frontiers in Astronomy and Space Science.

"We take each of these little pieces of information and we paste them together to form a whole image because one technique may be really good at telling you if certain things are there and another technique may completely miss it, simply because the bonds or atoms don't react to those energies," Sklute said. "These results showcase the strengths and weaknesses of different analytical methods and underscore the need for multiple complementary techniques to inform the complicated mineralogy at this locale.

"Combining these techniques, we have determined the detailed mineralogical assemblage of this Mars analog site and we have learned that the deposit is mostly carbonates and that the red color of Bloody Falls is from the oxidation of dissolved ferrous ions (Fe2+) as they are exposed to air, likely in combination with other ions. Instead of forming ferric (Fe3+) minerals, which is what usually happens on Earth, this brine turns into amorphous (no long range structure) nanospheres containing iron and a bunch of other elements, like chlorine and sodium. Amorphous materials have been found to be ubiquitous in Gale Crater on Mars by the Curiosity rover," Sklute said. "To date, we haven't been able to determine what the amorphous material on Mars is made of. Finding what may be similar material in a natural environment on Earth is really exciting.

"We do not say this is a biosignature because it is not produced by the microbes but rather by the chemistry where the microbes live. It does, however, give us a road map for a place to look on another frozen world," Sklute said.

"The method we have used in this study will also provide a powerful tool to help us understand how things can change with time if returned from another planet. It helps us understand the variability in phases that are really below the detection limit of most common techniques," Sklute said.

PSI Senior Scientist M. Darby Dyar is a co-author on the paper.Machine learniElizabeth C. Sklute et al, A Multi-Technique Analysis of Surface Materials From Blood Falls, Antarctica, Frontiers in Astronomy and Space Sciences (2022). DOI: 10.3389/fspas.2022.843174

Provided by Planetary Science Institute