Saturday, August 01, 2020

Virus effects to last decades, WHO says six months on

Credit: CC0 Public Domain

The WHO said Friday that coronavirus pandemic effects would be felt for decades as its emergency committee assessed the situation six months after sounding its top alarm over the outbreak.

The novel coronavirus has killed nearly 675,000 people and infected at least 17.3 million since it emerged in China last December, according to a tally from official sources compiled by AFP.

The World Health Organization's emergency committee, comprising 18 members and 12 advisers, is meeting for the fourth time over the COVID-19 crisis.

"It's sobering to think that six months ago, when you recommended I declare a public health emergency of international concern (PHEIC), there were less than 100 cases and no deaths outside China." WHO chief Tedros Adhanom Ghebreyesus said as the meeting began.

"The pandemic is a once-in-a-century health crisis, the effects of which will be felt for decades to come."

The committee can propose new recommendations or amend existing ones.

However, there is little doubt that the WHO will maintain the pandemic's status as a PHEIC—its highest level of alarm—first declared on January 30.

The WHO has been sharply criticised for the length of time it took to declare an international emergency.

The United States, which accused the organisation of being too close to China, officially began its withdrawal from the organisation in July.

The agency has also been criticised for recommendations deemed late or contradictory, in particular on wearing masks, or the modes of transmission of the virus.

Questions unanswered

"Many scientific questions have been resolved; many remain to be answered," Tedros said.

"Early results from serology studies are painting a consistent picture: most of the world's people remain susceptible to this virus, even in areas that have experienced severe outbreaks.

"Many countries that believed they were past the worst are now grappling with new outbreaks. Some that were less affected in the earliest weeks are now seeing escalating numbers of cases and deaths. And some that had large outbreaks have brought them under control."

The highly restrictive lockdowns enforced to deal with the pandemic earlier this year caused economic turmoil and an effective vaccine may be the only long-term solution to the highly contagious respiratory disease.

"Although vaccine development is happening at record speed, we must learn to live with this virus, and we must fight it with the tools we have," said Tedros.
© 2020 AFP


JUL 30, 2020
Report linking 5G to COVID-19 swiftly debunked
Related Stories

WHO's emergency panel reviews pandemic

JUL 31, 2020
STRANGERS ON A TRAIN

Study reveals COVID-19 transmission rate on trains
by University of Southampton JULY 31,2020
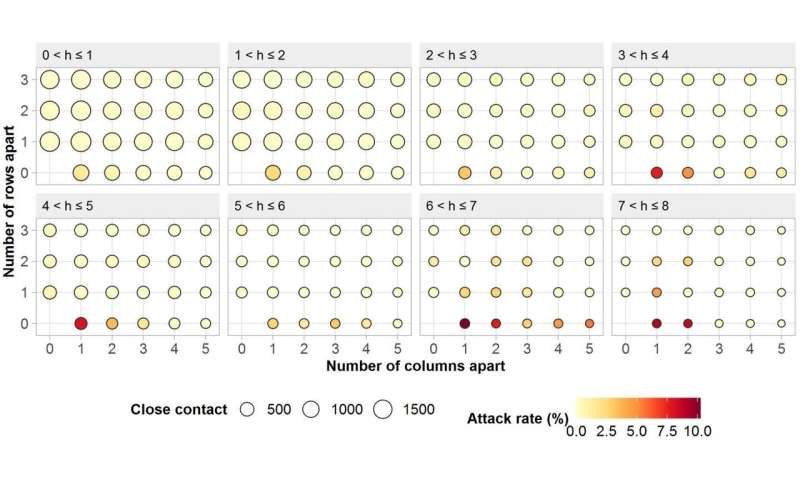
Attack rate of COVID-19 per different seats and co-travel time on a high-speed train Credit: University of Southampton

A study by scientists from the University of Southampton has examined the chances of catching COVID-19 in a train carriage carrying an infectious person.

Based on high-speed routes in China, researchers from WorldPop found that for train passengers sitting within three rows (widthwise) and five columns (lengthwise) of an infected person (index patient) between zero and ten percent (10.3) caught the disease. The average rate of transmission for these 'close contact' travelers was 0.32 percent.

The study, in collaboration with the Chinese Academy of Sciences, China Academy of Electronics and Information Technology, and Chinese Centre for Disease Control and Prevention, also showed that passengers traveling in seats directly adjacent to an index patient suffered the highest level of transmission, with an average of 3.5 percent contracting the disease. For those sitting on the same row, the figure was 1.5 percent.

The 'attack rate' for each seat—the number of passengers in a given seat diagnosed with COVID-19, divided by the total number of passengers traveling in the same seat—increased by 0.15 percent for every hour that a person traveled with an index patient. For those in adjacent seats, this rate of increase was higher at 1.3 percent per hour.

Interestingly, the researchers found that only 0.075 percent of people who used a seat previously occupied by an index patient went on to contract the disease.

Details are published in the journal Clinical Infectious Diseases.

The WorldPop team, experts in population mapping, used sophisticated modeling to analyze anonymised itinerary and infection data relating to train passengers on China's high-speed G train network. This included those who had COVID-19 at the time of travel and their close contacts (who showed symptoms within 14 days of travel). The data, covering a period between 19 December 2019 and 6 March 2020, included 2,334 index patients and 72,093 close contacts. Their travel times ranged from between less than an hour to eight hours.

Lead investigator, Dr. Shengjie Lai, comments, "Our study shows that although there is an increased risk of COVID-19 transmission on trains, a person's seat location and travel time in relation to an infectious person can make a big difference as to whether it is passed on. The findings suggest that during the COVID-19 epidemic it is important to reduce the density of passengers and promote personal hygiene measures, the use of face coverings and possibly carry-out temperature checks before boarding."

The researchers conclude that given the attack rates estimated for passengers in the same row as an index patient, a safe social distance of more than one meter is required for one hour spent traveling together. After two hours of contact, they consider a distance of less than 2.5 meters may be insufficient to prevent transmission.

Director of WorldPop, Professor Andy Tatem adds: "Our research is the first to quantify the individual risk of COVID-19 transmission on public transport based on data from epidemiological investigations of disease cases and their close contacts on high-speed trains.

"It shows that the transmission risk not only relates to the distance from an infected person, but also the time in their presence. We hope it can help to inform authorities globally about measures needed to guard against the virus and in-turn help to reduce its spread."


Explore further Follow the latest news on the coronavirus (COVID-19) outbreak

More information: Maogui Hu et al. The risk of COVID-19 transmission in train passengers: an epidemiological and modelling study, Clinical Infectious Diseases (2020).

Journal information: Clinical Infectious Diseases


Provided by University of Southampton


We thought COVID-19 was just a respiratory virus—we were wrong

by Ariel Bleicher, Katherine Conrad, 
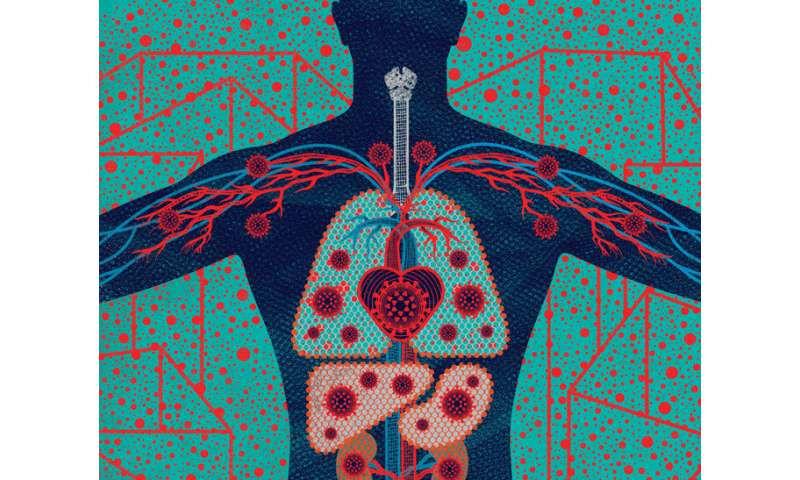
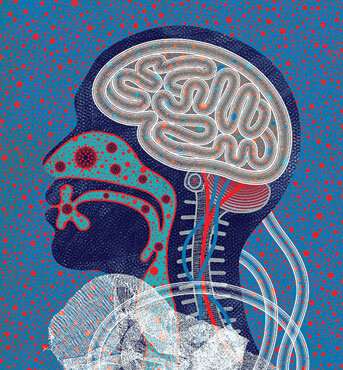
Credit: Anna and Elena Balbusso

In late January, when hospitals in the United States confirmed the presence of the novel coronavirus, health workers knew to watch for precisely three symptoms: fever, cough, and shortness of breath. But as the number of infections climbed, the symptom list began to grow.

Some patients lost their sense of smell and taste. Some had nausea or diarrhea. Some had arrhythmias or even heart attacks. Some had damaged kidneys or livers. Some had headaches, blood clots, rashes, swelling, or strokes. Many had no symptoms at all.

By June, clinicians were swapping journal papers, news stories, and tweets describing more than three dozen ways that COVID-19, the disease the coronavirus causes, appears to manifest itself. Now researchers at UC San Francisco and around the world have begun taking a closer look at this dizzying array of symptoms to get at the disease's root causes. They are learning from people inside the hospital and out; people on the brink of death and only mildly sick; people newly exposed and recovered; people young and old, Black, brown, and white. And they are beginning to piece together the story of a virus unlike any known before.

How infection sets in

Viruses lead a curious purgatorial existence of being neither fully alive nor dead. Enveloped in a protein cloak, a virus consists almost entirely of genetic material—DNA or RNA, the blueprints for all of life. But it can't reproduce on its own. To survive, it must break into a cell and co-opt the cell's gene-copying machinery.

The novel coronavirus, an RNA virus named SARS-CoV-2, has become notorious for its skill at breaking and entering human cells. Its tools of choice are the protein spikes protruding from its surface—a feature that distinguishes all coronaviruses. The spikes of SARS-CoV-2 are the crème de la crème: By the luck of the evolutionary draw, they are able to easily grab hold of protein gates on human cells known as ACE2 receptors and, like jackknives, pry these gates open.

"You can think of an ACE2 receptor like a docking site," says Faranak Fattahi, Ph.D., a UCSF Sandler Fellow. When the coronavirus pandemic hit San Francisco, Fattahi repurposed her laboratory to study this key receptor, which normally plays a role in regulating blood pressure. "When the virus lands on it," she says, "it initiates a molecular process that brings the virus inside the cell."


If you're exposed to SARS-CoV-2—say, from a cough or sneeze—the virus will likely first encounter ACE2 receptors on cells in your nose or throat. But these receptors also populate your heart, gut, and other organs. Fattahi's team has found evidence suggesting that male sex hormones such as testosterone may increase the number of ACE2 receptors that cells produce, which could help explain why SARS-CoV-2 seems to wreak greater havoc on men than on women and why kids rarely get sick. "The fewer ACE2 receptors, the less risk of infection—that's the idea," she says, adding that this hypothesis for the disease's gender gap is only one of several.

Once inside a few initial host cells, the virus sets them to work churning out copies of itself. Within hours, thousands of new virus particles begin bursting forth, ready to infect more cells. Although SARS-CoV-2 is less deadly than the original SARS virus, which emerged in 2002, it replicates more rapidly. Also unlike SARS, which primarily infects the lungs, SARS-CoV-2 replicates throughout the airway, including in the nose and throat, making it highly contagious—like the common cold.

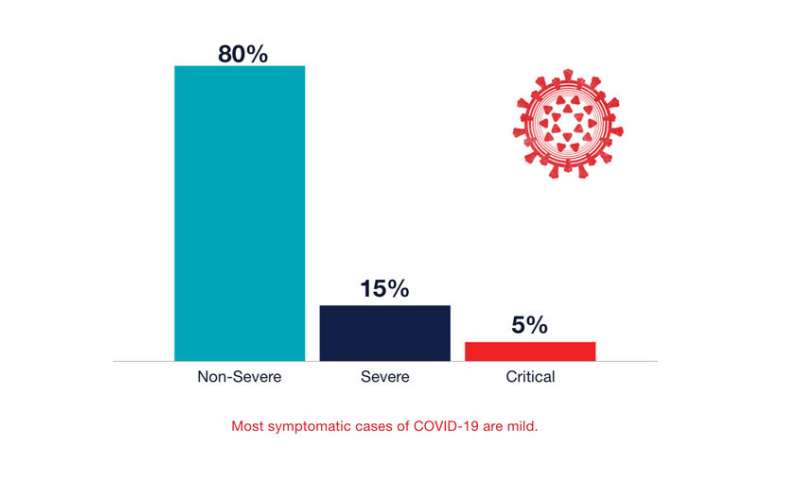
However, infection with SARS-CoV-2 usually doesn't feel like a cold. Fewer than 20 percent of infected people who eventually show up at a hospital report having had a sore throat or runny nose. During the first few days of being infected, you're more likely to have a fever, dry cough or, peculiarly, lose your sense of smell or taste.

Most likely, though, you won't feel sick at all. When UCSF researchers tested people for SARS-CoV-2 in San Francisco's Mission District, 53 percent of those infected never had any symptoms. "That's much higher than expected," says Monica Gandhi, M.D., MPH, a UCSF professor of medicine with expertise in HIV. Surveys of outbreaks in nursing homes and prisons show similar or even higher numbers. "If we did a mass testing campaign on 300 million Americans right now, I think the rate of asymptomatic infection would be somewhere between 50 percent and 80 percent of cases," Gandhi says. Millions of people may be spreading the virus without knowing it, she points out, making asymptomatic transmission the Achilles' heel of efforts to control the pandemic—and highlighting the importance of universal masking.
Spikes on the virus’s surface act like jackknives to break and enter human cells. Credit: UCSF

"The majority of people who have COVID-19 are out in the community, and they are either asymptomatic or only mildly ill," says Sulggi Lee, M.D., Ph.D., a UCSF assistant professor of medicine. When the coronavirus pandemic hit San Francisco in early March, Lee conceived a study to investigate why. She scrambled to assemble a team and procure funding and equipment. She borrowed a colleague's mobile clinic—a van outfitted with an exam table and a phlebotomy chair—so that her team could drive around the city, collecting samples from infected people. Lee hopes data from the study, called CHIRP (COVID-19 Host Immune Response Pathogenesis), will show how people's immune systems respond as SARS-CoV-2 starts to gain a foothold in their bodies.

"A lot is riding on that initial response," she says. If Lee and her collaborators can figure out the biological processes that allow some infected people to stay relatively well, they can perhaps use that knowledge to prevent others from falling severely ill.

Battling in the lungs

True to its name, SARS-CoV-2 (which stands for severe acute respiratory syndrome coronavirus 2) is first and foremost a bad respiratory virus. If your immune system doesn't defeat it at its landing site in your nose or throat, it will advance down your windpipe, infiltrating the cells lining your lungs' branching air tubes. At the tubes' ends, tiny air sacs called alveoli pass oxygen to your blood. As the virus multiplies, the alveoli may fill with fluid, shutting down this critical gas exchange. Your blood-oxygen level may drop and, typically about six days into an infection, you may start feeling short of breath.

What causes this mayhem? "Some of it is definitely caused by the virus itself," says Michael Matthay, M.D., a UCSF professor of medicine who has studied acute respiratory diseases for more than 30 years. Inevitably, a fast-replicating virus will kill or injure many of the lung cells it infects; the more cells it infects, the more ruin it will leave in its wake.

But SARS-CoV-2 doesn't appear to be a savage destroyer of cells. Although it's too early to know for sure, the virus's fatality rate seems to be roughly 10 times that of the flu. "You would think that's because it's just a killing machine," says Max Krummel, Ph.D., UCSF's Smith Professor of Experimental Pathology and chair of the Bakar ImmunoX initiative. So far, however, the science suggests otherwise.

"One of the weirder things about this new coronavirus is it doesn't seem to be incredibly cytopathic, by which we mean cell-killing," Krummel says. "Flu is really cytopathic; if you add it to human cells in a petri dish, the cells burst within 18 hours." But when UCSF researchers subjected human cells to SARS-CoV-2, many of the infected cells never perished. "It's pretty compelling data that maybe we're not dealing with a hugely aggressive virus," Krummel says.

The bigger provocation, he suspects, may be your own immune system. Like any pathogen, SARS-CoV-2 will trigger an immune attack within minutes of entering your body. This counterstrike is extraordinarily complex, involving many tactics, cells, and molecules. In a UCSF study called COMET (COVID-19 Multi-Phenotyping for Effective Therapies), Krummel and other scientists have been observing this immune warfare in more than 30 people admitted to UCSF hospitals with COVID-19 and other respiratory infections. "What we're doing is looking at patients' blood, their genes, and the secretions from their noses and lungs, and we're asking, 'What's your army? What's your response strategy?'"

An early analysis of COMET data, Krummel says, suggests that the immune systems of many hospitalized patients mobilize differently—and more aggressively—against SARS-CoV-2 than against influenza viruses, which cause the flu. Their lungs are ravaged, these data suggest, not by the virus alone but by the detritus of an immunological battle gone awry. This rogue immune response could explain why, around day 11 of a COVID-19 infection, patients often develop a severe pneumonia known as acute respiratory distress syndrome, or ARDS.

Ultimately, COMET seeks to find COVID-19 therapies that can rein in an overeager immune system in order to prevent or treat ARDS. But that feat won't be easy, says Carolyn Calfee, M.D., MAS '09, an ARDS expert, UCSF professor of medicine, and co-leader of the study. Too much or the wrong kind of intervention, she explains, could cripple a person's immune system to the point where it can't clear an infection. "It's a fine line between therapeutic and deleterious," Calfee says. "We're trying to find that balance."

Typically, people who die from COVID-19 ARDS die around day 19. Reported rates of mortality have varied widely, with the highest rates being where the pandemic has hit hardest, overwhelming hospital resources and staff. At UCSF hospitals—likely due to the city's early shelter-in-place orders, which prevented an initial surge of COVID-19 cases—so far only 10 of 85 critically ill patients have died.
SARS-CoV-2 replicates throughout the airway, making it highly contagious, like the common cold. Credit: Anna and Elena Balbusso/UCSF

"The good news is that we've been doing clinical trials of best-care practices for ARDS since 1998," Matthay says. Thanks to research by him and others, for example, clinicians have long known which ventilator settings result in the fewest deaths and how to flip patients onto their stomachs—a technique known as proning—to best help them breathe. If public health measures can keep hospital admissions low so that frontline providers can make good use of the skills and knowledge they already have, we may find that we have less to fear from SARS-CoV-2 than we thought.

On the other hand, the virus behaves in ways that are still mysterious.

Heart failure

In April, Susan Parson, M.D., a Bay Area medical examiner, made a startling discovery. For nearly two months, officials had believed that the first people in the U.S. to die from COVID-19 had died of respiratory failure in Washington state in late February. At the time, the U.S. Centers for Disease Control and Prevention limited testing to people who had respiratory symptoms and had recently traveled to China or otherwise been exposed to the virus. Those restrictions, however, turned out to be misguided.

As a medical examiner for California's Santa Clara County, Parson had done a routine autopsy on a 57-year-old woman named Patricia Dowd, who had died suddenly at home on February 6. In Dowd's tissues, Parson found the cause of her death: SARS-CoV-2. But the virus hadn't wrecked Dowd's lungs. In fact, she had only mild pneumonia. Instead, SARS-CoV-2 had ruptured her heart.

Meanwhile, epidemiologists began learning that preexisting heart disease and related conditions put people at greater risk of suffering and dying from COVID-19. "We're finding that many patients who have more severe forms of the illness are obese, they are diabetic, they are hypertensive," says cardiologist Nisha Parikh, M.D., a UCSF associate professor who specializes in population health research. Such risk factors, she says, are unusual. "They're not ones that really stood out in prior epidemics."

Clinicians, too, were seeing surprising numbers of COVID-19 patients develop heart problems—muscle weakness, inflammation, arrhythmias, even heart attacks. "We're not used to respiratory viruses having such dire consequences on the heart in such apparently high numbers," says cardiologist Gregory Marcus, M.D., MAS '08, UCSF's Endowed Professor of Atrial Fibrillation Research. Many patients whose hearts acted up also had failing lungs. But others had no other symptoms or, like Dowd, only mild ones.

Since March, Marcus has co-led one of the largest community surveys to better understand the spread of SARS-CoV-2 and its myriad effects. The study, dubbed COVID-19 Citizen Science, has so far enrolled more than 27,000 people; anyone with a smartphone can participate. Marcus plans to also start collecting data from wearable devices, including Fitbits and Zio patches, which wirelessly monitor heart rhythms. "There may be large numbers of people who are suffering from cardiovascular effects of COVID-19 in the absence of other symptoms," Marcus says. "I'm worried we're missing those cases."

It stands to reason that SARS-CoV-2 affects the heart. After all, heart cells are flush with ACE2 receptors, the virus's vital port of entry. And, indeed, laboratory experiments suggest that the virus can enter and replicate in cultured human heart cells, says Bruce Conklin, M.D., a professor of medicine and an expert in heart-disease genetics at UCSF and the Gladstone Institutes.

But Conklin doesn't think SARS-CoV-2 necessarily kills heart cells outright. Rather, in the process of copying itself, the virus steals pieces of the genetic instructions that tell the heart cells how to do their job. "It's hauling away and hijacking stuff that's necessary for the heart to beat," he says. He is currently testing this hypothesis using human heart cells grown in cup-sized vessels in the lab of Todd McDevitt, Ph.D., a bioengineer at UCSF and the Gladstone Institutes.

It's also possible, however, that an infected person's own immune system may do the majority of the damage in the heart, as it appears to do in the lungs. "The heart probably gets infected by a lot of other viruses, and they don't have a lethal effect," Conklin says. "What makes this one different?"
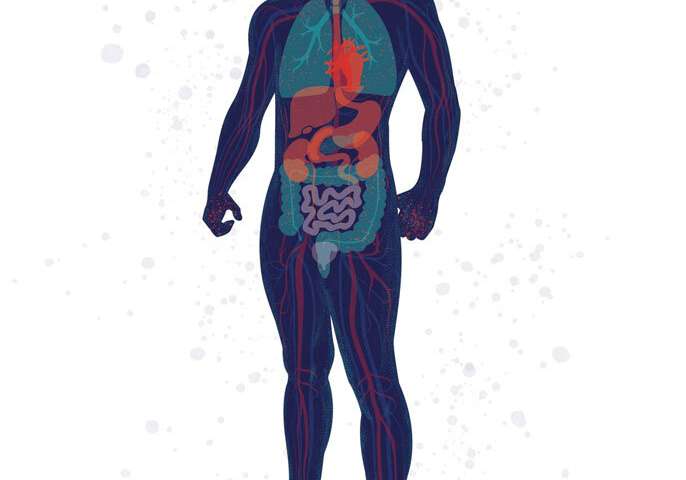
From Head to “COVID Toes”: People with COVID-19 exhibit from none to many of these symptoms. Some symptoms (such as fever, cough, and loss of smell) are common, while others (such as sore throat, pink eye, and stroke) are rare. Credit: Illustration: Stephanie Koch. Concept: Jennifer Babik, M.D., Ph.D.
Stranger things

Toward the end of March, as San Francisco began to warm up, Sonia got cold feet. She put on wool socks and turned up her heater. Still, her feet felt frozen. Three days later, her soles turned splotchy purple. Red dots appeared on her toes. At night, her cold feet itched and burned. Walking hurt. And she was exhausted, napping through afternoon Zoom meetings. "It was so bizarre," says Sonia, a San Francisco resident. A week later, her symptoms were gone.

"Yes, COVID," wrote Lindy Fox, M.D., a UCSF professor of dermatology, replying to an email describing Sonia's case. Sonia wasn't surprised. Anyone, like her, who's been following news of the pandemic has probably heard about "COVID toes," a painful or itchy skin rash that sometimes pops up in young adults with otherwise mild or asymptomatic cases of COVID-19. "It looks like what we call pernio, or chilblains," Fox says, "which is a pretty common phenomenon when somebody goes out in cold weather—they start to get purple or pink bumps on their fingers or toes."

Many people with rashes like Sonia's don't test positive for COVID-19, Fox says, which has made some clinicians skeptical of the connection; when patients have both, it's just a coincidence, they believe. But Fox doesn't think so. For one thing, "the time of year is wrong," she says. "Pernio usually shows up in the dead of winter." Even more compelling, dermatologists around the world are "getting crazy numbers of calls about it," Fox says. "In the last three weeks, I've had somewhere between 10 and 12 patients.

Normally, I have four a year."

And it's not just dermatologists who are adding their observations to COVID-19's ever-expanding symptom list. Gut specialists are finding that 20 percent to 40 percent of people with the disease experience diarrhea, nausea, or vomiting before other symptoms, says gastroenterologist Michael Kattah, M.D., Ph.D., a UCSF assistant professor. If you swallow virus particles, he says, there's a good chance they will infect cells lining your stomach, small intestine, or colon. As in the lungs and heart, these cells are studded with vulnerable ACE2 portals.

Especially disconcerting, Kattah says, is how long the virus seems to persist in the gut. About 50 percent of patients with COVID-19 have virus particles in their stools, often for weeks after their nose swabs test negative, he points out. Laboratory studies show that these particles are often still alive and can infect cells in a petri dish. Whether fecal transmission occurs between people, however, is an open question. If the answer is yes, people recovering from COVID-19 may need to stay quarantined even after they feel well, and the rest of us will need to be as meticulous about bathroom hygiene as we've become about handwashing and mask-wearing.

Other specialists are also raising flags. Neurologists worry about reports of COVID-19 patients with headaches, "brain fog," loss of the sense of smell, dizziness, delirium, and, in rare cases, stroke. Nephrologists worry about kidney stress and failure. Hepatologists worry about liver injuries. Ophthalmologists worry about pink eye. Pediatricians, meanwhile, worry about a peculiar COVID-related inflammatory syndrome that's showing up in kids and young adults.

Researchers are still sorting out the causes for this constellation of effects. If you come down with a particular symptom, is it because the virus is attacking your cells? Because your immune system is overreacting? Or just because you're very sick? In any severe illness, for example, the kidneys must work extra hard to filter waste and control nutrients and fluid; if overtaxed, they may begin to fail. Similarly, cognitive problems can result from increased blood toxins due to stressed kidneys or from low oxygen due to respiratory distress. "There's a lot of smoke," says Michael Wilson, M.D. '07, MAS '16, the Rachleff Distinguished Professor at UCSF's Weill Institute for Neurosciences. "We need to figure out where the fire is coming from."

Recently, there's been speculation that some of COVID-19's seemingly disparate symptoms may stem from trouble in the blood. Blood clots, for example, are showing up in cases of COVID-19 frequently enough for clinicians to take notice. "There's something unique about the coagulation system in these patients," says nephrologist Kathleen Liu, M.D. '99, Ph.D. '97, MAS '07, a UCSF professor of medicine. In caring for COVID-19 patients on dialysis machines, she's been surprised to see blood clots block dialysis tubes more than usual. Clotted tubes are common, she says, "but this is extreme."

That may be because, as growing evidence suggests, SARS-CoV-2 can infect cells in the walls of blood vessels that help regulate blood flow and coagulation, or clotting. If true, this behavior could explain some of the virus's weirder (and rarer) manifestations, such as heart attacks, strokes, and even "COVID toes."
Most symptomatic cases of COVID-19 are mild. Credit: UCSF
"Our vasculature is a contiguous system," says cardiologist Parikh. "Thus injury in one area, such as blood vessels in the lungs, can set off clotting cascades that affect multiple organs." Some of that trouble likely results from inflammation triggered by the immune system, she points out, although another culprit may be the body's RAAS, or renin-angiotensin-aldosterone system, a hormone system that controls blood pressure and fluid balance. Because RAAS involves ACE2 receptors, Parikh suspects it may become disrupted when the virus infects cells through these receptors, thus triggering coagulation and other downstream effects. Her lab is now studying this system in COVID-19 patients to better understand how SARS-CoV-2 infection affects it.

Inevitably, some ailments may turn out to be red herrings. During a pandemic, when people are flocking to hospitals with infections, clinicians will also see a rise in other health problems, simply by the rules of statistics, points out S. Andrew Josephson, M.D., the Francheschi-Mitchell Professor, chair of UCSF's neurology department, and a member of the Weill Institute for Neurosciences. "If the prevalence of infection is high, then almost any condition—a broken leg, if you will—you might conclude is associated with COVID-19."

"As clinicians, we want to get information to our medical community and to the public as quickly as possible," Josephson says, "but we have to be cautious about not making too big a deal of a little blip."

The long tail

As with any infection, how long a bout of COVID-19 lasts varies from person to person. If you're ill enough to need critical care, you can expect the disease to take at least a few weeks to run its course. In some cases, symptoms persist for months. For a typical milder case, though, you should feel better within a couple weeks.

At that point, the question foremost on your mind will be: Am I immune? There are now more than a dozen antibody tests on the market, but most are unreliable, according to UCSF research. And even the best tests can't tell you whether you have enough of the right kinds of antibodies to protect you against reinfection. "There is a lot of hope and belief that we'll have an antibody test that actually informs us of immunity, but we're not quite there yet," says Chaz Langelier, M.D., Ph.D., a UCSF assistant professor of medicine who is working to improve diagnostic tools for COVID-19.

What we have in the meantime are a lot of unknowns: If you do become immune to SARS-CoV-2, when and how does that occur? Will you gain immunity from a mild or asymptomatic case, as well as a severe one? How long will that immunity last?

"The answers will have huge implications for social distancing and masking and for getting the economy back up and running," says Michael Peluso, M.D., a clinical fellow who came to UCSF three years ago to help fight HIV. Now he's co-leading a new study called LIINC (Long-term Impact of Infection with Novel Coronavirus), which is enrolling people who have been infected with SARS-CoV-2 and will follow them for two years. Besides illuminating changes in immunity over time, LIINC is investigating chronic effects of infection on the immune system, lungs, heart, brain, blood, and other parts of the body.

"I hope people will recover and immunity will be protective and long-lasting, and that will be that," Peluso says.

It's what we all hope. We hope we will beat an infection swiftly—or, better yet, avoid the virus until there is a vaccine. We hope that if we do fall gravely ill, we will be cared for by the best providers and tended to by people we love. The reality, as we already know, is more complicated. And even if COVID-19 doesn't batter our bodies, the pandemic will surely leave scars—on our psyches, our livelihoods, our institutions, and our health—that we are only beginning to fathom. In truth, we don't know how our cards will fall, as individuals or as a people. Only time—and data—will tell.
Frontline healthcare workers more likely to test positive for SARS-CoV-2 despite PPEby King's College London

Credit: CC0 Public Domain
A new study published today in Lancet Public Health has found that front-line healthcare workers with adequate personal protective equipment (PPE) have a three-fold increased risk of a positive SARS-CoV-2 test, compared to the general population. Those with inadequate PPE had a further increase in risk. The study also found that healthcare workers from Black, Asian and minority ethnic (BAME) backgrounds were more likely to test positive.

Using the COVID Symptom Tracker App, researchers from King's College London and Harvard looked at data from 2,035,395 individuals and 99,795 front-line health-care workers in the UK and US. The prevalence of SARS-CoV-2 was 2747 cases per 100,000 front-line health-care workers compared with 242 cases per 100,000 people in the general community. A little over 20 percent of front-line health-care workers reported at least one symptom associated with SARS-CoV-2 infection compared with 14·4 percent of the general population; fatigue, loss of smell or taste, and hoarse voice were especially frequent.

BAME health-care workers were at an especially high risk of SARS-CoV-2 infection, with at least a fivefold increased risk of infection compared with the non-Hispanic white general community.

Professor Sebastien Ourselin, senior author from King's College London said: "The findings of our study have tremendous impact for healthcare workers and hospitals. The data is clear in revealing that there is still an elevated risk of SARS-CoV-2 infection despite availability of PPE.


"In particular we note that that the BAME community experience elevated risk of infection and in some cases lack access to adequate PPE, or frequently reuse equipment."
Researchers say their study not only shows the importance of adequate availability and use of PPE, but also the crucial need for additional strategies to protect healthcare workers, such as ensuring correct application and removal of PPE and avoiding reuse which was associated with increased risk. 
Differences were also noted in PPE adequacy according to race and ethnicity, with non- Hispanic white health-care workers more frequently reporting reuse of or inadequate access to PPE, even after adjusting for exposure to patients with COVID-19.
Joint first author Dr. Mark Graham from King's College London said: "The work is important in the context of the widely reported higher death rates amongst healthcare workers from BAME backgrounds. Hopefully a better understanding of the factors contributing to these disparities will inform efforts to better protect workers."

Dr. Claire Steves, lead clinical researcher from King's College London said: "I'm very pleased we have now introduced masks and social distancing where possible for all interactions in hospitals—to protect ourselves and the population we serve. We need to ensure this is reinforced and sustained throughout the health service—including in health care settings outside hospitals, for example in care homes.

"Additional protective strategies are equally as important, such as implementing social distancing among healthcare staff. Stricter protocols for socialising among healthcare staff also need to be considered."


Explore further COVID risk calculator aims to help keep BAME healthcare workers safer

Journal information: The Lancet Public Health

Provided by King's College London


High COVID-19 risk among health care workers, especially those from minority backgrounds
by Massachusetts General Hospital

Credit: CC0 Public Domain

New research indicates that at the peak of the COVID-19 pandemic in the U.S. and the U.K., frontline healthcare workers—particularly those from Black, Asian, and minority ethnic backgrounds—faced much higher risks of testing positive for COVID-19 than individuals in the general community. The study, which was conducted by a team led by researchers at Massachusetts General Hospital (MGH), is published in The Lancet Public Health.


Among 2,035,395 individuals in the community and 99,795 frontline healthcare workers who voluntarily used the COVID Symptom Study smartphone app developed by Zoe Global Ltd with scientific input from MGH and Kings College London, 5,545 new reports of a positive COVID-19 test were documented between March 24 and April 23, 2020.

Frontline healthcare workers had at least a threefold increased risk of COVID-19, after accounting for differences in testing frequency between frontline healthcare workers and the general community. Black, Asian, and minority ethnic healthcare workers appeared to be disproportionately affected, with a nearly twofold higher risk compared with white healthcare workers.

Also, frontline healthcare workers who reported inadequate availability of personal protective equipment (PPE) such as masks, gloves, and gowns, had an especially elevated risk; however, adequate availability of PPE did not seem to completely reduce risk among healthcare workers caring for patients with COVID-19.

"Although it is clear that healthcare workers on the front line of the fight against COVID-19 have an increased risk of infection, our country continues to face vexing shortages of PPE," said senior author Andrew T. Chan, MD, Ph.D., chief of the Clinical and Translational Epidemiology Unit at MGH and director of Cancer Epidemiology at the MGH Cancer Center. "Our results underscore the importance of providing adequate access to PPE and also suggest that systemic racism associated with inequalities to access to PPE likely contribute to the disproportionate risk of infection among minority frontline healthcare workers."

Dr. Chan hopes the study's findings bring greater awareness to the importance of ensuring an equitable supply chain of PPE and of developing additional strategies to protect all frontline healthcare workers. "This study demonstrates how the two major crises that the U.S. faces— the COVID-19 pandemic and systemic racism—are inextricably linked and need immediate attention," he added.


More information: Long H Nguyen et al, Risk of COVID-19 among front-line health-care workers and the general community: a prospective cohort study, The Lancet Public Health (2020). DOI: 10.1016/S2468-2667(20)30164-X

Journal information: The Lancet Public Health

Provided by Massachusetts General Hospital 

Google searches during pandemic hint at future increase in suicide


by Columbia University Irving Medical Center
Credit: CC0 Public Domain

U.S. Google searches for information about financial difficulties and disaster relief increased sharply in March and April compared to pre-pandemic times, while googling related to suicide decreased, researchers at Columbia University Irving Medical Center have found.

Because previous research has shown that financial distress is strongly linked to suicide mortality, the researchers fear that the increase may predict a future increase in deaths from suicide.
The findings were published online in PLOS One.

"The scale of the increase in Google searches related to financial distress and disaster relief during the early months of the pandemic was remarkable, so this finding is concerning," says Madelyn Gould, Ph.D., MPH, Irving Philips Professor of Epidemiology in Psychiatry at Columbia University Vagelos College of Physicians and Surgeons and senior author of the study.
Pandemics and suicide

Researchers in the United States and elsewhere have begun studying the effects of the COVID-19 pandemic on mental health, but the impact on suicidal behavior and deaths is difficult to assess due to lag time in the availability of mortality data.

Previous studies suggest that suicide rates often decrease in the immediate aftermath of national disasters, such as 9/11, but may increase several months later, as seen after the 1918 flu pandemic and the 2003 SARS outbreak in Hong Kong.

Studies in the U.S. and internationally have linked Google search behavior with suicidal behavior, so in the current study, the researchers evaluated online searches about suicide and suicide risk factors during the early part of the pandemic and potential long-term impact on suicide.

The researchers used an algorithm to analyze Google trends data from March 3, 2019, to April 18, 2020, and identify proportional changes over time in searches for 18 terms related to suicide and known suicide risk factors.

"We didn't have a clear hypothesis about whether there would be an increase in suicide-related queries during this period of time, but we anticipated a national sense of community during the pandemic that might mitigate suicidal behavior in the short term," says Emily Halford, MPH, data analyst and the study's first author.

Unemployment, panic attacks, and loneliness may predict future suicide

The researchers found dramatic relative increases (in the thousands of percentages, in some cases) in Googling search terms related to financial distress—e.g., "I lost my job," "unemployment," and "furlough"—and for the national Disaster Distress Helpline.

The proportion of queries related to depression was slightly higher than the pre-pandemic period, and moderately higher for panic attack.

"It seems as though individuals are grappling with the immediate stresses of job loss and isolation and are reaching out to crisis services for help, but the impact on suicidal behavior hasn't yet manifested," says Gould. "Generally, depression can take longer to develop, whereas panic attacks may be a more immediate reaction to job loss and having to deal with emotionally charged events amidst the social isolation of the pandemic."

Searches for terms related to loneliness were also meaningfully higher during the early pandemic period versus the prior year.

Gould adds that social distancing is one of the primary measures implemented to slow the spread of the coronavirus, "but this approach may have detrimental secondary effects, such as loneliness and exacerbation of preexisting mental illnesses, which are known suicide risk factors."

Meeting the anticipated need for crisis services

The researchers say that in light of an anticipated increase in suicidal crises, it will be important to ensure continued availability and accessibility of crisis services and other mental health services during the later stages of the pandemic.

"The current findings give us insight into how people have been dealing with the immediate emotional and financial effects of the pandemic," says Gould. "Encouragingly, individuals who Google terms related to suicide are directed to the National Suicide Prevention Lifeline. We are hoping that accessing this crisis service may ameliorate suicide risk among the individuals who have Googled suicide-related terms."

More Information

If you or someone you know is thinking about suicide, contact the National Suicide Prevention Lifeline 24/7 for free, confidential support by calling 1-800-273-8255 (1-800-273-TALK) and through online chats.

The paper is titled, "Google searches for suicide and suicide risk factors in the early stages of the COVID-19 pandemic," and was published online in PLOS One on July 24, 2020.


Explore further COVID-19 impact on suicide

More information: Emily A. Halford et al, Google searches for suicide and suicide risk factors in the early stages of the COVID-19 pandemic, 

Journal information: PLoS ONE


Provided by Columbia University Irving Medical Center
New printing process advances 3-D capabilities
by University of Massachusetts Lowell
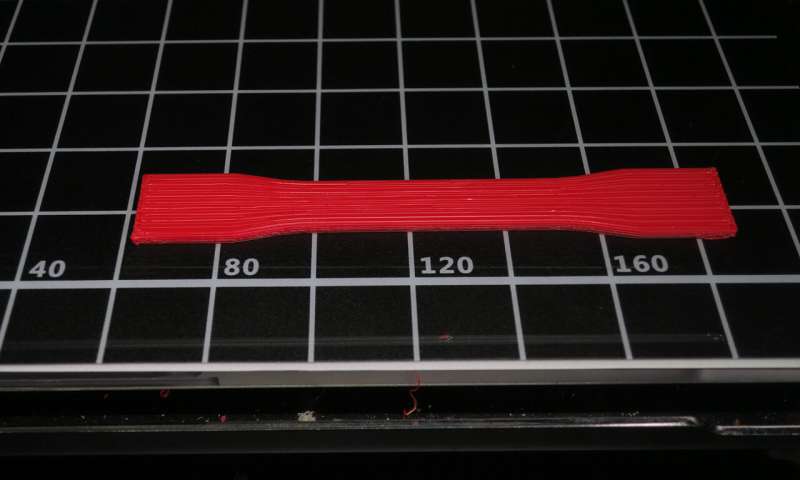
This tensile object was created using 3D injection printing, a new technology invented by UMass Lowell Plastics Engineering Prof. David Kazmer. Credit: David Kazmer

More durable prosthetics and medical devices for patients and stronger parts for airplanes and automobiles are just some of the products that could be created through a new 3-D printing technology invented by a UMass Lowell researcher.


Substances such as plastics, metals and wax are used in 3-D printers to make products and parts for larger items, as the practice has disrupted the prototyping and manufacturing fields. Products created through the 3-D printing of plastics include everything from toys to drones. While the global market for 3-D plastics printers is estimated at $4 billion and growing, challenges remain in ensuring the printers create objects that are produced quickly, retain their strength and accurately reflect the shape desired, according to UMass Lowell's David Kazmer, a plastics engineering professor who led the research project.

Called injection printing, the technology Kazmer pioneered is featured in the academic journal Additive Manufacturing posted online last week.

The invention combines elements of 3-D printing and injection molding, a technique through which objects are created by filling mold cavities with molten materials. The marriage of the two processes increases the production rate of 3-D printing, while enhancing the strength and properties of the resulting products. The innovation typically produces objects about three times faster than conventional 3-D printing, which means jobs that once took about nine hours now only take three, according to Kazmer, who lives in Georgetown.

"The invention greatly improves the quality of the parts produced, making them fully dense with few cracks or voids, so they are much stronger. For technical applications, this is game-changing. The new process is also cost-effective because it can be used in existing 3-D printers, with only new software to program the machine needed," Kazmer said.
The process took about 18 months to develop. Austin Colon of Plymouth, a UMass Lowell Ph.D. candidate in plastics engineering, helped validate the technology alongside Kazmer, who teaches courses in product design, prototyping and process control, among other topics. He has filed for a patent on the new technology.


Explore furtherResearchers invent technology to remedy 3-D printing's 'weak spot'

More information: David O. Kazmer et al, Injection printing: additive molding via shell material extrusion and filling, Additive Manufacturing (2020). DOI: 10.1016/j.addma.2020.101469


Satellite survey shows California's sinking coastal hotspots
by Arizona State University  JULY 31, 2020
Coastal elevation in California. Coastal zones, which are defined to be those with elevations less than 10 m, are shown in red. Segments of the coast with elevations higher than 10 m are colored by a yellow gradient. Credit: USGS NED.

A majority of the world population lives on low lying lands near the sea, some of which are predicted to submerge by the end of the 21st century due to rising sea levels.


The most relevant quantity for assessing the impacts of sea-level change on these communities is the relative sea-level rise—the elevation change between the Earth's surface height and sea surface height. For an observer standing on the coastland, relative sea-level rise is the net change in the sea level, which also includes the rise and fall of the land beneath observer's feet.

Now, using precise measurements from state-of-the-art satellite-based interferometric synthetic aperture radar (InSAR) that can detect the land surface rise and fall with millimeter accuracy, an Arizona State University research team has, for the first time, tracked the entire California coast's vertical land motion.

They've identified local hotspots of the sinking coast, in the cities of San Diego, Los Angeles, Santa Cruz and San Francisco, with a combined population of 4 to 8 million people exposed to rapid land subsidence, who will be at a higher flooding risk during the decades ahead of projected sea-level rise.

"We have ushered in a new era of coastal mapping at greater than 1,000 fold higher detail and resolution than ever before," said Manoochehr Shirzaei, who is the principal investigator of the NASA-funded project. "The unprecedented detail and submillimeter accuracy resolved in our vertical land motion dataset can transform the understanding of natural and anthropogenic changes in relative sea-level and associated hazards."

The results were published in this week's issue of Science Advances.

The research team included graduate student and lead author Em Blackwell, and faculty Manoochehr Shirzaei, Chandrakanta Ojha and Susanna Werth, all from the ASU School of Earth and Space Exploration (Werth has a dual appointment in the School of Geography and Urban Planning).

Em Blackwell had a keen interest in geology, and as Blackwell began graduate school, the applications of InSAR drew them to pursue this project. InSAR uses radar to measure the change in distance between the satellite and ground surface, producing highly accurate deformation maps of the Earth's surface at 10s m resolution over 100s km spatial extent.

Land subsidence can occur due to natural and anthropogenic processes or a combination of them. The natural processes comprise tectonics, glacial isostatic adjustment, sediment loading, and soil compaction. The anthropogenic causes include groundwater extraction and oil and gas production.


As of 2005, approximately 40 million people were exposed to a 1 in 100-year coastal flooding hazard, and by 2070 this number will grow more than threefold. The value of property exposed to flooding will increase to about 9% of the projected global Gross Domestic Product, with the U.S., Japan, and the Netherlands being the countries with the most exposure. These exposure estimates often rely only on projections of global average sea level rise and do not account for vertical land motion.

The study measured the entire 1350-kilometer long coast of California from 2007-2018, compiling 1000s of satellite images over time, used for making a vertical land motion map with 35-million-pixel at ~80 m resolution, comprising a wide range of coastal uplift and subsidence rates. Coastal communities' policymakers and the general public can freely download the data (link in supplemental data).

The four metropolitan areas majorly affected in these areas included San Francisco, Monterey Bay, Los Angeles, and San Diego.

"The vast majority of the San Francisco Bay perimeter is undergoing subsidence with rates reaching 5.9 mm/year," said Blackwell. "Notably, the San Francisco International Airport is subsiding with rates faster than 2.0 mm/year. The Monterey Bay Area, including the city of Santa Cruz, is rapidly sinking without any zones of uplift. Rates of subsidence for this area reach 8.7 mm/year. The Los Angeles area shows subsidence along small coastal zones, but most of the subsidence is occurring inland."

Areas of land uplift included north of the San Francisco Bay Area (3 to 5 mm/year) and Central California (same rate).

Going forward in the decades ahead, the coastal population is expected to grow to over 1 billion people by 2050, due to coastward migration. The future flood risk that these communities will face is mainly controlled by the rate of relative sea-level rise, namely, the combination of sea-level rise and vertical land motion. It is vital to include land subsidence into regional projections that are used to identify areas of potential flooding for the urbanized coast.

Beyond the study, the ASU research team is hopeful that others in the scientific community can build on their results to measure and identify coastal hazards more broadly in the U.S. and around the world.


Explore further Study says seas may be rising faster than thought

More information: "Tracking California's sinking coast from space: Implications for relative sea-level rise" Science Advances (2020). DOI: 10.1126/sciadv.aba4551
Journal information: Science Advances

Provided by Arizona State University
Texas cave sediment upends meteorite explanation for global cooling

by Baylor University JULY 31,2020
Archaeologic excavations at Hall's Cave exposed sediments for geochemical analysis that span from circa 20,000 to 6,000 years. Credit: Michael Waters, Texas A&M University

Texas researchers from the University of Houston, Baylor University and Texas A&M University have discovered evidence for why the earth cooled dramatically 13,000 years ago, dropping temperatures by about 3 degrees Centigrade.

The evidence is buried in a Central Texas cave, where horizons of sediment have preserved unique geochemical signatures from ancient volcanic eruptions—signatures previously mistaken for extraterrestrial impacts, researchers say.

The resolution to this case of mistaken identity recently was reported in the journal Science Advances.

"This work shows that the geochemical signature associated with the cooling event is not unique but occurred four times between 9,000 and 15,000 years ago," said Alan Brandon, Ph.D., professor of geosciences at University of Houston. "Thus, the trigger for this cooling event didn't come from space. Prior geochemical evidence for a large meteor exploding in the atmosphere instead reflects a period of major volcanic eruptions."

After a volcano erupts, the global spread of aerosols reflects incoming solar radiation away from Earth and may lead to global cooling post eruption for one to five years, depending on the size and timescales of the eruptio
n.

The study indicates that the episode of cooling, scientifically known as the Younger Dryas, was caused by numerous coincident Earth-based processes, not an extraterrestrial impact.

"The Younger Dryas, which occurred about 13,000 years ago, disrupted distinct warming at the end of the last ice age," said co-author Steven Forman, Ph.D., professor of geosciences at Baylor University.

The Earth's climate may have been at a tipping point at the Younger Dryas, possibly from the ice sheet discharge into the North Atlantic Ocean, enhanced snow cover and powerful volcanic eruptions that may have in combination led to intense Northern Hemisphere cooling, Forman said.
"This period of rapid cooling is associated with the extinction of a number of species, including mammoths and mastodons, and coincides with the appearance of early human occupants of the Clovis tradition," said co-author Michael Waters, Ph.D., director of the Center for the First Americans at Texas A&M University.

University of Houston scientists Brandon and doctoral candidate Nan Sun, lead author, accomplished the isotopic analysis of sediments collected from Hall's Cave in the Texas Hill Country. The analysis focused on difficult measurements at the parts per trillion on osmium and levels of highly siderophile elements, which include rare elements like iridium, ruthenium, platinum, palladium and rhenium. The researchers determined the elements in the Texas sediments were not present in the correct relative proportions to have been added by a meteor or asteroid that impacted Earth.

That meant the cooling could not have been caused by an extraterrestrial impact. It had to have been something happening on Earth. But what?

"The signature from the osmium isotope analysis and the relative proportion of the elements matched that previously reported in volcanic gases," Sun said.

Kenneth Befus, Ph.D., volcanologist at Baylor University, added that "these signatures were likely the result of major eruptions across the Northern Hemisphere, including volcanoes in the Aleutians, Cascades and even Europe."

"I was skeptical. We took every avenue we could to come up with an alternative explanation or even avoid this conclusion," Brandon said. "A volcanic eruption had been considered one possible explanation but was generally dismissed because there was no associated geochemical fingerprint."

A volcanic cause for the Younger Dryas is a new, exciting idea, he said. Whether a single major eruption of a volcano could drive the cooling observed, however, is still an open question, the researchers said.

Volcanic eruptions cause their most severe cooling near the source, usually in the year of the eruption, with substantially less cooling in the years after the eruption. The Younger Dryas cooling lasted about 1,200 years, so a sole volcanic eruptive cause is an important initiating factor, but other Earth system changes, such as cooling of the oceans and more snow cover were needed to sustain this colder period, Forman said.

This research underscores that extreme climate variability since the last ice age is attributed to unique Earth-bound drivers rather than extraterrestrial mechanisms. Such insights are important guidance for building better models of past and future climate change.


Explore further Research reveals how volcanic eruptions affect El Niño

More information: "Volcanic origin for Younger Dryas geochemical anomalies ca. 12,900 cal B.P." Science Advances (2020). advances.sciencemag.org/lookup … .1126/sciadv.aax8587
Journal information: Science Advances

Provided by Baylor University
How human sperm really swim: New research challenges centuries-old assumption

by University of Bristol    
JULY 31, 2020

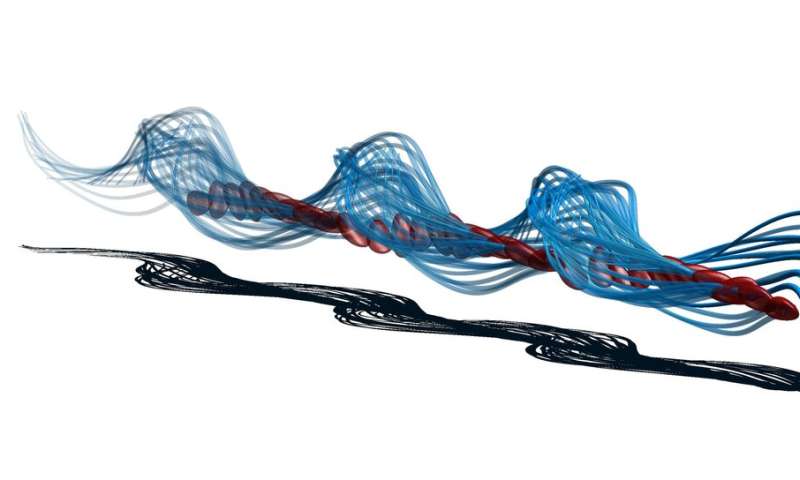
The sperm tail moves very rapidly in 3D, not from side-to-side in 2D as it was believed. Credit: polymaths-lab.com  VIDEO AT THE END 

A breakthrough in fertility science by researchers from Bristol and Mexico has shattered the universally accepted view of how sperm 'swim'.

More than three hundred years after Antonie van Leeuwenhoek used one of the earliest microscopes to describe human sperm as having a "tail, which, when swimming, lashes with a snakelike movement, like eels in water", scientists have revealed this is an optical illusion.
Using state-of-the-art 3-D microscopy and mathematics, Dr. Hermes Gadelha from the University of Bristol, Dr. Gabriel Corkidi and Dr. Alberto Darszon from the Universidad Nacional Autonoma de Mexico, have pioneered the reconstruction of the true movement of the sperm tail in 3-D.

Using a high-speed camera capable of recording over 55,000 frames in one second, and a microscope stage with a piezoelectric device to move the sample up and down at an incredibly high rate, they were able to scan the sperm swimming freely in 3-D.
The ground-breaking study, published in the journal Science Advances, reveals the sperm tail is in fact wonky and only wiggles on one side. While this should mean the sperm's one-sided stroke would have it swimming in circles, sperm have found a clever way to adapt and swim forwards.

"Human sperm figured out if they roll as they swim, much like playful otters corkscrewing through water, their one-sided stoke would average itself out, and they would swim forwards," said Dr. Gadelha, head of the Polymaths Laboratory at Bristol's Department of Engineering Mathematics and an expert in the mathematics of fertility.

"The sperms' rapid and highly synchronized spinning causes an illusion when seen from above with 2-D microscopes—the tail appears to have a side-to-side symmetric movement, "like eels in water", as described by Leeuwenhoek in the 17th century.

"However, our discovery shows sperm have developed a swimming technique to compensate for their lop-sidedness and in doing so have ingeniously solved a mathematical puzzle at a microscopic scale: by creating symmetry out of asymmetry," said Dr. Gadelha.

"The otter-like spinning of human sperm is however complex: the sperm head spins at the same time that the sperm tail rotates around the swimming direction. This is known in physics as precession, much like when the orbits of Earth and Mars precess around the sun."

Computer-assisted semen analysis systems in use today, both in clinics and for research, still use 2-D views to look at sperm movement. Therefore, like Leeuwenhoek's first microscope, they are still prone to this illusion of symmetry while assessing semen quality. This discovery, with its novel use of 3-D microscope technology combined with mathematics, may provide fresh hope for unlocking the secrets of human reproduction.


Sperm tail moves like a precessing spinning top that cancels out the one-sided swimming stroke in an ingenious corkscrew motion: Symmetry is achieved through asymmetry, enabling human sperm to swim forwards. Credit: polymaths-lab.com

"With over half of infertility caused by male factors, understanding the human sperm tail is fundamental to developing future diagnostic tools to identify unhealthy sperm," adds Dr. Gadelha, whose work has previously revealed the biomechanics of sperm bendiness and the precise rhythmic tendencies that characterize how a sperm moves forward.

Dr. Corkidi and Dr. Darszon pioneered the 3-D microscopy for sperm swimming.
"This was an incredible surprise, and we believe our state-of the-art 3-D microscope will unveil many more hidden secrets in nature. One day this technology will become available to clinical centers," said Dr. Corkidi.

"This discovery will revolutionize our understanding of sperm motility and its impact on natural fertilization. So little is known about the intricate environment inside the female reproductive tract and how sperm swimming impinge on fertilization. These new tools open our eyes to the amazing capabilities sperm have," said Dr. Darszon.


Doing more with less: Sperm without a fully active tail move faster and more efficiently, new study finds
https://phys.org/news/2020-07-sperm-fully-tail-faster-efficiently.html

More information: "Human sperm uses asymmetric and anisotropic flagellar controls to regulate swimming symmetry and cell steering" Science Advances (2020). DOI: 10.1126/sciadv.aba5168

Journal information: Science Advances 

Provided by University of Bristol


700-km Brazil 'megaflash' sets lightning record: UN

The UN weather agency measures lightning using satellite imagery technology

The UN's weather agency announced Thursday the longest lightning bolt on record—a single flash in Brazil on October 31, 2018 that cut the sky across more than 700 kilometers.

That is equivalent to the distance between Boston and Washington DC in the United States, or between London and Basel, Switzerland, the World Meteorological Organization said in a statement.


WMO's committee of experts on weather and climate extremes also reported a new world record for the duration of a lightning flash, with a single flash that developed continuously over northern Argentina on March 4, 2019 lasting for a full 16.73 seconds.The new "megaflash" records, which were verified with new satellite lightning imagery technology, were more than double the previous known record-holders, WMO said.

The previous record for the longest detected distance for a single lightning flash was 321 kilometers (199 miles), measured on June 20, 2007 in the US state of Oklahoma, WMO said.

The previous duration record was 7.74 seconds, measured on August 30, 2012 in southern France, it said.

'Extraordinary records'

The new measurements reveal "extraordinary records from single lightning flash events," Randall Cerveny, the chief rapporteur in the WMO expert committee, said in the statement.

"It is likely that even greater extremes still exist, and that we will be able to observe them as lightning detection technology improves," he said.

The previous records were assessed using data collected by ground-based so-called lightning mapping array networks, which many lightning scientists acknowledge face upper limits in the scale of lightning that can be observed, WMO said.

It hailed recent advances in space-based lightning mapping that allow for measuring "flash extent and duration continuously over broad geo-spatial domains."

This has allowed for the detection of "previously unobserved extremes in lightning occurrence, known as 'megaflashes'," Michael J. Peterson, of the Space and Remote Sensing Group of Los Alamos National Laboratory in the US, said in the statement.

Megaflashes, he said, "are defined as horizontal mesoscale lightning discharges that reach hundreds of kilometers in length."

The UN agency occasionally reveals quirky weather-related milestones, like in 2016 revealing a record wave measurement of a behemoth that towered 19 metres (62.3 feet)—taller than a six-storey building—above the North Atlantic.

All such records are stored in the WMO Archive of Weather and Climate Extremes.

The archive currently includes two other lightning-related extremes.

One is for the most people killed by a single direct strike of lightning, when 21 people died in Zimbabwe in 1975 as they huddled for safety in a hut that was hit.

The other is for an indirect strike, when 469 people died in Dronka, Egypt when lightning struck a set of oil tanks in 1994, causing burning oil to flood the town.


Explore further France strikes with longest-lasting lightning bolt