SPACE/COSMOS
Raging winds on Mars
University of Bern
image:
Image of a dust devil, whirlwind of dust that is blown across Mars’ surface.
view moreCredit: CC BY SA 3.0 IGO ESA/TGO/CaSSIS for CaSSIS
Despite the very thin Martian atmosphere, there are also winds on Mars that are central to the climate and the distribution of dust. The wind movements and the whirling up of dust also create so-called dust devils, rotating columns of dust and air that move across the surface. In images of Mars, the wind itself is invisible, but dust devils are clearly visible. Due to their movement, they are valuable indicators for researchers to determine the otherwise invisible winds.
A new study led by Dr. Valentin Bickel from the Center for Space and Habitability at the University of Bern shows that the dust devils and the winds that surround them reach significantly higher speeds than previously assumed. The stronger winds could be responsible for a large part of the dust uplift on Mars, which in turn has a major influence on the weather and climate of Mars. The study, in which researchers from the Department of Space Research and Planetology at the Physics Institute at the University of Bern, the Open University in the UK and the German Aerospace Center (DLR) are also involved, has just been published in the journal Science Advances.
Movement of dust devils studied with the help of deep learning
"Using a state-of-the-art deep learning approach, we were able to identify dust devils in over 50,000 satellite images," explains first author Valentin Bickel. The team used images from the Bern-based Mars camera CaSSIS (Color and Stereo Surface Imaging System) and the stereo camera HRSC (High Resolution Stereo Camera). CaSSIS is on board the European Space Agency’s (ESA) ExoMars Trace Gas Orbiter, while the HRSC camera is on board the ESA orbiter Mars Express. "Our study is therefore based exclusively on data from European Mars exploration," Bickel continues.
In a next step, the research team examined stereo images for around 300 of the identified dust devils in order to measure their directions of movement and velocities. Co-author Nicolas Thomas, under whose leadership the CaSSIS camera system was developed and built at the University of Bern and
which is funded by SERI's Swiss Space Office through ESA's PRODEX program (see info box), explains: "Stereo images are images of the same spot on the surface of Mars, but taken a few seconds apart. These images can therefore be used to measure the movement of dust devils."
Bickel emphasizes: "If you put the stereo images together in a sequence, you can observe how dynamically the dust devils move across the surface." (see the images on the website of the University of Bern)
Winds on Mars stronger than previously assumed
The results show that the dust devils and the winds surrounding them on Mars can reach speeds of up to 44 m/s, i.e. around 160 km/h, across the entire planet, which is much faster than previously assumed (previous measurements on the surface had shown that winds mostly remain below 50 km/h and – in rare cases – can reach a maximum of 100 km/h).
The high wind speed in turn influences the dust cycle on the Red Planet: "These strong, straight-line winds are very likely to bring a considerable amount of dust into the Martian atmosphere – much more than previously assumed," says Bickel. He continues: "Our data show where and when the winds on Mars seem to be strong enough to lift dust from the surface. This is the first time that such findings are available on a global scale for a period of around two decades."
Future Mars missions can benefit from the research results
The results obtained are also particularly important for future Mars missions. "A better understanding of the wind conditions on Mars is crucial for the planning and execution of future landed missions," explains Daniela Tirsch from the Institute of Space Research at the German Aerospace Center (DLR) and co-author of the study. "With the help of the new findings on wind dynamics, we can model the Martian atmosphere and the associated surface processes more precisely," Tirsch continues. These models are essential to better assess risks for future missions and adapt technical systems accordingly. The new study thus provides important findings for a number of research areas on Mars, such as research into the formation of dunes and slope streaks, as well as the creation of weather and climate models of Mars.
The researchers plan to further intensify the observations of dust devils and supplement the data obtained with targeted and coordinated observations of dust devils using CaSSIS and HRSC. "In the long term, our research should help to make the planning of Mars missions more efficient," concludes Bickel.
Journal
Science Advances
Method of Research
Imaging analysis
Subject of Research
Not applicable
Article Title
Dust Devil Migration Patterns Reveal Strong Near-surface Winds across Mars
Article Publication Date
8-Oct-2025
Dancing dust devils trace raging winds on Mars
image:
Map showing active dust devils during local spring and summer in Mars’s northern and southern hemispheres.
The coloured dots indicate 1039 dust devils for which we have only location information, and the arrows indicate 373 dust devils for which we also have speed and direction of motion information. The white squares show the locations of Mars rovers and landers.
view moreCredit: ExoMars TGO data: ESA/TGO/CaSSIS; Mars Express data: ESA/DLR/FU Berlin; Background: NASA Viking colour mosaic
Combing through 20 years of images from the European Space Agency’s Mars Express and ExoMars Trace Gas Orbiter spacecraft, scientists have tracked 1039 tornado-like whirlwinds to reveal how dust is lifted into the air and swept around Mars’s surface.
Published on Wednesday 8 October in Science Advances, their findings – including that the strongest winds on Mars blow much faster than we thought – give us a much clearer picture of the Red Planet’s weather and climate.
And with these ‘dust devils’ collected into a single public catalogue, this research is just the beginning. Besides pure science, it will be useful for planning future missions, for example incorporating provisions for the irksome dust that settles on the solar panels of our robotic rovers.
We’ve been seeing dust devils for decades with Mars rovers and orbiters. This research takes a big step further, being the first to track the motion of so many of these twisters to find out how exactly they travel across Mars’s surface.
The study was led by Valentin Bickel from the University of Bern in Switzerland. Their catalogue is the first ever to include the speeds and directions of motions for dust devils all over Mars.
“Dust devils make the normally invisible wind visible,” explains Valentin. “By measuring their speed and direction of travel we have started mapping the wind all over Mars’s surface. This was impossible before because we didn’t have enough data to make this kind of measurement on a global scale.”
Mars is a dramatic planet, with vast volcanoes and cavernous craters. Why should we focus on something as seemingly dull as dust?
Dust can shield the Sun to keep daytime temperatures cooler, and act like a blanket to keep nighttime temperatures warmer. And particles of dust can act as the starting point for clouds to form, whilst dust storms can even force water vapour to escape into space.
Unlike on Earth, where it is washed out of the air by rain, dust can stay in Mars’s atmosphere for a long time, being blown all around the planet. So, for a better understanding of Mars’s climate, scientists are keen to understand when, where and how dust is lifted off the surface into the atmosphere.
More data, better picture
For this new study, researchers trained a neural network to recognise dust devils and then comb through images taken by Mars Express since 2004 and ExoMars TGO since 2016 to build up a catalogue of 1039 of them.
The map included with this release shows the locations of all 1039 dust devils, and the direction of motion for 373. It confirms that although dust devils are found all over Mars, even on its towering volcanoes, lots are swept up from certain ‘source regions’. For example, many were clustered in Amazonis Planitia (upper left of the map), a huge patch of Mars covered in a fine layer of dust and sand.
By tracking how fast the dust devils moved, the researchers found wind speeds of up to 44 m/s, or 158 km/h. This is faster than we’ve ever measured with rovers on the ground – though it’s worth noting that the martian air is so thin that a human would barely even notice a wind of 100 km/h on Mars.
The researchers found that, in most cases, the dust devils were being blown across the landscape faster than our current Mars weather models predicted. In places where wind speeds are higher than expected, there may be more dust being lifted from the ground than we realised.
Like Earth, Mars has seasons. The catalogue also highlights that dust devils are most common in the spring and summer of each hemisphere. They last a few minutes and typically happen during the daytime, peaking between about 11:00 and 14:00 local solar time.
This is very similar to what we see on Earth, where dust devils are most common in dry and dusty places in the late morning to early afternoon during the summer months.
Better picture, safer exploration
This kind of big-picture view requires a lot of data, which can’t be captured by rovers and landers alone. Until now, our models of Mars’s climate have been based on the limited data we have from missions that don’t really cover much of the planet’s surface.
Thanks to this study, we now have lots of new measurements from all over Mars, helping to inform and refine the models. This improves our understanding and predictions of wind patterns around the Red Planet.
“Information on wind speeds and directions is also really important when planning the arrival of future landers and rovers at Mars,” mentions Valentin. “Our measurements could help scientists build up an understanding of wind conditions at a landing site before touchdown, which could help them estimate how much dust might settle on a rover’s solar panels – and therefore how often they should self-clean.”
We’re already using dust information to plan our future missions. Our ExoMars Rosalind Franklin rover is planned to touchdown on Mars in 2030 to avoid landing during the planet’s global dust storm season.
Valentin emphasises that “this catalogue of dust devil tracks is already public and anybody can use it for their own research. More entries are being added over time – Mars Express and ExoMars TGO are collecting new images every day.”
“Now that we know where dust devils usually happen, we can direct more images to those exact places and times. We are also coordinating the missions to image the same dust devils at the same time, to be able to compare the movement measurements and validate the data.”
From noise to gold
Mars Express and ExoMars TGO were never actually designed to measure wind speeds on Mars. Valentin’s team made use of a normally unwanted feature of the data to track the dust devils.
For both spacecraft, a single image is created by combining views from separate channels (each channel looks at Mars either in a specific colour or from a specific direction – or both). By design, there is a small delay between the views. This delay causes no problems as long as the surface is static, however it can cause slight ‘colour offsets’ in the final image whenever something is moving, such as clouds and dust devils. These offsets were exactly what the researchers were looking for – in Valentin’s words “we turned image noise into valuable scientific measurements”.
An imaging sequence from Mars Express combines up to nine image channels taken with a delay of about 7 to 19 seconds between each one. During these delays, any dust devil passing below moves a short distance, allowing the researchers to measure its speed. Because five separate image channels were used in this study, the team could even see how much the dust devil wobbled from left to right, as well as how its speed changed over time.
Images taken with ExoMars TGO’s Colour and Surface Stereo Imaging System (CaSSIS) combine two views taken either a second (for colour images) or 46 seconds (for stereo images) apart. Though we can’t see any wobble or acceleration, the extra delay lets us see dust devils moving much further between each image.
“It’s great to see researchers using Mars Express and ExoMars TGO for totally unexpected research,” says Colin Wilson, ESA project scientist for both missions. “Dust affects everything on Mars – from local weather conditions to how well we can take images from orbit. It’s difficult to understate the importance of the dust cycle.”
Notes for editors
‘Dust Devil Migration Patterns Reveal Strong Near-surface Winds across Mars’ by Bickel et al. is published on Wednesday 8 October in Science Advances. DOI: 10.1126/sciadv.adw5170
For GIFs showing the dust devils dancing across Mars in Mars Express and ExoMars TGO, please see the news story on esa.int on 8 October, or reach out to media@esa.int.
The Colour and Stereo Surface Imaging System (CaSSIS) on board ESA’s ExoMars Trace Gas Orbiter (TGO) captured this dust devil tracking across the martian surface on 3 December 2021.
Credit
ESA/TGO/CaSSIS
The Colour and Stereo Surface Imaging System (CaSSIS) on board ESA’s ExoMars Trace Gas Orbiter (TGO) captured these three dust devils tracking across the martian surface on 8 November 2021.
Credit
ESA/TGO/CaSSIS
Journal
Science Advances
Method of Research
Imaging analysis
Subject of Research
Not applicable
Article Title
Dust Devil Migration Patterns Reveal Strong Near-surface Winds across Mars
Article Publication Date
8-Oct-2025
Composing crews for Mars missions
Team diversity may foster resilience during extended space missions
PLOS
image:
Astronaut team aboard the space station.
view moreCredit: NASA, CC-BY 4.0 (https://creativecommons.org/licenses/by/4.0/)
Simulation results highlight how team composition shapes stress, health, performance, and cohesion in long-duration space missions, according to a study published October 8, 2025, in the open-access journal PLOS One by Iser Pena and Hao Chen of the Stevens Institute of Technology, U.S. In particular, team diversity in personality traits may contribute to greater resilience under extended isolation and operational load.
Missions to Mars are expected to last up to three years, putting astronauts at risk of cumulative stress resulting from prolonged confinement in limited living spaces and heightened responsibility. The absence of personal space and privacy exacerbates stress levels, potentially affecting team cohesion and performance. Understanding and optimizing team dynamics under these extreme conditions is crucial, as effective collaboration, stress management, and psychological support systems are essential for the success of long-duration space missions. With NASA’s Artemis missions now underway and crewed Mars missions becoming increasingly concrete, there is a timely and critical need to develop predictive tools capable of assessing and optimizing team composition, psychological resilience, and operational effectiveness under realistic, Mars-like conditions.
To address this need, Pena and Chen modeled how personality traits influence stress responses and resilience across long-duration missions. The researchers integrated psychological theories with agent-based modeling (ABM) to simulate the impact of team composition over a 500-day Mars mission. ABM is a computational methodology that simulates the actions, interactions, and decision-making processes of autonomous agents within a defined environment. It offers a framework for linking micro-level variation among individuals to emergent team-level outcomes across time. Using ABM, the researchers examined how five personality traits – openness, conscientiousness, neuroticism, extraversion, and agreeableness – interact with various roles (e.g., engineer, medic, pilot) and skills to impact the stress, health, performance, and cohesion of teams.
In the scenarios examined, heterogeneous teams generally demonstrated better outcomes than homogeneous teams, indicating that personality and skill diversity may support team resilience under sustained operational demands. Teams with variation in personality traits—particularly those combining high conscientiousness with low neuroticism, or high extraversion with high agreeableness—showed lower stress levels and improved performance, cohesion, and health outcomes. These patterns suggest that a broader mix of coping styles and interpersonal dynamics might help teams maintain stability over time.
As noted by the authors, this study has several modeling limitations that should inform future extensions. For example, personality traits were assumed to remain fixed, omitting possible adaptation over time. Despite these limitations, the results may inform future crew design strategies for long-duration space missions. Incorporating personality assessments into selection processes, and deliberately composing teams with complementary psychological and functional profiles, could improve cohesion, stress regulation, and operational stability in isolated, high-demand environments.
The authors add: “For the first time, we’ve combined psychological insights with a computer simulation to model a 500-day mission to Mars.”
“This new approach lets us explore how different astronaut personalities and team roles might affect a crew’s stress and performance, and it gives us a glimpse of the human challenges astronauts could face on these long journeys into deep space.”
In your coverage, please use this URL to provide access to the freely available article in PLOS One: http://plos.io/4gAiV06
Citation: Pena I, Chen H (2025) Exploring team dynamics and performance in extended space missions using agent-based modeling. PLoS One 20(10): e0332496. https://doi.org/10.1371/journal.pone.0332496
Author countries: U.S.
Funding: The author(s) received no specific funding for this work.
Journal
PLOS One
Method of Research
Computational simulation/modeling
Subject of Research
Not applicable
Article Title
Exploring team dynamics and performance in extended space missions using agent-based modeling
Article Publication Date
8-Oct-2025
AI breakthrough helps astronomers spot cosmic events with just a handful of examples
image:
Gemini uses three images per candidate—New (the latest science frame showing the putative transient), Reference (an earlier or stacked template of the same part of the sky), and Difference (New minus Reference, isolating any transient signal). From each triplet, Gemini returns three outputs: (1) a real/bogus classification (astrophysical source vs artefact), (2) a concise text explanation describing salient image features and the reasoning behind the decision, and (3) an interest score indicating follow-up prioritisation for rapid flagging to astronomers. Credit: Stoppa & Bulmus et al., Nature Astronomy (2025).
view moreCredit: Stoppa & Bulmus et al., Nature Astronomy (2025).
A new study co-led by the University of Oxford and Google Cloud has shown how general-purpose AI can accurately classify real changes in the night sky — such as an exploding star, a black hole tearing apart a passing star, a fast-moving asteroid, or a brief stellar flare from a compact star system — and explain its reasoning, without the need for complex training.
Published today (8 October) in Nature Astronomy, the study by researchers from the University of Oxford, Google Cloud, and Radboud University demonstrates that a general-purpose large language model (LLM) — Google’s Gemini — can be transformed into an expert astronomy assistant with minimal guidance.
Using just 15 example images and a simple set of instructions, Gemini learned to distinguish real cosmic events from imaging artefacts with approximately 93% accuracy. Crucially, the AI also provided a plain-English explanation for every classification — an important step towards making AI-driven science more transparent and trustworthy, and towards building accessible tools that don’t require massive training datasets or deep expertise in AI programming.
“It’s striking that a handful of examples and clear text instructions can deliver such accuracy,” said Dr Fiorenzo Stoppa, co-lead author from the University of Oxford’s Department of Physics. “This makes it possible for a broad range of scientists to develop their own classifiers without deep expertise in training neural networks — only the will to create one.”
"As someone without formal astronomy training, this research is incredibly exciting.” said Turan Bulmus, co-lead author from Google Cloud. “It demonstrates how general-purpose LLMs can democratise scientific discovery, empowering anyone with curiosity to contribute meaningfully to fields they might not have a traditional background in. It's a testament to the power of accessible AI to break down barriers in scientific research."
Rare Signals in a Universe of Noise
Modern telescopes scan the sky relentlessly, generating millions of alerts every night about potential changes. While some of these are genuine discoveries like exploding stars, the vast majority are ‘bogus’ signals caused by satellite trails, cosmic ray hits, or other instrumental artefacts.
Traditionally, astronomers have relied on specialised machine learning models to filter this data. However, these systems often operate like a ‘black box,’ providing a simple ‘real’ or ‘bogus’ label without explaining their logic. This forces scientists to either blindly trust the output or spend countless hours manually verifying thousands of candidates — a task that will become impossible with the next generation of telescopes such as the Vera C. Rubin Observatory that will output around 20 terabytes of data every 24 hours.
The research team asked a simple question: could a general-purpose, multimodal AI like Gemini, designed to understand text and images together, not only match the accuracy of specialised models but also explain what it sees?
The team provided the LLM with just 15 labelled examples for each of three major sky surveys (ATLAS, MeerLICHT, and Pan-STARRS). Each example included a small image of a new alert, a reference image of the same patch of sky, and a "difference" image highlighting the change, along with a brief expert note. Guided only by these few-shot examples and concise instructions, the model then classified thousands of new alerts, providing a label (real/bogus), a priority score, and a short, readable description of its decision.
A Human in the Loop: An AI That Knows When to Ask for Help
A key component of the study was verifying the quality and usefulness of the AI’s explanations. The team assembled a panel of 12 astronomers to review the AI's descriptions, who rated them as highly coherent and useful.
Moreover, in a parallel test, the team had Gemini review its own answers and assign a ‘coherence score’ to each one. They discovered that the model’s confidence was a powerful indicator of its accuracy: low-coherence outputs were much more likely to be incorrect. This self-assessment capability is critical for building a reliable ‘human-in-the-loop’ workflow. By automatically flagging its own uncertain cases for human review, the system can focus astronomers' attention where it is most needed. Using this self-correction loop to refine the initial examples, the team improved the model's performance on one dataset from ~93.4% to ~96.7%, demonstrating how the system can learn and improve in partnership with human experts.
Co-author Professor Stephen Smartt (Department of Physics, University of Oxford) said: “I’ve worked on this problem of rapidly processing data from sky surveys for over 10 years, and we are constantly plagued by weeding out the real events from the bogus signals in the data processing. We have spent years training machine learning models, neural networks, to do image recognition. However the LLM’s accuracy at recognising sources with minimal guidance rather than task-specific training was remarkable. If we can engineer to scale this up, it could be a total game changer for the field, another example of AI enabling scientific discovery.”
The team envisions this technology as the foundation for autonomous ‘agentic assistants’ in science. Such systems could do far more than classify a single image; they could integrate multiple data sources (like images and brightness measurements), check their own confidence, autonomously request follow-up observations from robotic telescopes, and escalate only the most promising and unusual discoveries to human scientists.
Because the method requires only a small set of examples and plain-language instructions, it can be rapidly adapted for new scientific instruments, surveys, and research goals across different fields.
"We are entering an era where scientific discovery is accelerated not by black-box algorithms, but by transparent AI partners," said Turan Bulmus, co-lead author from Google Cloud. "This work shows a path towards systems that learn with us, explain their reasoning, and empower researchers in any field to focus on what matters most: asking the next great question."
Notes to editors:
For media enquiries and interview requests, contact
Fiorenzo Stoppa — fiorenzo.stoppa@physics.ox.ac.uk
Turan Bulmus – turanbulmus@google.com
The study ‘Textual interpretation of transient image classifications from large language models', will be published in Nature Astronomy at 10:00 BST / 05:00 ET on Wednesday 08 October 2025 at https://www.nature.com/articles/s41550-025-02670-z To view a copy of the study before this under embargo, contact fiorenzo.stoppa@physics.ox.ac.uk
About the University of Oxford
Oxford University has been placed number 1 in the Times Higher Education World University Rankings for the ninth year running, and number 3 in the QS World Rankings 2024. At the heart of this success are the twin-pillars of our ground-breaking research and innovation and our distinctive educational offer.
Oxford is world-famous for research and teaching excellence and home to some of the most talented people from across the globe. Our work helps the lives of millions, solving real-world problems through a huge network of partnerships and collaborations. The breadth and interdisciplinary nature of our research alongside our personalised approach to teaching sparks imaginative and inventive insights and solutions.
Through its research commercialisation arm, Oxford University Innovation, Oxford is the highest university patent filer in the UK and is ranked first in the UK for university spinouts, having created more than 300 new companies since 1988. Over a third of these companies have been created in the past five years. The university is a catalyst for prosperity in Oxfordshire and the United Kingdom, contributing around £16.9 billion to the UK economy in 2021/22, and supports more than 90,400 full time jobs.
Journal
Nature Astronomy
Article Title
Textual interpretation of transient image classifications from large language models
Article Publication Date
8-Oct-2025
The same transient is shown in three surveys, with rows corresponding to Pan-STARRS (top), MeerLICHT (middle), and ATLAS (bottom). Each row presents, from left to right, the New, Reference, and Difference images. Red circles mark the expected position of the transient candidate at the centre of each stamp. All stamps are 100×100 pixels, but their angular sky coverage differs due to survey-specific pixel scales: Pan-STARRS 0.25″/pixel, MeerLICHT 0.56″/pixel, and ATLAS 1.86″/pixel. Credit: Stoppa & Bulmus et al., Nature Astronomy (2025).
Credit
Stoppa & Bulmus et al., Nature Astronomy (2025).
Webb Telescope unveils doomed star hidden in dust
New finding could help solve the mystery of the missing massive red supergiants
Northwestern University
image:
The main image at left shows a combined Webb and Hubble view of spiral galaxy NGC 1637, with the region of interest in the top right. The remaining three panels show a detailed view of a red supergiant star before and after it exploded. The star is not visible in the Hubble image before the explosion, but appears in the Webb image. The July 2025 view from Hubble shows the glowing aftermath of the explosion.
view moreCredit: NASA, ESA, CSA, STScI, Charles Kilpatrick (Northwestern), Aswin Suresh (Northwestern)
A Northwestern University-led team of astronomers has captured the most detailed glimpse yet of a doomed star before it exploded.
Using NASA’s James Webb Space Telescope (JWST), the international team identified a supernova’s source star, or progenitor, at mid-infrared wavelengths for the first time. These observations — combined with archival images from the Hubble Space Telescope — revealed the explosion came from a massive red supergiant star, cloaked in an unexpected shroud of dust.
The discovery may help solve the decades-old mystery of why massive red supergiants rarely explode. Afterall, theoretical models predict red supergiants should make up the majority of core-collapse supernovae. The new study shows these stars do explode but are simply hidden out of sight, within thick clouds of dust. With JWST’s new capabilities, astronomers can finally pierce through the dust to spot these phenomena, closing the gap between theory and observation.
The study will be published on Oct. 8 in The Astrophysical Journal Letters. It marks the JWST’s first detection of a supernova progenitor.
“For multiple decades, we have been trying to determine exactly what the explosions of red supergiant stars look like,” said Northwestern’s Charlie Kilpatrick, who led the study. “Only now, with JWST, do we finally have the quality of data and infrared observations that allow us to say precisely the exact type of red supergiant that exploded and what its immediate environment looked like. We’ve been waiting for this to happen — for a supernova to explode in a galaxy that JWST had already observed. We combined Hubble and JWST data sets to completely characterize this star for the first time.”
An expert on the lives and deaths of massive stars, Kilpatrick is a research assistant professor at Northwestern’s Center for Interdisciplinary Exploration and Research in Astrophysics. Aswin Suresh, a graduate student in physics and astronomy at Northwestern’s Weinberg College of Arts and Sciences and member of Kilpatrick’s research group, is a key coauthor on the paper.
Reddest, dustiest progenitor ever observed
Using the All-Sky Automated Survey of Supernovae, astronomers first detected the supernova, dubbed SN2025pht, on June 29, 2025. Its light had traveled from a nearby galaxy called NGC 1637, located 40 million light-years away from Earth.
By comparing Hubble and JWST images of NGC 1637 from before and after the star’s explosion, Kilpatrick, Suresh and their collaborators found SN2025pht’s progenitor star. It was immediately striking — extremely bright and incredibly red. Although the star shined about 100,000 times brighter than our sun, surrounding dust obscured much of this light. The dusty veil was so thick, in fact, that the star appeared more than 100 times dimmer in visible light than it would appear without the dust. Because dust blocked out shorter, bluer wavelengths of light, the star also appeared surprisingly red.
“It’s the reddest, dustiest red supergiant that we’ve seen explode as a supernova,” Suresh said.
Massive stars in the late stages of their lives, red supergiants are among the largest stars in the universe. When their cores collapse, they explode as Type II supernovae, leaving behind either a neutron star or black hole. The most familiar example of a red supergiant is Betelguese, the bright reddish star in the shoulder of the constellation Orion.
“SN2025pht is surprising because it appeared much redder than almost any other red supergiant we’ve seen explode as a supernova,” Kilpatrick added. “That tells us that previous explosions might have been much more luminous than we thought because we didn’t have the same quality of infrared data that JWST can now provide.”
Clues hidden in dust
The deluge of dust could help explain why astronomers have struggled to find red supergiant progenitors. Most massive stars that explode as supernovae are the brightest and most luminous objects in the sky. So, theoretically, they should be easy to spot before they explode. But that hasn’t been the case.
Astronomers posit that the most massive aging stars also might be the dustiest. These thick cloaks of dust might dim the stars’ light to the point of utter undetectability. The new JWST observations support this hypothesis.
“I’ve been arguing in favor of that interpretation, but even I didn’t expect to see such an extreme example as SN2025pht,” Kilpatrick said. “It would explain why these more massive supergiants are missing because they tend to be dustier.”
In addition to the presence of dust itself, the dust’s composition was also surprising. While red supergiants tend to produce oxygen-rich, silicate dust, this star’s dust appeared rich with carbon. This suggests that powerful convection in the star’s final years may have dredged up carbon from deep inside, enriching its surface and altering the type of dust it produced.
“The infrared wavelengths of our observations overlap with an important silicate dust feature that’s characteristic of some red supergiant spectra,” Kilpatrick said. “This tells us that the wind was very rich in carbon and less rich in oxygen, which also was somewhat surprising for a red supergiant of this mass.”
A new era for exploding stars
The new study marks the first time astronomers have used JWST to directly identify a supernova progenitor star, opening the door to many more discoveries. By capturing light across the near- and mid-infrared spectrum, JWST can reveal hidden stars and provide missing pieces for how the most massive stars live and die.
The team now is searching for similar red supergiants that may explode as supernovae in the future. Observations by NASA’s upcoming Nancy Grace Roman Space Telescope may help this search. Roman will have the resolution, sensitivity and infrared wavelength coverage to see these stars and potentially witness their variability as they expel out large quantities of dust near the end of their lives.
“With the launch of JWST and upcoming Roman launch, this is an exciting time to study massive stars and supernova progenitors,” Kilpatrick said. “The quality of data and new findings we will make will exceed anything observed in the past 30 years.”
The study, “The Type II SN 2025pht in NGC 1637: A red supergiant with carbon-rich circumstellar dust as the first JWST detection of a supernova progenitor star,” was supported by the National Science Foundation (award number AST-2432037).
Journal
The Astrophysical Journal Letters
Method of Research
Observational study
Subject of Research
Not applicable
Article Title
The Type II SN 2025pht in NGC 1637: A red supergiant with carbon-rich circumstellar dust as the first JWST detection of a supernova progenitor star
Article Publication Date
8-Oct-2025
Moon's biggest impact crater made a radioactive splash
New analyses of the largest impact crater on the moon may help scientists solve some of the longstanding mysteries of how Earth's only natural satellite came to be.
University of Arizona
image:
The South Pole-Aitken impact basin on the far side of the Moon formed in a southward impact (toward the bottom in the image). The basin has a radioactive “KREEP-rich” ejecta blanket on one side of the basin (bright red), containing material excavated from the lunar magma ocean. Artemis astronauts will land within this material at the south end of the basin (bottom in image).
view moreCredit: Jeff Andrews-Hanna/University of Arizona/NASA/NAOJ
When astronauts land near the moon's south pole as part of NASA's Artemis program in a few years, they likely will find themselves in an unexpected treasure trove of clues that could help scientists better understand how Earth's only natural satellite came to be. That's according to a new study led by Jeffrey Andrews-Hanna, a planetary scientist at the University of Arizona.
Published on Oct. 8 in the journal Nature, the paper also provides a snapshot of the moon's tumultuous past that could help explain longstanding puzzles such as why the moon's crater-riddled far side is so dramatically different from its smooth near side, which provided the backdrop for the Apollo moon landings in the 1960s and 1970s.
Roughly 4.3 billion years ago, when the solar system was still in its infancy, a giant asteroid slammed into the far side of the moon, blasting an enormous crater referred to as the South Pole-Aitken basin, or SPA. This impact feature is the largest crater on the moon, spanning more than 1,200 miles north to south, and 1,000 miles east to west. The oblong shape of the basin is the result of a glancing blow rather than a head-on impact.
By comparing the shape of SPA to other giant impact basins across the solar system, Andrews-Hanna and his team found that these features get narrower in the down-range direction, with a shape resembling a teardrop or an avocado. Upending conventional wisdom that SPA was formed by an asteroid coming in from a southern direction, the new analysis reveals that SPA's shape narrows toward the south, indicating an impact coming from the north instead. The down-range end of the basin should be covered by a thick layer of material excavated from the lunar interior by the impact, while the up-range end should not, Andrews-Hanna explained.
"This means that the Artemis missions will be landing on the down-range rim of the basin – the best place to study the largest and oldest impact basin on the moon, where most of the ejecta, material from deep within the moon's interior, should be piled up," he said.
In the paper, the group presents additional evidence supporting a southward impact from analyses of the topography, the thickness of the crust and the surface composition. In addition, the results offer new clues about on the interior structure of the moon and its evolution through time, according to the authors.
It has long been thought that the early moon was melted by the energy released during its formation, creating a magma ocean covering the entire moon. As that magma ocean crystallized, heavy minerals sunk to make the lunar mantle, while light minerals floated to make the crust. However, some elements were excluded from the solid mantle and crust and instead became concentrated in the final liquids of the magma ocean. Those "leftover" elements included potassium, rare earth elements and phosphorus, collectively referred to as "KREEP " – the acronym's first letter reflecting potassium's symbol in the periodic table of elements, "K." According to Andrews-Hanna these elements were found to be particularly abundant on the moon's near side.
"If you've ever left a can of soda in the freezer, you may have noticed that as the water becomes solid, the high fructose corn syrup resists freezing until the very end and instead becomes concentrated in the last bits of liquid," he said. "We think something similar happened on the moon with KREEP."
As it cooled over many millions of years, the magma ocean gradually solidified into crust and mantle. "And eventually you get to this point where you just have that tiny bit of liquid left sandwiched between the mantle and the crust, and that's this KREEP-rich material," he said.
"All of the KREEP-rich material and heat-producing elements somehow became concentrated on the moon's near side, causing it to heat up and leading to intense volcanism that formed the dark volcanic plains that make for the familiar sight of the "face" of the Moon from Earth, according to Andrews-Hanna. However, the reason why the KREEP-rich material ended up on the nearside, and how that material evolved over time, has been a mystery.
The moon's crust is much thicker on its far side than on its near side facing the Earth, an asymmetry that has scientists puzzled to this day. This asymmetry has affected all aspects of the moon's evolution, including the latest stages of the magma ocean, Andrews-Hanna said.
"Our theory is that as the crust thickened on the far side, the magma ocean below was squeezed out to the sides, like toothpaste being squeezed out of a tube, until most of it ended up on the near side," he said.
The new study of the SPA impact crater revealed a striking and unexpected asymmetry around the basin that supports exactly that scenario: The ejecta blanket on its western side is rich in radioactive thorium, but not in its eastern flank. This suggests that the gash left by the impact created a window through the moon's skin right at the boundary separating the crust underlain by the last remnants of the KREEP-enriched magma ocean from the "regular" crust.
"Our study shows that the distribution and composition of these materials match the predictions that we get by modeling the latest stages of the evolution of the magma ocean," Andrews-Hanna said. "The last dregs of the lunar magma ocean ended up on the near side, where we see the highest concentrations of radioactive elements. But at some earlier time, a thin and patchy layer of magma ocean would have existed below parts of the far side, explaining the radioactive ejecta on one side of the SPA impact basin."
Many mysteries surrounding the moon's earliest history still remain, and once astronauts bring samples back to Earth, researchers hope to find more pieces to the puzzle. Remote sensing data collected by orbiting spacecraft like those used for this study provide researchers with a basic idea of the composition of the moon's surface, according to Andrews-Hanna. Thorium, an important element in KREEP-rich material, is easy to spot, but getting a more detailed analysis of the composition is a heavier lift.
“Those samples will be analyzed by scientists around the world, including here at the University of Arizona, where we have state -of-the-art facilities that are specially designed for those types of analyses," he said.
"With Artemis, we'll have samples to study here on Earth, and we will know exactly what they are," he said. "Our study shows that these samples may reveal even more about the early evolution of the moon than had been thought."
Journal
Nature
Method of Research
Observational study
Subject of Research
Not applicable
Article Title
Southward impact excavated magma ocean at the lunar South Pole–Aitken basin
Article Publication Date
8-Oct-2025
Impact craters on planets share common shapes across vastly different worlds in the solar system, according to Jeffrey Andrews-Hanna. The South Pole-Aitken basin on the moon described in this study (left), the Hellas basin on Mars (center) and the Sputnik basin on Pluto (right) all formed in oblique impacts. Their outlines get narrower in the down-range direction (bottom) like a raindrop or an avocado. Elevations range from low (blue) to high (orange).
The South Pole-Aitken impact basin on the far side of the Moon formed in a southward impact (toward the bottom in the image). The basin has a radioactive “KREEP-rich” ejecta blanket on one side of the basin (bright red), containing material excavated from the lunar magma ocean. Artemis astronauts will land within this material at the south end of the basin (bottom in image).
Credit
Jeff Andrews-Hanna/University of Arizona/NASA/NAOJ
When The Sun Sneezes, Earth Catches A Cold: Inside A Solar Storm – Analysis
Every day we feel weather around us. The wind blows and clouds move in the sky. Sometimes storms come—wind gets strong, it can rain, and there may be thunder and lightning.
Did you know there is weather in space too? It all begins with the Sun.
The Sun: The Shining Star at the Center of Our Solar System
The Sun is a huge, extremely hot ball of gas at the center of our solar system. Its surface temperature can reach about 10,800°F (6,000°C) — that’s five times hotter than the lava that comes out of volcanoes on Earth. Just like lava glows from heat, the Sun shines brightly because it’s so hot.
The Sun is made of a special hot gas called plasma. It’s not like the air we breathe — in plasma, the atoms are so hot that they break apart, letting electric charges move freely.
Normal gases, like the air we breathe, are made of atoms moving around. Each atom has a center called the nucleus (with a positive charge) and tiny electrons (with a negative charge) around it. These parts are tightly held together, so the atom has no overall charge — it is neutral.
A gas turns into plasma when it gets so hot that the electrons break away from the nuclei of the atoms. This means the gas is now made of free-moving charged particles instead of whole atoms. Once the charged particles are separated, the plasma can carry electricity. This allows magnetic fields to pull or push the plasma, depending on their strength and direction.
Understanding Solar Wind: The Sun’s Constant Breath
The Sun doesn’t just sit quietly in space—it’s constantly active, releasing energy and particles in all directions. Think of it like a giant bonfire that not only gives off light and heat but also sends sparks flying outward.
Sometimes, the Moon moves between the Sun and the Earth, blocking the Sun’s light and making the sky turn dark. This amazing event is called a total solar eclipse.
During a solar eclipse, when the Moon hides the Sun, you can see faint, soft light patterns spreading out around the Moon. These lights are not from the Moon — they come from the Sun’s outer atmosphere, called the corona.
The corona is the Sun’s outermost layer, a vast region made of very hot gas and plasma that stretches far into space. Normally, we can’t see it because the Sun’s bright light hides it. But during a total solar eclipse, when the Moon completely blocks the Sun, the corona becomes visible, glowing like a soft white halo — a beautiful ring of pale light around the dark Moon.
The corona is incredibly hot — reaching temperatures of several million degrees, which is actually much hotter than the Sun’s visible surface. This might seem strange at first. Why would the outer layer be hotter than the surface itself? Scientists are still working to fully understand this mystery, but they believe it has to do with the Sun’s powerful magnetic fields transferring energy outward.
Because of this extreme heat, the particles in the corona move very fast and can break free from the Sun’s gravity. These charged particles travel through space, spreading across the entire solar system. This continuous flow of plasma from the Sun is what we call the solar wind.
The solar wind is an invisible and continuous stream of plasma that flows constantly from the Sun, creating a huge bubble in space that extends far beyond Pluto’s orbit—well past the edge of our familiar planetary neighborhood. It can travel at incredible speeds of about 2 million miles (3 million kilometers) per hour — fast enough to circle the Earth in under a minute.
For comparison, the International Space Station takes about 90 minutes to complete one round around the Earth. This shows how powerful and fast the solar wind really is.
How Scientists Study the Solar Wind
Although it’s hard to see the solar wind in pictures after it leaves the Sun’s corona, scientists can measure it using special instruments in space. To study it more closely, they have sent space missions like the Parker Solar Probe, which has gone closer to the Sun than any spacecraft ever before.
Launched by NASA in 2018, the Parker Solar Probe is on a daring mission that would have seemed impossible just a few decades ago. It flies directly into the solar wind, measuring the hot gas and charged particles just as they escape from the Sun. It works like a weather station, but instead of measuring rain and temperature on Earth, it’s measuring conditions in one of the harshest environments imaginable.
The Parker Solar Probe carries a special camera called WISPR (Wide-field Imager for Solar PRobe) that looks sideways instead of straight at the Sun. This helps it capture how the Sun’s light bounces off tiny particles in the solar wind.
This bouncing of light is called scattering, and it’s the same reason the sky looks blue on Earth — sunlight scatters when it hits the tiny particles in our atmosphere. In space, the camera sees this scattered light to help scientists understand how the solar wind moves and changes as it travels away from the Sun.
Powerful Explosions on the Sun
The Earth’s magnetic field is an invisible force that surrounds our planet, like a protective shield. It is created by the movement of molten iron deep inside the Earth’s core, which produces electric currents. These currents generate magnetic forces — just like a giant bar magnet with a north and south pole.
This magnetic field protects the Earth from the Sun’s harmful charged particles and the solar wind, keeping our atmosphere and life safe. Without this shield, the solar wind would gradually strip away our atmosphere, much like what happened to Mars billions of years ago.
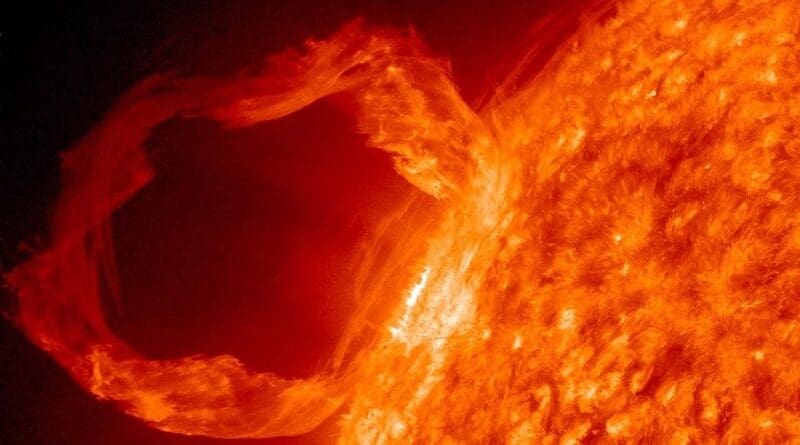
Sometimes, the Sun releases huge explosions that throw out large clouds of hot plasma into space, and some of these head toward Earth. These powerful blasts are called coronal mass ejections, or CMEs for short.
Unlike the solar wind, which blows all the time like a steady breeze, coronal mass ejections happen suddenly and are much stronger and more powerful—more like a hurricane compared to a gentle wind.
You can think of coronal mass ejections as solar storms. These storms are different from Earth’s weather because they are mainly caused by magnetism, not by wind or rain.
The Sun is like a powerful magnet because it has magnetic fields created by the movement of hot, charged gases deep inside it. These magnetic fields form invisible lines that guide charged particles such as plasma, allowing them to move easily along these paths—similar to how iron filings arrange themselves along the magnetic field lines of a bar magnet.
As the Sun constantly moves and spins, its hot gases and magnetic forces get stirred up, making the magnetic field lines twist and tangle. During powerful events like coronal mass ejections, the energy from these explosions pushes and pulls the magnetic lines outward, sending them far into space—sometimes carrying billions of tons of plasma with them.
When these solar storms reach Earth, their twisted magnetic fields can interact with our planet’s own magnetic field, creating disturbances in space that scientists refer to as space weather.
The Sun Drives Space Weather
The Earth has a magnetic field that creates a protective bubble called the magnetosphere. It works like a force field, protecting us from the solar wind and solar storms, keeping life on Earth safe from the Sun’s harmful particles.
Most of the time, Earth’s protective magnetic bubble works so well that we don’t even notice anything unusual happening in space. But during powerful solar storms, some of the solar wind’s plasma can enter Earth’s atmosphere.
When a coronal mass ejection from the Sun passes by Earth, it carries a strong magnetic field with it. Sometimes, this field connects with Earth’s magnetic field through a process called magnetic reconnection—like two sets of lines joining together. When this happens, the magnetic lines rearrange and briefly open a pathway, allowing some of the Sun’s hot plasma to flow into Earth’s upper atmosphere.
This interaction can cause strong magnetic storms across the Earth, affecting everything from satellite operations to power grids on the ground. The relationship between the Sun’s eruptions and the Earth’s magnetic field is what creates space weather.
Space weather is similar to Earth’s weather in some ways, but instead of coming from the atmosphere, it is created by the Sun’s activity and the movement of plasma in space. Just as meteorologists track hurricanes and tornadoes to warn people on Earth, space weather forecasters monitor the Sun’s activity to predict when solar storms might affect our planet.
Why Space Weather Matters
It is important for scientists to study and predict space weather because it can cause power failures, communication problems, and even make satellites fall back toward Earth before their time. In 1989, a powerful solar storm caused a massive blackout in Quebec, Canada, leaving millions of people without electricity for hours. Satellites can be damaged or knocked out of their orbits, affecting GPS navigation, television broadcasts, and internet services that we depend on every day.
Airlines also pay attention to space weather. During strong solar storms, they sometimes reroute flights that normally fly over the North and South Poles because increased radiation at high altitudes can pose risks to passengers and crew, and can interfere with communication systems.
Apart from its dangers, space weather can also create beautiful lights in the sky called the Northern Lights (aurora borealis) and Southern Lights (aurora australis). These lights appear near the North and South Poles because the Earth’s magnetic field is strongest there, funneling the Sun’s charged particles down toward the poles where they collide with gases in our atmosphere and make the sky glow in bright colors—green, red, purple, and sometimes even blue.
During particularly strong solar storms, these auroras can be seen much farther from the poles than usual. People in places like New York, London, or even further south have occasionally witnessed these spectacular light shows dancing across their night skies.
If you ever get a chance to see them, remember that you’re looking at space weather in action — the result of powerful eruptions and solar wind from the Sun lighting up the Earth’s sky. It’s a beautiful reminder of the connection between our planet and the star that gives us life.
Looking to the Future
As we become more dependent on technology—satellites, GPS, power grids, and communication networks—understanding space weather becomes increasingly important. Scientists around the world work together to monitor the Sun constantly, using satellites positioned between the Sun and Earth to give us early warnings of approaching solar storms.
The next time you hear about a solar storm in the news, you’ll understand what’s really happening: the Sun has sneezed, and Earth might catch a cold. But thanks to our planet’s magnetic shield and the work of dedicated scientists, we’re protected from the worst effects of these cosmic storms.

Girish Linganna
Girish Linganna is a Defence, Aerospace & Political Analyst based in Bengaluru. He is also Director of ADD Engineering Components, India, Pvt. Ltd, a subsidiary of ADD Engineering GmbH, Germany. You can reach him at: girishlinganna@gmail.com
No comments:
Post a Comment