Showing posts sorted by date for query GLOBAL WARMING. Sort by relevance Show all posts

Tuesday, June 02, 2026

Mapping carbon from ABoVE


Rapid warming in Arctic and boreal regions may transform forests and tundra from carbon sinks into carbon sources. Two University of Utah-led studies improve biomass mapping to assess whether northern ecosystems will mitigate or accelerate climate change


University of Utah

Biomass from the sky 

image: 

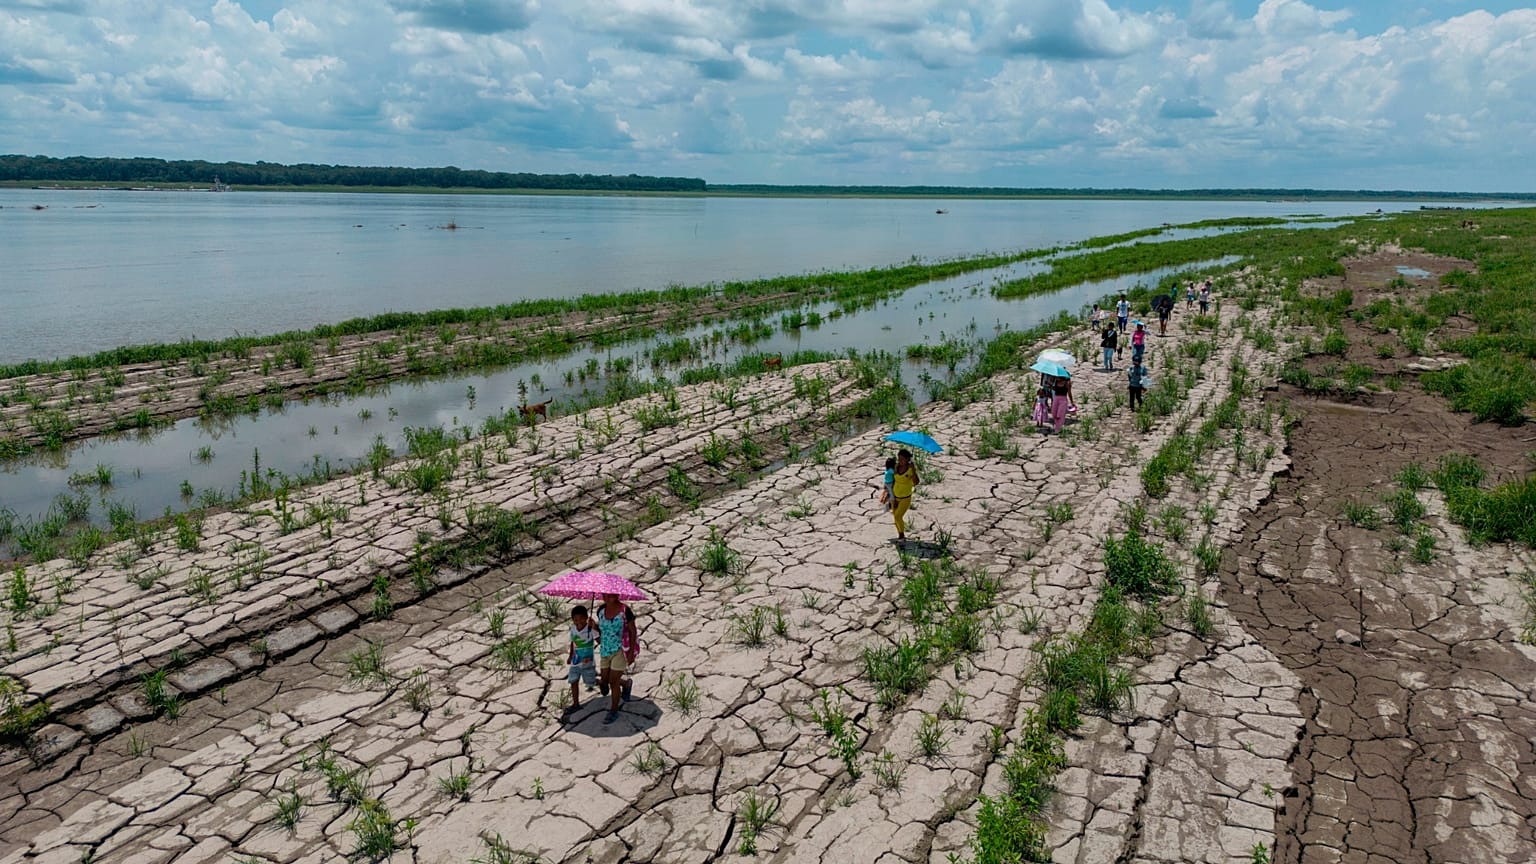
Mountains of Alaska from NASA’s B-200 plane in the Arctic Circle. 

view more 

Credit: Charles Miller/NASA JPL/ABoVE


In the far north regions of Earth, where forests stretch across Alaska and Canada, climate change is unfolding at an accelerated pace. Arctic and boreal regions are warming up to four times faster than the global average, putting immense pressure on ecosystems that absorb enormous amounts of CO2 and help slow climate change. Through photosynthesis, vast expanses of vegetation naturally pull carbon from the atmosphere and sequester it in their biomass.

As climate-related disturbances like wildfires and drought intensify, parts of the region may shift from carbon sinks to carbon sources, disrupting the delicate global carbon balance. Understanding exactly how much carbon these ecosystems store or release through their biomass is important for climate mitigation efforts but getting accurate measurements is a challenge.

Two new papers aim to improve how scientists measure biomass across Arctic and boreal zones. Led by University of Utah biologists Wanwan Liang and Jon Wang, one reveals inconsistencies among widely used satellite-based datasets, and the other introduces a new biomass map that captures 40 years of ecological change in unprecedented detail.

The research emerged from the Arctic-Boreal Vulnerability Experiment (ABoVE), a NASA-funded, 15-year field research campaign to understand ecosystem change in northern high latitudes.

Making sense of remote sensing

The first study, published in Environmental Research Letters in March 2026, examines the growing number of satellite-based datasets used to map landscapes across Arctic and boreal North America.

“There are so many datasets out there now, but there’s very little guidance for users on how to choose among them,” explained Liang, U postdoctoral researcher and the study’s lead author.

One major contributor to dataset abundance is the rapid advances in remote sensing technology. Satellites continuously capture images of Earth’s surface, and scientists use those data, combined with field measurements, to estimate forest structure, growth and carbon storage.

As the number of datasets has grown, so has confusion about their accuracy and intended use. Different maps often produce different answers, depending on their design, data sources and landscape coverage.

“Two maps can give completely different estimates for the same region and if you’re not an expert, it’s really hard to know which one to trust,” said Wang, assistant professor in the U’s School of Biological Sciences and the study’s principal investigator.

To address that problem, Liang and her collaborators conducted a large-scale meta-analysis, comparing nine biomass datasets across North America’s Arctic and boreal regions. Rather than declaring a single “best” map, the study identifies which datasets are most reliable for specific uses, from tracking wildfire impacts to estimating national carbon budgets.

“It’s more like a guide,” Wang said. “Different maps are better for different purposes.”

Size of a baseball diamond

Liang also led the development of a new biomass dataset, one of the most detailed of its kind. Built using satellite imagery from the NASA/USGS Landsat Program, airborne LiDAR measurements and extensive forest inventory data from the U.S. and Canadian Forest Services, the dataset tracks aboveground biomass annually across nearly four decades. The dataset is described in a paper published in the journal Remote Sensing of Environment on April 30, 2026.

Spanning from 1984 to the present, the map captures changes at a resolution of 30 meters, roughly the size of a baseball diamond. That level of detail allows researchers to detect not only large disturbances like wildfires, but also smaller-scale changes such as logging or land conversion.

“Anything happening at 30 meters or larger, we can detect,” Liang said.

The dataset provides a powerful new lens for understanding how northern ecosystems are responding to climate change. By tracking where biomass is increasing or decreasing, scientists can identify the forces driving those changes, be it drought, fire, human activity, warming temperatures or rising atmospheric CO2 concentrations.

This matters because Arctic and boreal forests are potential buffers against climate change. As temperatures rise, scientists have hypothesized that these ecosystems could absorb more carbon, helping offset emissions from fossil fuels. But the reality is far more complex.

“There’s been this idea that northern forests will just keep taking up more carbon as it gets warmer,” Wang said. “But we don’t actually know if that’s true.”

The same warming that can stimulate plant growth can also increase wildfire frequency and intensity, insect outbreaks and drought stress—factors that boost forest mortality and release carbon back into the atmosphere.

“If plants start to die, they stop absorbing carbon,” Liang explained. “And as they decompose, they release CO₂. That would accelerate climate change.”

The uncertainty has real-world implications. Governments rely on carbon estimates to inform climate policy and report greenhouse gas inventories. In Canada, for example, national carbon accounting influences how emissions targets are set and evaluated.

“When different datasets give different answers, it creates a lot of uncertainty,” Wang said. “And that makes decision-making harder.”

Beyond policy, high-resolution biomass maps can help estimate how much carbon might be lost in a fire, identify high-risk areas and guide land-use decisions.

In contrast to some private-sector efforts that restrict access to carbon data, Liang and Wang’s project aims to make information transparent and usable for scientists, policymakers and the public.

“This is taxpayer-funded science,” Wang said. “We want people to be able to use it.”

Find the full story at the College of Science.

#####

Meta-analysis of North American Arctic and boreal aboveground biomass datasets: assessing accuracy, dynamics and similarities (Enviro Res Letters, March 2026), was funded by NASA ABoVE (80NSSC23K0140, 80NSSC22K1254, 80NSSC22K124), Arizona/NASA Space Grant Consortium Award (80NSSC20M0041, National Science Foundation (2116864, 1928048).

Derivation and evaluation of Landsat-derived annual aboveground biomass maps for Arctic and Boreal North America, 1984-2022 (Rem Sens Enviro, April 2026), was funded by NASA AboVE (80NSSC23K0140). Other University of Utah co-authors include Eric Bullock and Jiaming Lu.

UN warns world to prepare for El Nino extreme weather

Geneva (AFP) – There is an 80-percent chance of the warming El Nino phenomenon developing between June and August, increasing the risk of extreme weather events, the World Meteorological Organization said Tuesday.


Issued on: 02/06/2026 - FRANCE24

El Nino warms surface temperatures in the central and eastern equatorial Pacific Ocean © MARTIN BERNETTI / AFP

"Fuelled by unusually warm ocean waters in the tropical Pacific, El Nino conditions are developing and are set to influence global temperature and rainfall patterns," the United Nations' WMO weather and climate agency said.

Forecasts from the WMO global network "indicate a pronounced shift toward El Nino conditions, with probabilities reaching 80 percent for June-August", the Geneva-based organisation said.

El Nino is a natural climate phenomenon that warms surface temperatures in the central and eastern equatorial Pacific Ocean, bringing worldwide changes in winds, pressure and rainfall patterns.

It typically takes place every two to seven years and lasts around nine to 12 months.

The effects of El Nino © Nicholas SHEARMAN / AFP


Conditions oscillate between El Nino and its opposite La Nina, with neutral conditions in between.

The likelihood of El Nino developing by November is "near or above 90 percent", and most forecast models suggest it will be "at least moderate -- and possibly strong", the WMO said in its quarterly El Nino/La Nina update.

WMO chief Celeste Saulo said the world needed to get ready for an El Nino which could "exacerbate drought and heavy rainfall and increase the risk of heatwaves both on land and in the ocean".

The WMO says that even a moderate El Nino makes some weather and climate extremes more likely.

The last El Nino contributed to making 2023 the second-hottest year on record and 2024 the all-time high at around 1.55C above the 1850-1900 pre-industrial average.
'Urgent climate warning': Guterres

In late April to mid-May, the sea-surface temperature in the central-eastern Equatorial Pacific -- the area used as a monitoring reference -- was approaching El Nino thresholds, the WMO said, with sub-surface temperatures more than 6C above average.

Meanwhile, the Southern Oscillation Index -- the atmospheric component of El Nino -- is also consistent with the phenomenon developing.


El Nino is likely to develop in the coming months, forecasters say © Omar KAMAL / AFP


The WMO said there was no evidence that climate change increases the frequency or intensity of El Nino events.

However, the agency believes it can amplify the associated effects, because a warmer ocean and atmosphere increase the availability of energy and moisture for extreme weather events, such as heatwaves and heavy rainfall.

"El Nino is arriving on our doorstep," UN chief Antonio Guterres said in a video message.

"The world must treat it as the urgent climate warning it is. El Nino conditions will pour fuel on the fire of a warming world.

WMO climate prediction chief Wilfran Moufouma Okia said temperatures typically spike up to 12 months after an El Nino event © Fabrice COFFRINI / AFP


"The only effective response is climate action equal to the crisis -- ending the addiction to fossil fuels, accelerating the shift to renewables, protecting the most vulnerable, and delivering early warning systems for all."

Saulo said 128 countries now have multi-hazard early-warning systems in place, with the UN target being universal coverage by the end of 2027.
Temperatures above normal

While El Nino typically peaks between November and February, the resulting spike in temperatures typically comes later down the line.

The World Meteorological Organization has its headquarters in Geneva, Switzerland © Fabrice COFFRINI / AFP

Next month's forecast is likely to be more accurate as to the onset of El Nino and its strength.

The WMO said that for June to August, forecasts project "a nearly universal dominance of above normal temperatures in nearly all parts of the globe".

This increases the risk of compounding hazards in some regions and accelerating the onset of drought conditions where rainfall is reduced, it said.

Saulo said El Nino would have "cascading impacts", with a warming ocean in the tropics resulting in effects on global trade.

These go from "variability of the climate, into the economy and security of the people. That's why this information is so relevant and so important", she told reporters.

The WMO hopes advance warning will guide preparedness, especially in climate-sensitive sectors like agriculture, water management, energy and health.

Tegucigalpa, the capital of Honduras, and its surrounding areas are already facing a severe drought © JOHNY MAGALLANES / AFP

Regional climate centres are predicting "below-normal" rainfall during the critical June-September rainy season in the northern Greater Horn of Africa; below-average monsoon rainfall in south Asia; and drier and warmer summer conditions in central America.

During the northern hemisphere summer, warm waters associated with El Nino can fuel hurricanes in the central and eastern Pacific, while hindering their development in the Atlantic Ocean.

© 2026 AFP


El Niño: Almost everywhere will face above average summer temperatures, WMO warns

FILE - People walk through a part of the Amazon River that shows signs of drought in Santa Sofia, on the outskirts of Leticia, Colombia, Oct. 20, 2024.
Copyright AP Photo/Ivan Valencia

By Angela Symons
Published on

El Niño is a naturally occurring weather phenomenon but its effects are worse because of climate change.

El Niño will hit this summer with 80 per cent certainty, according to the latest forecast by the World Meteorological Organization (WMO) – and Europe should brace for more extreme heat, with some areas at heightened risk of drought and flooding.

Over the past week, parts of Western Europe suffered record-breaking spring temperatures as a powerful heat dome formed. Spells like this are likely to become more intense, longer and more frequent as El Niño takes hold – and scientists warn it could stretch all the way to 2028.

Although the strength of the weather phenomenon is still uncertain, WMO models suggest it will be at least moderate, and possibly strong, with a 90 per cent chance of it continuing until at least November.

“The world must treat it as the urgent climate warning it is. El Niño conditions will pour fuel on the fire of a warming world,” says UN Secretary-General António Guterres.

‘Prepare for hotter than normal temperatures’

Fuelled by unusually warm ocean waters in the tropical Pacific, El Niño is expected to leave virtually nowhere untouched, with above-average temperatures forecast around the globe for June to August.

“We need to prepare for a potentially strong El Niño event – which will exacerbate drought and heavy rainfall and increase the risk of heatwaves both on land and in the ocean,” says WMO Secretary-General Celeste Saulo.

The most recent El Niño, in 2023-24, was one of the five strongest on record and contributed to 2024 becoming the world’s hottest year on record. According to the European State of the Climate 2024 report, published jointly by the Copernicus Climate Change Service and the WMO, Europe experienced dramatic and contrasting conditions that year: while the east faced dry, scorching heat, the west endured heavy rainfall and flooding.

This year, “impacts will hit even harder, travel even farther, and cross borders with devastating speed,” Guterres warns.

The UN has previously cautioned that there is an 86 per cent chance the coming years will smash 2024’s heat record, with climate scientists warning that a “whole range of extreme weather events” are brewing as a strong El Niño collides with accelerating global warming.

While climate change is not thought to increase El Niño’s frequency or intensity, it can amplify its effects. A warmer ocean and atmosphere increases the availability of energy and moisture for extreme weather events such as heatwaves and heavy rainfall.

How long could El Niño last?

Sea-surface temperatures began approaching El Niño thresholds in late April to mid-May this year, according to WMO observations. Subsurface temperatures across the tropical Pacific are running more than 6°C above average, providing a substantial reservoir of heat feeding the surface warming.

The powerful naturally-occurring weather pattern typically forms every two to seven years and lasts around nine to 12 months. It usually reaches its peak intensity between November and February, with impacts on global temperatures often strongest in the second year after development.

Its effects vary depending on intensity, duration, the time of year it develops, and how it interacts with other climate variables.

This year, above-average temperatures are forecast by WMO nearly everywhere in June, July and August. Below-average rainfall is expected across South Asia, the Greater Horn of Africa and Central America, where drier and warmer conditions are anticipated during critical growing and rainy seasons.

“Advance seasonal forecasts and early warnings are vital to save lives and cushion the impact on our economies and our communities,” says Saulo. The time for informed decision-making, planning and preparedness is now, the WMO adds.

Guterres urges action on the human-caused elements of climate extremes, calling for “ending the addiction to fossil fuels and accelerating the shift to renewables”.


Amazon rainforest emits new stress-defense molecules during El Niño drought


New study by the Max Planck Institute for Chemistry shows: The forest chemically adapts to extreme drought – and continues responding long after the stress ends


Max Planck Institute for Chemistry

Amazon rainforest: Air samples collected directly above the forest canopy 

image: 

A 80-meter measurement tower near the ATTO research station in the Brazilian rainforest, 93 miles northeast of Manaus. At a height of 23 meters, directly above the forest canopy, the research team collected air samples every one and a half to three hours.

view more 

Credit: Dom Jack, Max Planck Institute for Chemistry


  • During the 2023–2024 El Niño the most severe drought ever recorded in the Amazon basin tree emissions of sesquiterpenes surged by 122 percent, while isoprene and monoterpenes barely changed.
  • The study also detected unexpected emissions of sesquiterpene alcohols in the wet season after the drought, suggesting the forest’s stress-defense metabolism stays active long after the immediate stress has passed.

The Amazon rainforest responded to the most severe drought ever recorded in the basin with an unexpected defense mechanism. Researchers at the Max Planck Institute for Chemistry in Mainz, Germany, found that during and after the intense 2023-2024 El Niño cycle, the most intense drought ever recorded in the region, vegetation significantly changed its chemical emissions to cope with environmental stress. The study was published in Nature Communications Earth & Environment.

Sesquiterpenes act as stress signals and protective compounds

The research team measured the forest’s release of biogenic volatile organic compounds, or BVOCs, which are carbon-based molecules naturally emitted by vegetation. The results were striking. While isoprene and monoterpenoid levels showed little influence from El Niño conditions of drought and heat, emissions of sesquiterpenes increased by 122% over the course of the event. Sesquiterpenes are reactive airborne molecules that trees produce as stress signals and protective substances. A well-known example is caryophyllene, a peppery-smelling compound found in cloves and black pepper.

Even more surprisingly, the study detected unexpected emissions of less volatile sesquiterpene alcohols, including beta-eudesmol, alpha-eudesmol, and gamma-eudesmol, during the wet season after the drought peak. These findings suggest an adaptive response to oxidative stress, revealing how vegetation metabolically adjusts to adverse conditions. Interestingly the change persisted long after the immediate stressor has passed. "Our results show that severe drought shifts the atmosphere toward lower-volatility and more reactive compounds”, explains Joseph Byron, the study’s first author and a researcher at the Max Planck Institute for Chemistry. "This reflects underlying metabolic changes as the rainforest attempts to mitigate damage from abiotic stress." Project leader Jonathan Williams added “between El Nino events, which occur every 2-7 years, the rainforest can revert to the original non-stressed emissions. However, climate models suggest that El Nino events will increase in frequency and intensity in this century, so these emissions may become a permanent feature of the region, altering the overlying atmospheric chemistry”.

Air samples collected directly above the forest canopy

The researchers collected canopy air samples at the Amazon Tall Tower Observatory (ATTO), 150 km northeast of Manaus, Brazil. Using sorbent cartridges, they gathered samples every 1.5 to 3 hours at 23 meters on an 80-meter tower. In the laboratory in Mainz, they later analyzed them offline using gas chromatography and mass spectrometry.

The findings build on earlier work by the same team on chemical indicators of stress in the Amazon rainforest. In their previous research, they identified specific mirror molecules, or enantiomers, that can serve as indicators of stress within the rainforest ecosystem (see related press release: Mirror image molecules reveal drought stress in the Amazon rainforest). The current study expands this understanding by showing which specific reactive volatile compounds are produced directly as part of the forest’s defense response during extreme climate events.

Implications for climate change and rainforest resilience

Understanding these chemical responses is very important, as climate change is predicted to make El Niño events more intense and persistent. The shift toward more reactive compounds could have significant implications for atmospheric chemistry and the overall resilience of the Amazon rainforest.

Background ATTO

ATTO is a German-Brazilian joint project which was launched in 2009. It is managed by the Max Planck Institutes for Biogeochemistry in Jena and for Chemistry in Mainz, as well as by the Brazilian INPA and the Amazon State University (UEA) in Manaus. The project is funded by the German Federal Ministry of Education and Research (BMBF), the Ministério da Ciência, Tecnologia e Inovações (MCTI), the Max Planck Society and the Brazilian organizations including FAPEAM and individual researchers bring funding from other scientific funding agencies. 

More on ATTO: https://www.mpic.de/3538403/ATTO


Carbon dioxide removal will need to scale faster than solar to meet climate targets


University of Oxford


Oxford, 02 June 2026: The 3rd Edition of the State of Carbon Dioxide Removal report finds that national pledges fall short of pathways limiting warming to 1.5°C this century by more than 5 billion tonnes of CO₂ per year by 2050. Closing this gap would require carbon dioxide removal (CDR) to grow at rates comparable to, or faster than, the most rapid clean energy transitions in history, including solar power and electric vehicles.

Cutting emissions remains the first and most important priority for tackling climate change. Most progress in limiting warming will come from reducing emissions, while CDR will help address emissions that are hardest to eliminate. However, for as long as any emissions continue, CDR will be needed to halt the rise in global temperature. Delaying emissions cuts by a decade, for example, would warm the planet by about 0.15°C and increase the need for CDR later this century.

Today, the world removes about 2.2 billion tonnes of CO₂ from the atmosphere each year, almost all of it through land-based actions such as restoring forests. Novel technologies that use machines or minerals to lock away carbon only account for around 0.1% of total removals – but have been growing at 40% per year. At the same time, activity behind the scenes is also growing; research funding, trial projects and startups focused on CDR have all increased, and investment in CDR now makes up around 3% of overall investment in climate tech, rebounding last year even as wider climate investment has slowed.

Despite this momentum, the authors warn that today’s CDR system is fragile. In recent years, only about 20% of planned novel CDR capacity has actually been delivered, highlighting how challenging it is to bring new projects forward into operation. Dr Morgan Edwards, Lead Author and Assistant Professor at University of Wisconsin-Madison said, “Growing investment in CDR will depend on expectations of future demand, but those expectations are fragile. Activity is highly concentrated in a small number of countries and approaches. That creates real vulnerability – local changes in policy or market signals risk slowing progress globally”.

The report also makes clear that there is no single solution. It looks at a wide range of ways to remove carbon dioxide from the atmosphere, with estimated costs ranging from under $10 to over $1,000 per tonne of CO₂, with conservative estimates for potentials for most methods around 1 billion tonnes a year. However, uncertainties remain about how much each option can really deliver sustainably and affordably, and how people will react to projects in their regions. Most people know little about CDR, and whether they accept it will depend on its impacts on who shares in the benefits.

The authors identify the time until 2030 as a decisive window. Edwards added, “Novel CDR approaches are growing quickly but need to grow even faster significantly, while proving that they can reliably lock away carbon and provide clear benefits beyond climate, healthier soils or economic opportunities.”

Steve Smith, Smith School of Enterprise and the Environment, University of Oxford, said “The rapid growth of CDR technologies has been notable progress. Many projects are marketing wider environmental benefits and co-products in addition to climate benefits. This partly reflects opportunities for multiple wins, and partly reflects the scarce financial rewards available for the public good of cleaning up CO2 from the air.”

Without faster cuts in emissions and stronger, more predictable demand for high-quality CDR, the gap between where we are and where we need to be will keep widening, making climate targets much harder and more expensive to achieve.

About The State of Carbon Dioxide Removal

The State of Carbon Dioxide Removal (SoCDR) is the first independent global assessment of CDR, convened by experts at the University of Oxford, German Institute for International and Security Affairs, Potsdam Institute for Climate Impact Research, University of Wisconsin—Madison, and University of Maryland. It tracks progress, identifies gaps, and provides clear insights to inform action through evidence. Learn more at www.stateofcdr.org.

Note to Editors: Authors are available for interview, please contact: Neha Soni-Pinto, Communications Lead, neha.soni-pinto@smithschool.ox.ac.uk | +44 7867236630

Defining CDR 

CDR involves capturing CO2 from the atmosphere and storing it durably on land, in the ocean, in geological formations or in products. Examples include reforestation, biochar, bioenergy with carbon capture and storage (BECCS) and direct air carbon capture and storage (DACCS). Some means of storage are longer-lasting and less vulnerable to reversal than others.  

CDR vs CCS 

CDR is not the same thing as carbon capture and storage (CCS). To count as CDR, a method must capture CO2 from the atmosphere. While some CDR methods such as BECCS and DACCS will use the same CO2 transport and storage infrastructure as CCS, CCS usually refers to a set of industrial methods for the capture of CO2 from fossil sources. 

Supplementary comments from authors

Oliver Geden, German Institute for International and Security Affairs (SWP) said “Stabilising global temperature requires bringing CO2 emissions down to net zero, and this is impossible without CDR. Furthermore, once warming exceeds 1.5°C, bringing the global temperature back down will mean removing more carbon dioxide from the atmosphere than we emit, by achieving net-negative emissions to rebalance the global carbon budget.

William Lamb, Potsdam Institute for Climate Impact Research said “Countries have pledged around 2.7 billion tonnes of carbon removal by 2035 and about 3.6 billion by 2050, but climate pathways require much more, especially in the long term. This leaves a gap that grows significantly over time. Most pledges rely on forests and land, with newer technologies playing only a small role. Delays in cutting emissions would make this gap even larger.”

Greg Nemet, La Follette School of Public Affairs at UW Madison, said, “Around $5.7 billion has been committed globally to CDR research and early-stage projects since 2019, and over 40 pilot projects are now underway. But progress on the ground is slower than expected, with only about 20% of planned capacity delivered so far. Recent policy shifts, including the cancellation of more than $3 billion in US projects, show how quickly momentum can stall without stable, long-term support.”

Jan Minx, Potsdam Institute for Climate Impact Research said, “Research in CDR is growing quickly, with publications increasing by around 15% a year in recent years and funding rising fast. But progress is uneven – high-value patenting has declined, especially for technologies like bioenergy with carbon capture storage (BECCS). To meet climate goals, we need stronger and more consistent support for innovation across a wide range of approaches.”

Matthew J. Gidden, Center for Global Sustainability, University of Maryland, said “Every ambitious climate pathway we assessed combines massive emissions cuts with CDR to limit warming well below 2°C. While reducing emissions solves most of the problem, CDR is needed at gigatonne scale to get us to net zero. That means novel and conventional CDR must scale by multiple gigatonnes globally over decades, at rates matching the fastest energy transitions like solar. But real-world delays, uneven global action or climate surprises could demand even more, proactive deployment now is our best hedge against those risks.”

Candelaria Bergero, La Follette School of Public Affairs at UW Madison, said “Every credible climate pathway we looked at includes CDR alongside deep emissions cuts, reaching billions of tonnes per year by mid-century. But these pathways assume immediate policy action – in the real world, delays would mean we need even more CDR, not less.”

Carley Reynolds, Potsdam Institute for Climate Impact Research, said “What we see is a clear and growing mismatch between what countries are aiming for and what’s needed to meet climate goals. Today the gap is relatively small, but by mid-century it becomes very large. That gap widens further if action is delayed, meaning we would have to rely much more heavily on large-scale CDR later on.”

Franklyn Kanyako, La Follette School of Public Affairs at UW Madison, said “Dozens of pilot projects are now up and running, but real-world delivery is still lagging behind expectations. So far, only about 20% of planned capacity has been built, showing how challenging it is to move from announcements to actual projects on the ground.”

Friedemann Gruner, Potsdam Institute for Climate Impact Research, said “CDR methods vary widely in estimated potential and cost, from under 1 billion tonnes a year and below $100 per tonne for some conventional methods, up to tens of billion tonnes and potentially over $1,000 per tonne for some more novel methods. Cheaper methods like reforestation are often associated with cobenefits for nature and food security, but scaling any approach requires managing tradeoffs around land, water and energy use. Across methods, uncertainties about both costs and potentials are high, reflecting the still evolving scientific understanding of the scalability of different methods. We urgently need more research to narrow these uncertainties and guide smart investment.”

Kirsty Harrington, Smith School of Enterprise and the Environment, University of Oxford, said, “Today, around 2.2 billion tonnes of CO are removed each year, almost all of it through forests and land use. Newer novel CDR technologies are growing quickly, but they are still tiny in comparison, about a thousand times smaller. As these approaches scale up, it’s important we carefully measure how much carbon is actually removed to ensure real climate benefits.”

Leona Tenkhoff, German Institute for International and Security Affairs (SWP) said, “More than 100 countries have set net-zero targets, but very few have clear plans for how CDR will be realised and scaled. Most policies focus on funding projects rather than creating real demand, which makes progress uncertain. How CDR grows next will depend on more stable and predictable policy support.”

Sabine Fuss, Potsdam Institute for Climate Impact Research said: "We cannot rely on a single CDR method to close the gap. Conservative estimates for removal potentials from different methods are around 1 billion tons of CO per year. A diverse portfolio of CDR methods, with different approaches tailored for different contexts and geographies, would help to preserve flexibility, reduce costs, and maximise sustainability benefits."

Supplementary comments from other voices in CDR

Aaran Patel, Advisory Board, The State of CDR said, “Cutting across science, policy, perception and practice, the State of CDR is the authoritative voice on the nascent but vital removals sector. Amongst other themes, the third edition brings a greater focus to the potential agronomic co-benefits of removal pathways like biochar and enhanced rock weathering. From boosting soil health and yields to increasing farmer incomes, if done right, these removals could also increase resilience and open new channels of finance for countries like India in the Global South.”


Record damages from wildfires in 2025, despite global area burned among lowest


University of East Anglia


A new analysis of global wildfire activity in 2025 reveals the world experienced some of the most destructive and deadly fire events in recent history, despite the second lowest area burned since 2002.

It highlights a continued trend toward fires becoming increasingly extreme, costly, and disastrous - both economically and in lives lost.

Led by the University of East Anglia (UEA), an international team of scientists has summarised the wildfire events of 2025 for the Year in Review article, published today as part of the Climate Chronicles series in the journal Nature Reviews Earth & Environment.

They found 335 million hectares burned globally in 2025 - 16 per cent below the long-term average - while total fire-related carbon emissions fell to 11 billion tonnes of CO₂, the third lowest year since 2002.

However, a series of “catastrophic” wildfires across Canada, the United States, Europe and South Korea resulted in over 300,000 evacuations and over 90 fatalities, underscoring the rising societal toll of extreme wildfire events.

Financially, 2025 became the costliest year on record for insured wildfire losses globally, with the fires accounting for 38 per cent of all insured natural hazard losses.

The LA fires alone were the fifth most costly natural disaster in history in terms of insured losses, at 40 billion USD, and 140 billion USD in total losses.

Dr Matthew Jones, of the Tyndall Centre for Climate Change Research at UEA, said: “2025 shows that a ‘quiet’ fire year globally can still be devastating. We are seeing a growing disconnect between total area burned and real-world impacts, with risk increasingly determined by fire location, intensity and exposure.

“The wildfires of 2025 demonstrate that without decisive action, societies will continue to face escalating human, economic and environmental risks in an era of more extreme fires.”

The analysis also involved scientists the University of California, Merced, the Met Office Hadley Centre, Universidade de Trás-os-Montes e Alto Douro (Portugal), the Canadian Forest Service, Imperial College London and Kasetsart University (Thailand).

The authors say their findings reinforce the urgent need for rapid reductions in fossil fuel emissions to limit further climate warming, and far stronger adaptation, including proactive vegetation management. Also, resilient infrastructure and evacuation planning suited to a world of increasingly fire-prone landscapes and fast-moving fires.

A new era of wildfire risk

They also suggest the 2025 wildfire season reflects a global shift: as savannah fires decline, extreme and destructive wildfires are increasingly emerging in temperate and high-latitude regions, where fuel-rich forests can burn with unprecedented intensity and climate-driven drought and heatwaves amplify fire weather.

Population growth at the wildland-urban boundary also increases exposure, while firefighting resources are strained as multiple regions face simultaneous emergencies.

Another extreme fire season in North America

The team found that while global emissions declined, Canada’s boreal forests continued to break records, entering a third consecutive year of extreme fire activity.

Between 2023 and 2025, Canadian wildfires released more CO₂ than during the entire preceding 15-year period, driven by persistent burning in carbon-rich forest ecosystems - in 2025, unusually high emissions were centred on the provinces of Saskatchewan, Manitoba and Ontario.

These ecosystems, historically adapted to infrequent fires, are now experiencing unprecedented fire recurrence, raising concerns about long-term carbon loss, ecosystem degradation, and weakened forest recovery.

In January 2025, the Palisades and Eaton fires became the most destructive wildfire event in US history. Fuelled by large stocks of critically dry vegetation and extreme winds, the fires killed 31 people, destroyed nearly 12,000 homes and forced over 150,000 evacuations. They also produced hazardous air pollution affecting 10 million residents.

“Deadly human-caused wildfires in California, Europe, and South Korea in the same year as the extensive consumption of carbon stocks in Canada from lightning-caused fires highlights how rapidly climate change is producing conditions for extreme wildfires to thrive across a range of biomes and seasons,” said Prof Crystal Kolden, of University of California, Merced.

“The co-occurrence of multiple devastating fires is particularly problematic, hampering resource sharing between countries and putting more civilians at risk. Unfortunately, future fire projections show these types of outbreaks will only increase.”

Widespread evacuations in Europe and South Korea

Severe drought and repeated heat extremes drove major wildfire outbreaks across the Mediterranean, leading to 28 confirmed deaths, over 120,000 evacuations, and simultaneous emergency resource requests from six European nations.

Spain experienced its largest burned area since 2002, with more than 350,000 hectares affected by August and eight fatalities. In Portugal, thousands of firefighters battled large fast-moving fires, including the largest wildfire in national history.

Across Greece, Türkiye, and Cyprus, prolonged heatwaves enabled destructive fires that displaced tens of thousands, while France endured its largest fire since 1949.

The UK recorded its highest burned area on record, including its first documented ‘megafire’ in Scotland exceeding 10,000 hectares.

Dr Theodore Keeping, of World Weather Attribution at Imperial College London, said: “Studies clearly show that the hot-dry-windy weather conditions which drove devastating wildfires across Southern Europe have been made much more likely due to human-caused climate change.

“Whilst identifying trends in wildfires on the continent are complicated by shifts in land-use, it's clear that fast spreading, intense wildfire events are becoming more likely as weather extremes increase.”

South Korea experienced its deadliest and largest wildfire outbreak, with 32 deaths, over 37,000 displaced residents and more than 100,000 hectares burned. Extreme winds and unusually high temperatures enabled the fires to spread rapidly through mountainous wildland–urban boundary areas, resulting in significant loss of life and infrastructure.

‘Wildfires in 2025’, Matthew W Jones, John T Abatzoglou, Chantelle Burton, Paulo M Fernandes, Piyush Jain, Theodore Keeping, Veerachai Tanpipat and Crystal A Kolden, is published in Nature Reviews Earth & Environment.

ENDS