It’s possible that I shall make an ass of myself. But in that case one can always get out of it with a little dialectic. I have, of course, so worded my proposition as to be right either way (K.Marx, Letter to F.Engels on the Indian Mutiny)
Ice loss began accelerating in the 1990s, according to a major scientific study.
Greenland and Antarctica have lost 12.5 trillion tonnes of ice since 1979, raising global sea levels by around 3.2 centimetres, according to a major scientific study.
The researchers found that ice loss has accelerated in recent decades, particularly since the 1990s.
Most of the loss is linked to warmer ocean temperatures, which cause glaciers to discharge more ice into the sea.
Ice loss accelerated sharply during the 2010s
The study combines satellite observations covering more than four decades. It extends the record back to 1979 for Antarctica and 1972 for Greenland.
The data shows the ice sheets were relatively stable through the 1970s, 1980s and into the 1990s.
Ice loss then increased, with the strongest acceleration recorded during the 2010s.
“There is a clear trend that the ice sheets are losing more mass and it has been increasing from decade to decade,” says Inès Otosaka, an ice scientist at Northumbria University.
She says the changes were clearly linked to rising air and ocean temperatures.
Related
Warmer oceans drive most of the ice loss
Around 84 per cent of the ice loss is linked to increased ice discharge into the oceans, the researchers found.
Surface processes account for the remaining 16 per cent. Warmer seawater can erode ice from below and around the edges of glaciers, increasing their flow towards the ocean.
In Greenland, the Jakobshavn glacier is retreating by up to 50 metres a day, Otosaka says.
Ice loss is raising sea levels
The ice loss has contributed around 3.2 centimetres to global sea level rise since 1979. Scientists say even small increases can have significant consequences for coastal areas.
For every centimetre of sea level rise, an estimated two to three million more people could face annual coastal flooding.
Ice loss slowed between 2020 and 2023, but researchers say this reflected short-term weather patterns rather than a change in the longer-term trend. They also warn that ice-sheet responses to climate change can take decades. This means ice loss could continue even if global warming were brought under control.
The study was published in the journal Scientific Data.
Thursday, September 17, 2026
Speeding glaciers drive half a century of polar ice loss
The longest satellite record ever assembled shows that Greenland and Antarctica have lost 11.3 trillion tonnes of ice since the 1970s, raising global sea levels by more than 3 centimeters
Credit: Dr Sammie Buzzard (CPOM / Northumbria University)
The longest satellite record ever assembled shows that Greenland and Antarctica have lost 11.3 trillion tonnes of ice since the 1970s, raising global sea levels by more than 3 centimetres – and that most of the loss has come from glaciers flowing faster into the ocean, not from melting at the surface.
An international team of polar scientists has produced the most complete picture of ice loss from Greenland and Antarctica to date. The Ice Sheet Mass Balance Inter-comparison Exercise (IMBIE) Team combined 42 independent satellite surveys, drawing on 27 satellite missions and reaching back to 1972 for Greenland and 1979 for Antarctica using the early Landsat archive.
The findings show the two ice sheets lost 11,309 billion tonnes of ice between 1979 and 2023, pushing global sea levels up by 31.4 millimetres. Greenland accounts for the larger share and Antarctica contributed 13.3 millimetres. Strikingly, 84% of the combined loss was driven by glaciers speeding up and pouring more ice into the ocean, with just 16% due to surface melting. The polar ice sheets are now responsible for around a quarter of all global sea level rise.
The assessment was led by Dr Inès Otosaka and Professor Andrew Shepherd at Northumbria University, and Dr Tyler Sutterley of the University of Washington Applied Physics Laboratory. It is supported by the European Space Agency (ESA) and the US National Aeronautics and Space Administration (NASA) and is published in the journal Scientific Data.
Dr Inès Otosaka, who led the study, said: “By reaching back to the 1970s, we can now see how the ice sheets have changed across half a century. More than four-fifths of the ice lost was discharged into the ocean by faster-flowing glaciers, rather than melted at the surface – which tells us the long-term trend is being driven by the dynamic response of the ice sheets to a warming ocean.”
The record shows ice losses climbing steeply from the 1990s onwards. Greenland, close to balance in the 1970s, saw its rate of loss rise from around 60 billion tonnes a year in the 1980s to 264 billion in the 2010s, a decade marked by repeated extreme summer melt events. Antarctica’s rate rose from around 48 billion tonnes a year in the 1980s to 202 billion in the 2010s, with all of its net loss caused by ocean melting of its outlet glaciers; West Antarctica’s ice discharge, led by Pine Island and Thwaites glaciers, has risen in every decade of the record.
The most recent years (2020–2023) brought a temporary slowdown in ice loss. Record snowfall over East Antarctica have offset some of the continent’s glacier losses elsewhere, while a run of milder Greenland summers roughly halved its surface melting. Scientists caution these are short-term fluctuations against a clear long-term trend, not a reversal of ice loss.
The findings also underline the ice sheets’ central role in future sea level rise. Their response to a warming climate is the single largest source of uncertainty in sea level projections: high-end estimates of global sea level rise by 2150 increase by a factor of 2.6 once the risk of ice-sheet instability is accounted for. A continuous, half-century record of how the ice sheets are behaving is therefore vital to anticipating the risks facing the hundreds of millions of people who live in low-lying coastal areas.
Professor Andrew Shepherd, Head of the School of Geography and Natural Science at Northumbria University and founder of IMBIE, said: “Three centimetres of sea level rise may sound small, but that puts another six to nine million people at risk of coastal flooding and erosion. With the ice sheets set to lose much more ice in the decades ahead, global assessments like IMBIE are vital to protecting communities impacted by climate change.”
Dr Tyler Sutterley, IMBIE co-lead, said: “The added length of the record, the larger pool of participating teams and our improved ability to assess uncertainties make this the most robust assessment of ice sheet mass balance produced so far. Satellites give us continent-wide, year-on-year evidence of what is happening now, and that is exactly what we need to test models and narrow the uncertainties in projections of future sea level rise.”
Dr Diego Fernández, Head of the Science Section at ESA, said: “These findings show the fundamental importance of using satellites to monitor the ice sheets and to evaluate the models used to predict the effects of climate change. Sustaining missions such as CryoSat-2 and the Sentinels, and maintaining the long-term ice-sheet climate data record, is critical for the decades ahead.”
Further information To request an interview with the IMBIE Team, please contact the Northumbria University Press Office at media.communications@northumbria.ac.uk. Dr Inès Otosaka can be reached at ines.otosaka@northumbria.ac.uk.
A media package with the paper, films, animations and photographs is available at https://imbie.org/news/. The paper ‘Mass balance of the Greenland and Antarctic ice sheets from the 1970s to 2023’ by the IMBIE Team is published in Scientific Data. Embargoed until 10:00 London / 05:00 US Eastern on 16th September 2026.
Notes to editors 1. The study is an outcome of the Ice Sheet Mass Balance Inter-comparison Exercise (IMBIE), supported by the ESA Climate Change Initiative, the NASA Cryosphere Program, and the NERC UK Centre for Polar Observation and Modelling.
2. It combined 42 independent estimates – 23 for Greenland and 19 for Antarctica – from satellite altimetry, gravimetry and the input-output method, with regional climate models used to separate surface processes from ice dynamics. Data came from 27 satellite missions, including ESA’s CryoSat-2, the EU’s Sentinels, NASA’s ICESat-2, the NASA / German Aerospace Center GRACE missions, and the early Landsat archive.
3. 360 billion tonnes of ice is equivalent to roughly 1 millimetre of global sea level rise. Between 1979 and 2023 the ice sheets lost a combined 11,309 ± 565 billion tonnes (31.4 ± 1.6 mm); Antarctica lost 4,780 ± 513 billion tonnes (13.3 ± 1.4 mm) and Greenland 6,215 ± 467 billion tonnes since 1972. Ice dynamics accounted for 84% of the combined loss.
4. The dataset extends the previous IMBIE assessment (Otosaka et al., 2023), which reported a combined 21.0 ± 1.9 mm sea level contribution between 1992 and 2020.
Northumbria University
Northumbria University, Newcastle, is a research-intensive university whose Centre for Polar Observation and Modelling leads UK research into how the polar ice sheets are responding to climate change, using satellite observations. www.northumbria.ac.uk
Antarctica
Credit
Professor Alison Banwell (CPOM / Northumbria University)
Antarctica
Credit
Professor Andrew Shepherd (CPOM / Northumbria University).
Sea level contribution data from IMBIE; Ice sheet elevation change from satellite altimetry (Centre for Polar Observation and Modelling). In collaboration with Northumbria University, University Grenoble Alpes, TUD Dresden University of Technology, Jet Propulsion Laboratory, University of Washington APL, University at Buffalo University of Liverpool, University of California Irvine, Technical University of Denmark, NOAA Geophysical Fluid Dynamics Laboratory, Canadian Geodetic Survey, Utrecht University, Université Paris-Saclay, Delft University of Technology, European Space Agency, University of Liège, University College London, Bjerknes Centre for Climate Research, University of Edinburgh, Danish Meteorological Institute, University of Arizona, Alfred Wegener Institute, Aarhus University, NASA Goddard Space Flight Center, Lancaster University, Istituto Nazionale di Geofisica e Vulcanologia, isardSAT, University of Texas at Austin, Seoul National University, University of Bologna, Indian Institute of Science, WSL Institute for Snow and Avalanche Research SLF.
Mass balance of the Greenland and Antarctic ice sheets from the 1970s to 2023
Article Publication Date
16-Sep-2026
Sunday, September 13, 2026
Gulf War Forces Antarctic Expedition Firm to Replace Historic Liner
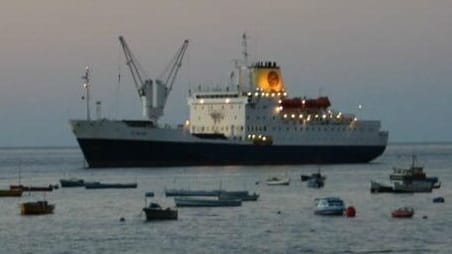
St. Helena transported passengers and cargo till 2018 as the last long-distance RMS vessel and sailing to the remote British outpost in the middle of the South Atlantic (Burgh House photo)
The start-up Terra Nova Expeditions announced this week that it has been forced to change plans for its inaugural expedition cruise season to Antarctica. The company had planned to bring back the historic liner St. Helena for a new career as an expedition ship, but was forced to replace the ship, creating an uncertain future.
St. Helena, built at the Appledore Shipyard in the UK and commissioned in 1990, provided a vital service to the island of the same name located more than 1,100 miles west of Africa and became one of the last RMS (Royal Mail Ships) in service. She is 344 feet (105 meters) in length and approximately 6,800 gross tons. She plods along at 14 knots, but her service primarily between Cape Town and Saint Helena, and continued to Ascension Island, was vital to maintaining a link to the outside world before there was an airport. The introduction of air service was her death knell, and despite the protests of her loyal following, St. Helena was retired in 2018.
The historic ship cheated the scrappers, finding a repurposing. She was briefly used as a vessel-based armory in the Gulf of Oman and later sold to the car racing group Extreme E, which used her as a transport for materials and cars. The company extensively renovated the ship in 2022, retrofitting her engines, updating her systems, and refurbishing her cabins and public spaces.
Terra Nova Expeditions emerged in 2025, saying they had chartered the quirky little ship and were refitting her to commence Antarctic voyages in 2026-2027. The first voyage was planned for December 2026.
The company reported this week that St. Helena is currently unable to reposition from the Persian Gulf in a safe and timely manner for the start of the 2026/2027 Antarctic season due to the ongoing situation in the Middle East. According to her AIS transmissions, the ship, which is currently registered in Djibouti, has been caught in the Dubai area and last reported near Port Rashid in the United Arab Emirates.
Terra Nova Expeditions said it spent several months working to secure an alternate vessel and has been forced to abandon plans for St. Helena and proceed with an alternate ship. It reports it secured a three-year season charter for the vessel that formerly operated as the Expedition and G Expedition, which it will rechristen Terra Nova Adventurer.
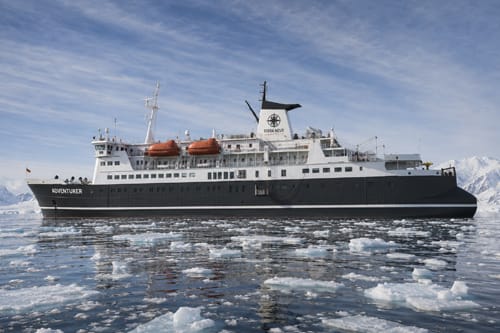
Terra Nova Adventurer will be a suitable replacement but is not the quirky St. Helena (Terra Nova Expeditions)
The replacement ship has a long history as well, and Terra Nova has the advantage of having an extensive history of expedition cruising in Antarctica, the Arctic, and other remote destinations. She had been sailing for the Canadian company G Adventures since being rebuilt for expedition cruising in 2008. The 6,333 gross ton ship started her life as a passenger car ferry in the Baltic, built in 1972. Currently, she appears to be laid up as the Vestland Adventurer, registered in Liberia.
Terra Nova Expeditions says it will undertake a series of enhancements ahead of the vessel’s first season with the company. Alongside new soft furnishings and décor throughout the ship, the project will include the remodeling of the bar and lounge areas and the addition of a Jacuzzi and new sauna on Deck 5. It reports, “The result will combine the vessel’s established expedition credentials with a refreshed onboard experience aligned with Terra Nova Expeditions’ approach to small-ship polar travel.
The company says that its Antarctic itineraries and expedition program will continue as planned aboard Terra Nova Adventurer. Under the charter, the ship will remain with the company through the 2028/29 season.
The fate of the historic St. Helena, however, appears uncertain at best.
Thursday, September 10, 2026
New study raises concerns about climate feedback loop as melting Arctic glaciers flush ancient methane from rocks beneath the ice
The more glaciers melt, the more methane they are likely to release
Meltwater rivers flowing from Svalbard glaciers are carrying ancient methane from rocks beneath the ice into the open air, new research shows.
The findings reveal a natural feedback loop that may worsen as the Arctic continues to get warmer. Melting glaciers can open hidden pathways for methane, a powerful greenhouse gas. Put simply, the more glaciers melt, the more methane they are likely to release.
Methane in the rocks
The study was led by Gabrielle Kleber, a researcher with the iC3 Polar Research Hub in Tromsø, Norway. Her team sampled rivers draining valley glaciers across central Svalbard. They found methane in every river they tested.
The study team took 148 water samples from 19 glacier-fed rivers in central Svalbard, providing by far the most extensive assessment yet of methane in glacier meltwater in the region. Every river in their survey contained more methane than expected from contact with the atmosphere, with the highest values reaching up to 425 times that level.
Co-author Silje Waaler says the team deliberately designed the survey to capture the diversity of glaciers across the region.
“We wanted to study many different glaciers, across a range of rock types and ice conditions. That gave us a clearer picture of why some glacier rivers carry more methane than others,” she says.
A key finding is that this methane is mostly not being made by microbes under the ice, as has been observed beneath glaciers in Greenland.
Instead, it appears to come from Svalbard’s geology. Many parts of the archipelago contain old shale layers rich in organic carbon. Over millions of years, heat and pressure can turn this material into methane and other gases.
They also analysed the carbon in the methane to identify its source. In some samples, they measured related gases, including ethane and propane, which helped confirm that much of the methane came from geological sources.
“These glaciers are mostly melting on their surfaces,” Gabrielle says. “But this meltwater finds its way to the bottom of the glaciers through crevasses and holes. This means that it interacts with the rocks underneath, and where those rocks contain ancient gas, the water can flush methane out into rivers.”
The most methane-rich waters came from glaciers resting on shale-bearing rock formations. But geology alone did not explain everything.
The team also found that the physical state of the glacier bed matters. Glaciers with thawed, wet and active beds were far better at picking up methane. Glaciers frozen to their beds were less connected to the rocks below, even when methane-rich geology was present.
A map of where methane can escape
To understand these processes, the researchers combined river chemistry with ice surveys. They used ground-penetrating radar to map ice conditions within selected glaciers. This allowed them to estimate how much of each glacier bed was thawed and able to carry water.
Co-author Leonard Magerl says that this combination was crucial.
“The temperature at the base of glaciers is an important piece of the puzzle,” Leonard says. “We found that the biggest methane releases happened where the right rocks and the right glacier conditions came together. This insight can help to estimate emissions from other ice-covered regions.”
The researchers estimate that land-terminating glaciers across Svalbard may transport roughly 182 to 368 tonnes of methane per year in meltwater, depending on how the estimate is scaled. This is in addition to previous, much higher estimates for methane released by groundwater springs in front of glaciers. But it still points to a widespread and undercounted pathway for ancient carbon to reach the atmosphere.
Why this matters
Methane is a powerful greenhouse gas. While this study focuses on Svalbard, similar methane-release pathways likely occur in other glaciated regions where ice overlies organic-rich rocks or sediments. These include large parts of the Arctic, the Himalayas and Antarctica.
Gabrielle explains that: “The amounts reported here are small compared with human-caused emissions from fossil fuels, farming and waste. But they matter because they reveal a natural feedback loop that is not confined to Svalbard, and that may grow as the Arctic warms.”
As glaciers thin and retreat, more meltwater may reach their beds. This can increase contact with fractured rock, sediment and groundwater. In some places, that may flush out more methane.
However, the story is not simple. Some Svalbard glaciers are also becoming colder at their beds as they shrink. If a glacier becomes frozen to its bed, its ability to flush methane through subglacial rivers may fall.
“Our results show that future methane release will depend on both geology and glacier change,” Gabrielle says. “That makes it important to know what lies beneath the ice, not only how fast the ice is melting.”
Links to previous research
The new study builds directly on previous iC3 work on methane around retreating Svalbard glaciers. Gabrielle Kleber and Leonard Magerl have previously found that meltwater from one Svalbard glacier could carry geologic methane from beneath the ice, making it release more methane per area than Greenland glaciers. Meanwhile, newly uncovered groundwater springs are also releasing the potent greenhouse gas in Svalbard forefields, demonstrating the many understudied sources of methane in these environments.
The new study, published in Nature Communications today, takes the next step. It shows that methane-rich meltwater is not unique to one glacier. It is widespread across central Svalbard, but strongest where shale-rich geology and thawed glacier beds overlap.
Lead researcher Dr Gabrielle Kleber and co-authors Leonard Magerl and Silje Waaler work at the iC3 Polar Research Hub, which is hosted by the Department of Geosciences of UiT The Arctic University of Norway. Gabrielle studies Arctic methane emissions and glacial hydrology. Leonard works on glacier biogeochemistry and cryosphere processes. Silje studies how material released from glaciers affects downstream ecosystems.
Researcher hiking to the next sampling site on Svalbard
Credit
Gabrielle Kleber
Dr Gabrielle Kleber taking Svalbard water samples
Credit
Erik Mannerfelt
Researcher hiking to the next sampling site on Svalbard
Credit
Gabrielle Kleber
River flowing out of the bottom of a melting Svalbard glacier (IMAGE)