Sunday, March 22, 2020

Credit: CC0 Public Domain
Recent surveys from both the National Household Transportation Survey and the Bureau of Labor Statistics indicate that around 29% of the United States workforce has the option to work at home, and around 15% usually does so.


Working from home pays a double dividend during a pandemic. First, it can help to limit the spread of the highly contagious coronavirus. This supports organizations' efforts to limit travel and major public events, and more assertive efforts by governments in badly affected regions to restrict population movement altogether.
Restricting travel and canceling events have substantial costs at a time when businesses are already dealing with absences due to illnesses. Allowing people to work from home can help cut some of these losses.
There are many  that can be conducted only at a place of work. For example, a dentist can perform a root canal only at an office, a bus driver must drive a bus and a longshoreman must travel to a port.
However, recent advances in , software and networks have made working from home much easier. Now many can conduct all or a portion of their work at home, and the data show that some workers from all occupations and industries work from home at some point during the week. What this means is that even the most physical of industries have some jobs or portions of jobs that can be conducted remotely, even if part-time.
Researchers estimate that at least 50% of the workforce has a job that is compatible with working at home for a portion of the week, such as those in sales, legal, media and military occupations. This workforce could contribute to the economy and limit their exposure to the coronavirus.
The limited uptake of working at home has more to do with managerial resistance than the type of work itself. When organizations come together and government provides the necessary resources, flexible workplace strategies have been successful in helping ease traffic during major events such as the 1984 Los Angeles Olympics and maintaining  during catastrophic weather events such as Snowmageddon in 2010
Provided by The Conversation 
Coronavirus could spark a revolution in working from home. Are we ready?

Coronavirus could spark a revolution in working from home. Are we ready?
A dedicated home office is a key strategy to work from home successfully. Credit: Shutterstock
Imagine your employer asking you to work from home until further notice.
As COVID-19 continues to spread, this seems an increasingly likely scenario. "Everyone who can work from  should work from home," said Harvard epidemiologist William Hanage this week.
In China and neighboring countries, millions are doing so for the first time.
In the United States, companies readying staff to work remotely include TwitterAppleMicrosoftAmazon and JP Morgan.
This week, NASA's Ames Research Center in California joined them and declared a mandatory telework policy after an  tested positive to COVID-19. NASA sites across the country have been testing their work-from-home capabilities.
In Dublin last week, Google sent 8,000 workers home for a day to trial an extended remote-work scenario after one employee came down with flu-like symptoms.
In Australia, Clayton Utz, Cisco and Vodafone temporarily closed offices last week as a precautionary measure.
The likelihood of extended workplace shutdowns seems increasingly likely. So what do we know about the pros and cons of working from home?
How common is working from home?
Perhaps not as common as you might think.
In Australia many companies now offer flexible work arrangements, but that doesn't necessarily mean employees can work from home. Even those permitted to work from home may only be allowed to do so on a limited basis.
As the list of tech companies mentioned may indicate, it is easier to do a job from home if you need only an internet connection and a telephone line.
In building a case for the  in 2010, Australia's Gillard government set a target of 10% of the workforce teleworking half the time. This was up from an estimated 6% of employedAustralians having some form of regular teleworking arrangement.
Consultancy Access Economics predicted this could save A$1.4 billion to A$1.9 billion a year—about A$1.27 billion of that being the time and cost savings of avoided travel.
Teleworking has many benefits
Governments since Gillard's have been less focused on the idea, to the the extent we lack reliable contemporary statistics for telework in Australia.
But with increased commuting times, caring responsibilities and the stress of modern workplaces, the research says most employees highly value being able to work from home. In fact, a 2017 US study found employees valued the option at about 8% of their wages.
Research has also highlighted benefits including increased productivity, rated by both the employees and supervisors. One study showed a 13% increase in performance for employees working from home.
Part of this may be due to an increased ability to focus and less distraction. My research shows employees who can't focus to complete their work are less likely to perform well.
Working from home usually means employees have greater autonomy over how they do their work, including the hours and conditions of their work, and how they manage their lives and other responsibilities. These benefits of teleworking have been shown to lead to greater job satisfactionlower absenteesim and turnover, increased commitment to the organization and, importantly, reductions in stress associated with work.
Work-from-home arrangements may also give organizations access to a greater talent pool.
But there are downsides as well
That said, there are challenges associated with working from home that organizations and individuals often do not plan well for.
Studies have shown working from home for extended periods can leave employees feeling socially and professionally isolated.
When we work from home, we have fewer opportunities to interact and acquire information, which may explain why remote workers can feel less confident than their office-based counterparts.
This reduction in interaction and knowledge sharing is a key barrier to the take-up of working from home.
According to a meta-analysis of 46 studies involving more than 12,000 employees, working from home more than 2.5 days a week could negatively affect relationships with coworkers as well as knowledge transfer.
Further, resentment could arise if teleworking was not widely available.
Employees who work from home have also perceived negative consequences for their career. Out of sight can sometimes be out of mind. Research published last month, however, suggests telecommuters are promoted as much as office-based colleagues.
Another significant issue is maintaining boundaries with home life. It can be hard to switch off, particularly when we don't have a dedicated home office. Telecommuters often work longer hours, with 48% of employees increasing their work hours in one study.
How can we make it work?
organizations can increase the success of working from home. Regular communication, particularly using video conferencing, can help ensure tasks are coordinated, knowledge is transferred, and social and professional isolation is reduced.
For organizations used to managing based on visibility and presence, letting go of traditional ideas of how to manage and focusing on outputs will be required.
If schools are also closed, employers will need to be sensitive to the challenges employees face working from home with children to care for and online schooling to incorporate.
Finally, employees need to establish boundaries between work and home life. Being able to switch off at the end of the day is important for both physical and mental health.
With no end in sight to COVID-19, many businesses are developing or implementing work-from-home policies to ensure business continuity. If employees and employers can get the balance right and enjoy the benefits of well-planned telework, this coronavirus outbreak could prove to be the tipping point for remote work arrangements to become the norm.
This article is republished from The Conversation under a Creative Commons license. Read the original article.The Conversation This article is republished from The Conversation under a Creative Commons license. Read the original article.


Fast reconnection in turbulent media

Fast reconnection in turbulent media
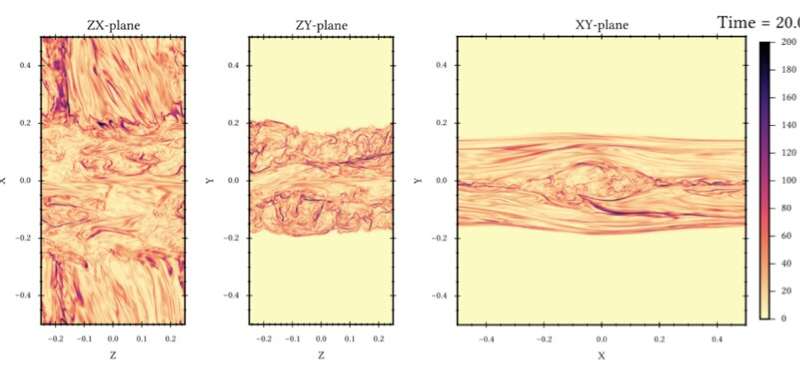
Vorticity of flow in the turbulent reconnection region (X is along the reversing components of magnetic field, Y is perpendicular to the current layer). The measured spectrum corresponds to the expectations of the MHD turbulent theory. No plasmoids is seen for the 3D steady state magnetic reconnection. Credit: Lazarian et al, 2020
Solar flares, similar to many other astrophysical energetic processes, are related to magnetic reconnection. During these events magnetic energy is transferred from other forms of energy, mostly heat and energetic particles. Traditionally, the goal of various models of magnetic reconnection was to explain the rate of this energy transfer. However, the flares are just one of the processes that involve magnetic reconnection. If one imagines any complex motion in a highly conducting medium, the magnetic field, which is assumed to be frozen into the fluid as a result of the famous Alfven (1942) theorem, should create intersections of "knots" that have to arrest the motion of the fluid, unless the magnetic reconnection is fast. Turbulent motions, that are ubiquitous for high Reynolds number astrophysical fluids, present a typical example of such complex fluid motions.
The analytical theory presented in Lazarian & Vishniac (1999, henceforth LV99) testify that 3-D MHD turbulence can make the magnetic reconnection fast, solving problems related both to flares and to explaining the dynamics of turbulent flows. The numerical difficulties associated with the simulations of reconnection within 3-D turbulent flows impeded the progress of testing of the predictions of the turbulent reconnection theory. As a result, models that required only 2-D , i.e. the plasmoid reconnection (Loreiro et al 2007), became widely used and compared with observations. The situation has changed recently as higher resolution numerical simulations became available making testing of 3-D reconnection feasible.
A recent review in Lazarian et al. (2019, henceforth LX19) summarizes the theoretical, numerical and observational progress achieved in the field of 3-D turbulent reconnection. Numerical simulations of the scale 2048x8982x2048 are illustrated in Figure 1. The large scale of the simulations is required to have the outflow thick enough to get it turbulent. Those simulations testify that in 3-D the growth rate of the plasmoid instability is significantly less than of the Kelvin-Hemholtz instability of the outflow. Therefore, in 3-D the magnetic reconnection mediated by plasmoids can be expected only at the initial stage of the reconnection, before the turbulent outflow is formed.
For a given level of turbulence, the numerical simulations show the rate of reconnection that is expected from the LV99 theory. As for flares involving reconnection, they have a natural explanation within the turbulent reconnection model. According to the model, the level of  increases with the level of turbulence. The increase of the matter outflow increases the level of the turbulence and this, in turn, increases further the reconnection rate. This is a runaway process.
One of the most dramatic predictions of the turbulent reconnection theory is the flux freezing violation in turbulent fluids, the effect that was also successfully demonstrated numerically.
The role of the plasma effects is a hotly debated issue in the literature with simulations that account for plasma effects usually showing reconnection rates faster than those in MHD limit. In LX19 theoretical arguments on the decreasing importance of the plasma effects with the increase of the length of the turbulent reconnection region are supported by numerical simulations. The PIC simulations presented in the review provide results that are consistent with those obtained with MHD simulations.
LX19 contains a list of observations that support the turbulent reconnection theory. Those include both solar observations, solar wind measurements, data on the Parker spiral, etc.
Due to the progress of 3-D numerical simulations, the model of turbulent reconnection has demonstrated its validity. The model has a set of predictions that can be tested observationally. Studies of solar reconnection, see Chitta & Lazarian (2019), provide a good way to test the predictions of the turbulent  theory.Mix master: Modeling magnetic reconnection in partially ionized plasma

More information: Based on a recent paper Lazarian et al, Physics of Plasmas, 2020: DOI: doi.org/10.1063/1.5110603

Dams in the upper Mekong River modify nutrient bioavailability downstream

Dams in the upper Mekong River modify nutrient bioavailability downstream
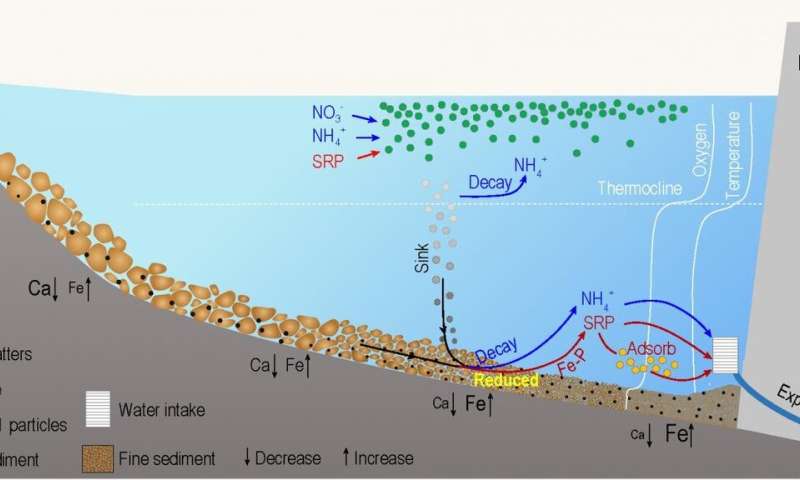
Dams stimulate phytoplankton production and modify nutrient export downstream in the Lancang-Mekong River Credit: Science China Press
The number of hydropower dams has increased dramatically in the last 100 years for energy supply, climate change mitigation, and economic development. However, recent studies have overwhelmingly stressed the negative consequences of dam construction. Notably, it is commonly assumed that reservoirs retain nutrients, and this nutrient reduction significantly reduces primary productivity, fishery catches and food security downstream. Such perception largely hampers electricity supply and even sustainable socio-economic development in many developing regions such as the Congo and lower Mekong basins.
However, solid scientific support for the widespread belief that dams retain nutrients is usually lacking, because monitoring programs gathering data to establish how nutrient fluxes and phytoplankton production have changed after dam construction are rare. A new article by Qiuwen Chen and his research group at Nanjing Hydraulic Research Institute, China, together with Prof. Jef Huisman from the University of Amsterdam and Prof. Stephen C Maberly from UK Centre for Ecology & Hydrology now provides extensive monitoring data for the upper Mekong River. Their data reveal some surprising new insights.
Contrary to expectation, their study shows that a cascade of reservoirs along the upper Mekong River increased downstream bioavailability of nitrogen and phosphorus. The core mechanism is the synergic effect of increased hydraulic residence time and the development of hypoxic conditions due to stratification and organic matter accumulation. The lack of oxygen results in release of nutrients from the sediment and subsequent accumulation of ammonium and phosphorus in the deeper water layers of the , which enhances the concentration of dissolved nutrients released downstream from the base of the reservoirs.
Moreover, the longer residence time in the reservoirs strongly increased phytoplankton production, with a shift in species composition from diatoms upstream to green algae in the downstream reservoirs.
Upstream dams are regularly blamed for nutrient retention and consequently the collapse of primary productivity and fisheries, and even human rights of subsistence in the lower Mekong River. This work implies that the fishery decline in the lower Mekong River might be caused by other factors such as over-fishing, habitat modification, disruption of fish migration by dam construction or water quality deterioration from local sources, rather than a reduction in nutrient availability or primary productivity induced by the cascade dams upstream.
This novel perspective on the globally important issue emphasizes the need for dedicated monitoring of the environmental impacts of hydropower dams on nutrient cycling and primary production. The findings are of great significance not only for science, but also for sustainable social- along the Mekong River and other transboundary rivers worldwide.
Thais spike China-led plan to dredge Mekong river

More information: Qiuwen Chen et al, Hydropower reservoirs on the upper Mekong River modify nutrient bioavailability downstream, National Science Review (2020). DOI: 10.1093/nsr/nwaa026

COVID-19 Edition - LabourNEWS Mar. 20, 2020

LabourNEWSAFL
During this time of a global health pandemic, we want to stay in touch and share our continued work with you. Below you will find releases from the AFL, as well as, resources to help navigate supports being made available.

News

Labour's Response Plan for Alberta

This week, Premier Kenney rammed through a budget that will result in job losses and further cuts. We are facing a global health pandemic while also suffering from a massive drop in the price of oil. At a time like this, Albertans need our government to step up with support, not step on us with austerity. Yesterday, Alberta labour leaders unanimously supported an 8-point response plan for during this crisis. Taken together, we think our suggestions will help us "flatten the curve" of infection; fortify our health care system; and ward off the collapse of our economy.
See Labour's response and proposed approach here.

Lack of Surge Capacity

As we watch communities around the globe grapple with COVID-19's effects on their health care systems, questions arise about whether Alberta is prepared to handle this health crisis. We are raising the alarm that we do not have adequate resources in place for a surge of patients and we are calling on Premier Kenney to immediately act to address capacity by opening more acute care and intensive care hospital beds.
Read our release on a lack in surge capacity here.

Kenney Must Provide Paid Sick Leave

Albertans need certainty and support during the pandemic caused by COVID-19. If we want Albertans to follow the advice of public health officials and stay home when their sick, they need to know that they will still be paid. Since the beginning of the COVID-19 pandemic, we have been publicly demanding just that. Last week, Premier Kenney recognized this issue and announced that he would provide Albertans with paid sick leave, BUT unfortunately, this week, he backtracked and announced he would ensure workers have access to unpaid sick leave. We think that the Premier misleading Albertans during a crisis is unacceptable.
The Premier needs to act now to fix this, which is why it's an important part of labour's 8-point response plan.

Resources


Take Action

Follow Us Online

Please follow us on Facebook and Twitter for more regular updates as issues unfold. We encourage you to share relevant information with your networks.

Alberta Federation of Labour
10408 124 St, #300, Edmonton, AB T5N 1R5, Canada

Can the coronavirus really live for 3 days on plastic? Yes, but it's complicated.

cardboard box
Credit: CC0 Public Domain
For more than a week, people have been sharing an eyebrow-raising report that the novel coronavirus can live for 24 hours on cardboard, and up to three days on plastic and stainless steel. 
It can, but the details are more complicated, according to scientists who published the research behind those figures on Tuesday. The short version: Levels of the  drop dramatically within a few hours, the authors wrote in the New England Journal of Medicine.
The key is what scientists refer to as a virus' half-life, or rate of decay: how much time it takes for half the microbes in a given sample to die.
When the scientists placed virus-laden droplets on plastic, they found that half of the virus was gone after about seven hours. Half of what remained was gone after another seven hours, and so on. By the end of Day Two, there was less than 1/100 of the original amount, and after three days the remnants were barely detectable.
For , the half-life for the virus was five or six hours, and for cardboard it was even shorter: less than four hours.
The surface on which the virus had the shortest duration was copper, which has long been known for its antimicrobial properties. When droplets were placed on the reddish metal, half of the virus died off within 45 minutes.
So what matters is how much virus is there to begin with, said Princeton University researcher Dylan H. Morris, one of the study authors. The more viruses deposited on a surface, the greater the amount that will be left when half of them have decayed.
Why the  and most other viruses have no cureHad researchers used bigger or more droplets, they would have detected some viruses remaining on plastic after more than three days, in theory.
"The absolute time until virus is undetectable depends upon how much virus you initially put there," said Morris, a Ph.D candidate in ecology and evolutionary biology.
The findings should offer some reassurance to those concerned about touching their mail, said Gregory A. Poland, a vaccine researcher at the Mayo Clinic in Rochester, Minn., who was not involved with the study.
Generally, the smaller the exposure to a virus, the less likely it will develop into a full-blown infection, Poland told Minnesota Public Radio on a call-in show broadcast nationally Wednesday. And when a virus is exposed to sunlight and , as might be likely with mail, it is likely to decay even faster than what the scientists found in their indoor experiment, he said.
"The fact that you could identify a virus on a surface does not mean it is necessarily infectious," he said.
Still, it can't hurt to wash your hands after taking groceries out of the bag, opening a newly delivered envelope, or retrieving the newspaper. Soap and water does the job.
Morris and his fellow researchers also compared the viability of the new coronavirus on various surfaces with that of a different kind of coronavirus—the one that caused the SARS epidemic from 2002 to 2003. The results were similar, though the SARS virus decayed more quickly than the new virus did on cardboard.
The research team, which also included members from National Institutes of Health, the U.S. Centers for Disease Control and Prevention, and UCLA, plans a more comprehensive follow-up study: analyzing the hardiness of the new coronavirus at varying levels of temperature and humidity, as well as comparing it with the flu.
The goal of the first paper was speed, given the rapid growth of the outbreak, Morris said.
"For this paper, we wanted to just move as fast as we could while still getting reliable data," Morris said. "We knew people needed to know this for things like hospital and environmental safety models."
Earthquakes Can Teach Us About Disaster and Resilience
Journalist Jon Mooallem’s new book, ‘This is Chance!’, revives a decades-old story about an Alaskan radio journalist and the biggest earthquake you’ve never heard of—and gives us something to consider when the world is unsteady

Katherine Cusumano
Mar 22, 2020
Along the southern shoreline of Alaska, underneath the Aleutian Trench in the Pacific Ocean, two tectonic plates converge. One presses beneath the other at an annual rate of about two and a half inches, causing a moderate earthquake about once a year. But at 5:36 P.M. on March 27, 1964—Good Friday—the plates slipped dramatically, setting off a violent quake that rippled across the state for nearly five minutes—long enough, according to journalist Jon Mooallem, “for some people to question if it would ever stop.” The great Alaskan quake, as it later became known, hit a record-setting 9.2 on the Richter scale. It remains the largest earthquake ever recorded in North America and the second-largest recorded worldwide.

In Anchorage, just 75 miles away from the earthquake’s epicenter, a main road cracked in half, and the wealthy enclave of Turnagain slipped almost entirely into the sea. Power lines went down. And very little information entered or exited the region until Anchorage’s local radio station, using backup generators, burst back onto the air.

One of its local reporters, Genie Chance, was in her car with her son when the quake struck. After it subsided, and after she got a glimpse of the scale of destruction, she only stopped to drop him safely at home before rushing back into the field to start reporting. “For the next thirty hours,” she recalled later, “I talked constantly.” She quickly emerged as the voice of Anchorage in the wake of the earthquake, dispatching critical updates to listeners across the region. (This included her own relatives: “The Chance family is alright,” she told her parents over the air.) Her programming was picked up by other Alaskan radio stations, then nationally; she later won numerous journalism awards for her disaster coverage. But history soon forgot about the earthquake and the female reporter who covered it best. Chance died in 1998.Small business owners clear salvagable items and equipment from their earthquake-ravaged stores on Fourth Avenue in Anchorage, Alaska, in the aftermath of the 1964 earthquake. (Photo: Unknown/AP)

Decades later, Chance is at the center of Mooallem’s new book, This Is Chance!, which will be published March 24. The veteran journalist first learned about the great Alaskan quake when he spotted black and white photographs of the wreckage from tsunamis caused by the earthquake on the wall of a diner in Crescent City, California. His interest piqued, Mooallem later spent years poring over contemporaneous interviews, news accounts, and scientific research, including a report Chance produced for the U.S. Geological Survey, trying to piece together a cohesive account of that weekend. “No one had written this story before,” Mooallem told me recently.

Before long, Chance herself became the beating heart of the story he wanted to tell. Perhaps intuiting that her records might one day be of historical significance, Chance had sent reel-to-reel tapes of her broadcasts to the University of Alaska, where Mooallem found and listened to them decades later. Her daughter, Jan, also had a separate trove of recordings. As Mooallem writes it, Chance underwent a transformation from a working mom and frontier-town journalist (a typical story of hers might have been on sled-dog races) to the most indispensable voice of a city thrust into disaster. “I was just really moved by the role that a radio person could play in that situation,” Mooallem says, “because that role fundamentally connects other people.”

Mooallem tried to interview as many survivors of the great Alaskan quake as possible, traveling across Juneau, Sitka, Anchorage, and rural Washington State to speak with them. Many people who had lived in Anchorage in 1964 are scattered now, getting old, with their memories failing or already gone. The bulk of his research was archival—he spent a lot of time in the Newark, Delaware, archives of the Disaster Research Center—and Mooallem, who usually reports on more contemporary stories, found the gulf between himself and his subjects strange. “It layered the whole experience with this weird feeling of dislocation, that I couldn’t quite connect with those people,” he says.

Decades of hindsight add nuance to an otherwise straightforward narrative about disaster and recovery, allowing Mooallem to examine social issues that accounts at that time did not. He writes, for example, of the sexism Chance confronted at the radio station, the “persistent, backhanded disbelief that a woman could work so hard and proficiently during a crisis.” When she asked for a raise, she was told she “was already making the highest salary ‘for a woman’”—she wrote later that the station only employed her to begin with “because I worked hard and cheap.” Chance faced similar sexism in her later work in Alaska’s state legislature and endured an abusive, alcoholic husband at home.

Mooallem addresses the “overt racism” some Anchorage residents directed toward Native Alaskans immediately following the earthquake, a “shameful exception” to the narrative of harmony and inclusivity that the city wanted to tell about itself during the crisis. He describes a tense standoff between journalists from the lower 48 who arrived to cover the quake and the Eskimo Scouts, a contingent of the Alaskan National Guard made up of Native Alaskans, who were tasked with securing that area for everyone’s safety. The journalists, hoping to get as close as possible to the disaster zone, soon became antagonistic; one called the Natives “little soldiers” to belittle them.
Genie Chance is the subject of Mooallem’s new book This Is Chance!, which will be published March 24. (Photo: Courtesy Random House)

At its core, This Is Chance! succeeds at creating the first contemporary history of how Anchorage responded to the unexpected crisis, and it paints a picture of a community coming together in the face of tragedy. It seems to offer a blueprint for us now: a possible route forward, when previously unthinkable environmental and political catastrophes seem to have become a daily occurrence.

Earthquakes, by their nature, disrupt something we take for granted as stable: the solid ground beneath our feet. Though that experience provokes a queasy, vertiginous fascination and tons of press coverage, “then, somehow, life stitches back together and you move on,” Mooallem says. “I really wanted to spend time seeing what happens afterward instead of just looking away.”

What he found, when he peered into the void the earthquake ripped open, was encouraging. Sociologists with the Disaster Research Center touched down in Anchorage just a few hours after it ended to study the city’s response. Despite prevailing fears about mass hysteria and stampeding crowds, what they witnessed seemed to demonstrate that people are inclined toward goodness. “Many of us have enjoyed—actually, taken a great deal of pride in—seeing the way the people of Anchorage can rise to the occasion,” Chance said shortly after the earthquake. It supported then controversial social-science theories, which have since been borne out by decades of research, that disasters might actually bring out the best in people.

“I don’t think we have a real way to talk about what happens next in those situations,” Mooallem says, echoing an observation in Rebecca Solnit’s A Paradise Built in Hell, a compilation of case studies about how communities respond to catastrophe. “We lack the language for that aspect of our existence, the language we need to describe what happens during disaster,” Solnit writes, describing the compassionate human response that arises in the wake of a catastrophe. “And yet the experience happens anyway.”

Mooallem argues that Chance, for one, provided the language, that her live-broadcast coverage became “not an antidote to that unpredictability, exactly, but at least a strategy for withstanding it.” In moments of chaos and upheaval, strong narratives can make sense of what previously seemed senseless. “The disaster had no narrator,” he writes. That is, until Genie Chance got back on the air.

---30---

2019: The Year Fracking Earthquakes Turned Deadly

The first fracking-induced earthquake to claim human lives shows why magnitude may underestimate the danger such earthquakes pose.


Image credits:Inked Pixels/Shutterstock

Friday, February 21, 2020 - Nala Rogers, Staff Writer

(Inside Science) -- On Feb. 25, 2019, an earthquake shook the village of Gaoshan in China's Sichuan Province, leaving 12 people injured and two dead. New research indicates the earthquake and its two foreshocks were likely triggered by hydraulic fracturing, also called fracking. If this is true, it would mark the first time in history that a fracking-induced earthquake has killed people.

The study shows why magnitude, the most common way of reporting earthquake size, could lead people to underestimate the true threat fracking-induced earthquakes might pose. The Feb. 25 earthquake was only a magnitude 4.9, which would not traditionally be considered very dangerous. But it was able to destroy older and more vulnerable buildings because it was so close to the surface -- only about one kilometer deep according to the new study. That's shallow even by fracking standards, but fracking-induced earthquakes do tend to be much shallower than natural ones.

"The shallower it is, then for the same magnitude of earthquake, the stronger the shaking," said Hongfeng Yang, a seismologist at the Chinese University of Hong Kong and senior author of the study. The findings are not yet published, but Yang and graduate student Pengcheng Zhou presented them last December at a meeting of the American Geophysical Union in San Francisco.
How it happened

Fracking involves drilling wells in shale deposits, then pumping in water and other additives at high pressure to break the rock and release trapped oil. In some regions fracking can trigger earthquakes by causing faults in the rock to slip. The slipping happens either because fluids seep into the fault itself, or because the weight or volume of the fluid presses against the fault indirectly, said Thomas Eyre, a seismologist at the University of Calgary in Canada.

Most fracking operations in North America don't cause earthquakes, and the earthquakes that do occur have generally been small. Some media reports have attributed damaging earthquakes in Oklahoma to fracking, but experts believe most of those earthquakes were caused by wastewater that oil and gas developers disposed of by injecting it deep underground. Some of the wastewater included fluids used during the fracking process, but most of it came from ancient underground aquifers, according to Mike Brudzinski, a seismologist at Miami University in Oxford, Ohio. The oil beneath Oklahoma is naturally mixed with large volumes of water, and developers must filter out the water before they can sell the oil.

Western Canada has experienced a few moderate-sized fracking earthquakes with magnitudes up to about 4.5, but they mostly occurred in remote locations far from major human settlements. And even in western Canada, only about one in 300 fracking operations causes earthquakes large enough for a person to feel, said Eyre.

"In North America at the moment, we haven't had any hydraulic fracturing-induced earthquakes that have actually caused any damage," said Eyre.

It's a different story in China, however. Several recent studies have shown that the fracking boom that began in about 2014 is triggering destructive earthquakes in formerly tranquil parts of China's Sichuan basin. For example, a magnitude 4.7 earthquake on Jan. 28, 2017, a magnitude 5.7 on Dec. 16, 2018, and a magnitude 5.3 on Jan. 3, 2019 were all caused by fracking, according to published research. The 2018 earthquake injured 17 people and damaged more than 390 houses, nine of which collapsed.

The deadly February 2019 event included a magnitude 4.9 main shock and two smaller foreshocks of magnitudes of 4.7 and 4.3. Using seismic sensors and satellite data, Yang, Zhou and their colleagues found that the foreshocks occurred on a previously unknown fault located within half a kilometer of a fracking well. The foreshocks were between 2.5 and 3 km underground, the same depth where fracking is typically conducted in this region. The main shock struck about eight hours later, on a different, shallower fault a short distance away. The findings suggest that the first two earthquakes and the fluid pumped during fracking may have combined to change the pressures in the rock, causing the second fault to slip.

"It looks to me like some very solid research," wrote Art McGarr, a seismologist with the U.S. Geological Survey in Menlo Park, California, in an email, after reviewing a digital copy of the researchers' poster. McGarr has studied induced earthquakes extensively, and was one of the researchers who conducted a recent paper attributing prior Sichuan Basin earthquakes to fracking.
Shallow depth increases danger

The magnitude 4.9 earthquake last February damaged buildings in Gaoshan in part because the buildings were old and not designed for earthquake safety, said Yang. The location was densely populated and didn't have a history of dangerous earthquakes, so it was highly vulnerable.

But even so, the earthquake would have been less damaging had it occurred 5 to 20 km underground, as most natural earthquakes do, according to Brudzinski. Instead, it occurred about a kilometer underground, with hardly any rock to absorb the shock before it reached the surface. Most fracking-related earthquakes are less than 5 km deep.

"We always pin everything on the magnitude, so that can be kind of misleading," said Pradeep Talwani, a geophysicist at the University of South Carolina in Columbia. According to Talwani, people in Gaoshan probably felt more shaking from the shallow magnitude 4.9 quake than someone in Seattle would feel from a natural magnitude 6.5 earthquake that struck deep beneath their feet.

Magnitude is a measure of the total amount of energy released during an earthquake, and researchers estimate it by calculating the surface area of a fault and the distance it has slipped, said Brudzinski. What actually matters to a person on the surface is how much the ground they're standing on shakes and how that affects structures around them -- a concept known as intensity, which researchers estimate using a variety of scales. Intensity depends in part on the earthquake's magnitude, but also on its depth, lateral distance away, and the types of rock and soil in the area.

"Right now, most regulations are still based on the magnitude. But there's a recognition now, a growing recognition, that the true risk is related to what kind of structures are there, what kind of soil they're built on, how shallow those earthquakes might be," said Brudzinski.
Deadly earthquakes continue

After the Feb. 25 earthquake that killed two people in Gaoshan, the local government halted fracking, said Yang. But in surrounding parts of the Sichuan Basin, fracking continues. According to online reports by the China Earthquake Administration, several more damaging earthquakes struck the region later in 2019:

• A magnitude 6.0 on June 17 in Changning County that killed at least 13 people and injured 220

• A magnitude 5.4 on Sept. 8 in Weiyuan County that killed one person and injured 63

• A magnitude 5.2 on Dec. 18 in Zizhong County that injured at least nine

Yang, Zhou and their colleagues have not yet analyzed these earthquakes, and according to Zhou, it is not yet clear whether they were fracking-induced. The Chinese government has denied that the June 17 earthquake that killed 13 people was caused by fracking, according to reporting by Reuters. A recent study suggested it may have been triggered by a combination of salt mining and a previous fracking-induced quake.

Despite multiple attempts over several weeks, Inside Science has been unable to obtain comment from anyone affiliated with the China Earthquake Administration regarding either the earthquakes in 2017, 2018 and early 2019 or the more recent ones that haven't yet been analyzed in detailed studies. The administration has reported greater depths for Sichuan Province earthquakes than would be expected if they were caused by fracking. However, those numbers don't match up with the shallow depth estimates from detailed studies, including Yang and Zhou's research and several published studies that included China Earthquake Administration researchers as authors.

Yang said he wasn't surprised that the depth estimates differ. He explained that the China Earthquake Administration's online reports use estimates that are generated automatically using a network of stationary seismic sensors and a general-purpose model. He claimed that his own study and other studies that have pinpointed shallower depths are much more accurate. That's because they use additional data sources and models that are customized for specific locations, he said.

It's unlikely that any of the earthquakes highlighted in this story occurred naturally, according to McGarr. The northeastern edge of the Sichuan basin has long been prone to earthquakes because it is bordered by a large, active fault. But the fracking is happening further to the south and east, where natural earthquakes are rare.

"It used to be a very stable region," said Yang.

Researchers in the U.S. are taking note. No fracking-induced earthquakes in North America have exceeded magnitude 5 so far, and they may still be unlikely to do so, given differences in the local geology, said Brudzinski. But most are quite shallow, only about 2-4 km belowground.

In the past, said Brudzinski, researchers have debated whether there might be something about the fracking process itself that keeps earthquakes small, ensuring some measure of safety despite the shallow depth. The recent tragedies in China suggest that people shouldn't depend on that as a safeguard.

"To me, that has been sort of the most important aspect of what I've seen from China," said Brudzinski. "It suggests that, yes: We can have some larger-size events."

Editor’s Note: Yuen Yiu contributed additional reporting to this story.


Nala Rogers is a staff writer and editor at Inside Science, where she covers the Earth and Creature beats. She has a bachelor’s degree in biology from the University of Utah and a graduate certificate in science communication from U.C. Santa Cruz. Before joining Inside Science, she wrote for diverse outlets including Science, Nature, the San Jose Mercury News, and Scientific American. In her spare time she likes to explore wilderness.

Earthquakes in India at three-year high in 2019
SPECIAL CORRESPONDENT NEW DELHI MARCH 05, 2020
A girder of the under-construction Jehangir Chowk-Rambagh flyover slipped off pillars near Aloochibagh due to the earthquake that shook Kashmir in Srinagar on January 31, 2018.A girder of the under-construction Jehangir Chowk-Rambagh flyover slipped off pillars near Aloochibagh due to the earthquake that shook Kashmir in Srinagar on January 31, 2018.


A girder of the under-construction Jehangir Chowk-Rambagh flyover slipped off pillars near Aloochibagh due to the earthquake that shook Kashmir in Srinagar on January 31, 2018. | Photo Credit: NISSAR AHMAD


The Indian subcontinent has suffered some of the deadliest earthquakes globally, with more than 60% of its land area prone to shaking of intensity VII and above

A total of 768 earthquakes of magnitude 3.0 and above were located by the National Seismological Network from 2017 to January 31, 2020 according to a response to a question in the Rajya Sabha this week.

There were 226 earthquakes in 2017, 203 in 2018, and 309 earthquakes in 2019. Earthquakes of magnitude 4 and above nearly doubled from 78 in 2018 to 159 in 2019, the response from the Union Earth Sciences Ministry revealed.

India has been grouped into four seismic zones, that is, Zone II, III, IV and V. Zone V is considered to be the most seismically active, while Zone II is the least so.

The Indian subcontinent has suffered some of the deadliest earthquakes globally, with more than 60% of its land area prone to shaking of intensity VII and above on the Modified Mercalli Intensity scale.

Extremely vulnerable

The Himalayan belt is particularly susceptible to earthquakes exceeding 8.0 magnitude, with Jammu and Kashmir considered extremely vulnerable. The Indian plate consists of India and Pakistan and the vast Eurasian tectonic plates that comprise Europe, Russia and most of the Middle East. The Himalayas are a result of the collision of these plates, and because the Indian plate moves northwards into the Eurasian plate a few centimetres every year, this has led to a build-up of a lot of strain, that scientists say, has not been adequately released. A study published in the journal Nature Communications, in 2019, says that moderate earthquakes, that is less than 7 magnitude, may in fact be adding strain and priming the region for a massive quake greater than 8.5 magnitude. Though such a quake is imminent, scientists are not able to say when such a quake is likely.
Active faults

There are over 66 active faults in India, with the Himalayan belt, extending for 2,400 km, itself dissected by 15 major active faults. The Indo-Gangetic and Brahmaputra Plains have 16 tectonically active faults, while Peninsular India is marked with around 30 neo-tectonic faults.

Earthquakes disrupt sperm whales' ability to find food, study finds

Earthquakes disrupt sperm whales' ability to find food, study finds
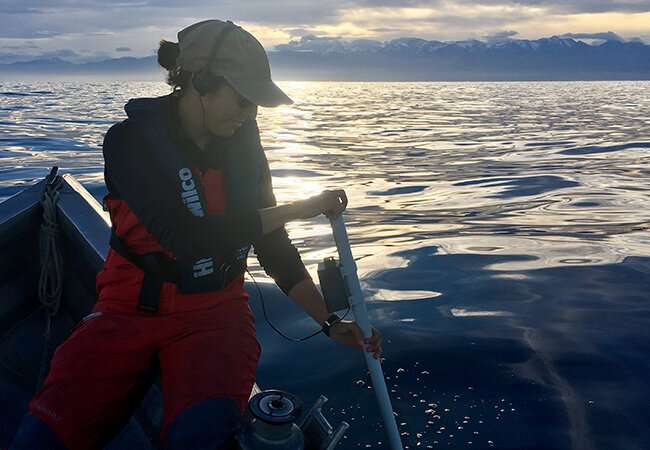
Dr Marta Guerra tracking sperm whales. Credit: Marine Mammal Research Lab, University of Otago.
Otago scientists studying sperm whales off the coast of Kaikōura have discovered earthquakes affect their ability to find food for at least a year.
The University of Otago-led research is the first to examine the impact of a large  on a population of marine mammals, and offers new insight into how top predators such as  react and adapt to a large-scale natural disturbance.
Changes in habitat use by a deep-diving predator in response to a coastal earthquake, has recently been published in Deep Sea Research Part I.
Earthquakes and aftershocks can affect sperm whales in several ways, the study explains.
The whales depend on sound for communication, detection of prey and navigation and are also highly sensitive to noise.
Earthquakes produce among the loudest underwater sounds which can induce injuries, hearing damage, displacement and behavioural modifications.
While earthquakes and other extreme natural events are rare occurrences, they can really shift the state of ecosystems by wiping out animals and plants, lead author and Marine Sciences Teaching Fellow Dr. Marta Guerra says.
"Understanding how wild populations respond to earthquakes helps us figure out their level of resilience, and whether we need to adjust management of these populations while they are more vulnerable."
The fatal 7.8 magnitude Kaikōura earthquake on November 14, 2016 produced strong ground shaking which triggered widespread underwater mudslides in the underwater canyon off the coastline.
This caused what's known as 'canyon flushing', which in the case of the Kaikōura earthquake, involved high-energy currents flushing 850 tonnes of sediment from the underwater canyon into the ocean.
The Kaikōura canyon is an important year-round foraging ground for sperm whales, which have an important ecological role as top predators and are a key attraction for the local tourism industry—the main driver of the town's economy.
Just why the canyon is important to sperm whales is "a piece of the puzzle we are still trying to nut out", says Dr. Guerra.
"But it's likely related to the immense productivity of the canyon's seabed, and a combination of how the currents interact with the steep topography of the submarine canyon."
Scientists examined data collected on the behaviour of 54 sperm whales between January 2014 and January 2018—a timeframe which allowed an opportunity to determine any significant changes in pre and post-earthquake whale foraging behaviour.
Earthquakes disrupt sperm whales' ability to find food, study finds
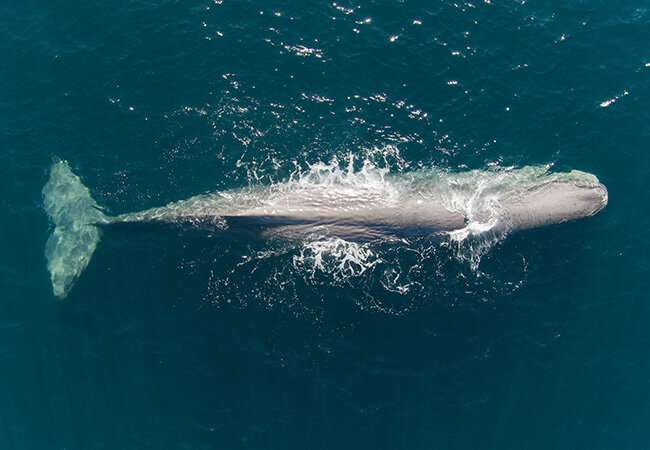
Male sperm whale Tiaki (guardian). Credit: Marine Mammal Lab, University of Otago
"We really didn't know what to expect, as there is so little known about how  react to earthquakes," Dr. Guerra says.
The researchers found clear changes in the whales' behaviour in the year following the earthquake: most noticeably whales spent about 25 per cent more time at the surface—which potentially meant they needed to spend more effort searching for prey, either by diving deeper or for longer times
There are two main reasons the whales may have expanded their search effort, the study explains.
Firstly, benthic invertebrate communities which lived in the upper canyon may have been removed by the canyon flushing event, resulting in sparser prey and reduced foraging abilities.
Secondly, sediment deposition and erosion may have required sperm whales to 're-familiarise' with a modified habitat, increasing the effort to navigate and locate prey whose location may have changed.
"The flushing of almost 40,000 tonnes of biomass from the canyon's seabed probably meant that the animals that normally fed on the seabed had a short supply of food, possibly moving away," Dr. Guerra says.
"This would have indirectly affected the prey of sperm whales (deep-water fish and squid), becoming scarce and making it harder for the whales to find food."
Scientists were particularly surprised by how clear the changes were, especially in terms of where the sperm whales were feeding.
"The head of the Kaikōura canyon, where we used to frequently find sperm whales foraging, was quiet as a desert," Dr. Guerra says.
Although earthquakes happen relatively frequently in areas where marine mammals live, this study was the first to document the impact on a population, thanks to a long-term monitoring programme which has been in place since 1990.
Globally, there have been punctual observations, such as a fin whale displaying an 'escape response' after an earthquake on the Gulf of California, or particularly low sightings of humpback whales coinciding with the months following an earthquake off Alaska, Dr. Guerra says.
"Deep-sea systems are so out of sight that we rarely consider the consequences of them being disturbed, whether by natural of human impacts.
"I think our results emphasise how far-reaching the impacts to the sea bed can be, affecting even animals at the top of the food chain such as  whales."
The study found the ' behavioural changes lasted about a year after the 2016 earthquake and returned to normal levels in the summer of 2017-18.
Dr. Guerra believes this study also highlights the importance of long-term monitoring of marine wildlife and ecosystems, without which scientists wouldn't be able to detect changes that occur after marine mammals are exposed to disturbance.Origin of ambergris verified through DNA analyses

More information: M. Guerra et al, Changes in habitat use by a deep-diving predator in response to a coastal earthquake, Deep Sea Research Part I: Oceanographic Research Papers (2020). DOI: 10.1016/j.dsr.2020.103226

How earthquakes deform gravity

How earthquakes deform gravity
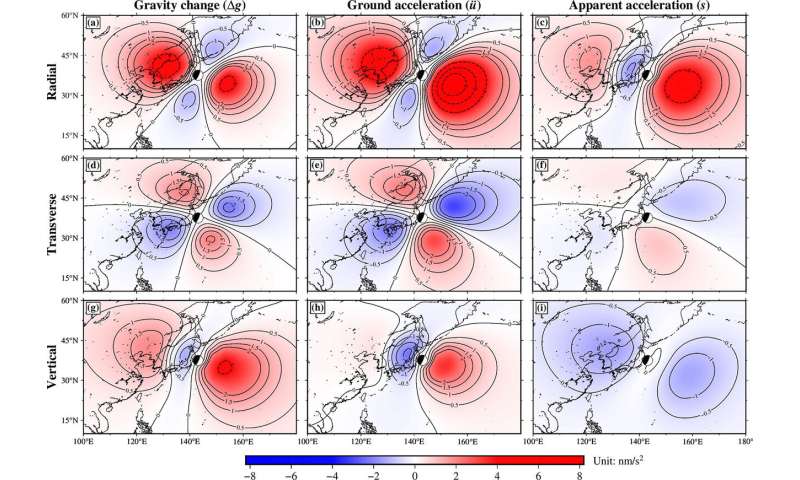
Spatial distribution of PEGS signal strength during the Tohoku quake in 2011, shortly before the arrival of the primary seismic wave. Credit: Earth and Planetary Science Letters, Vol 536, Zhang et al. 2020, „Prompt elasto-gravity signals (PEGS) and their potential use in modern seismology",sciencedirect.com/journal/earth-and-planetary-science-letters, with permission from Elsevier
Lightning—one, two, three—and thunder. For centuries, people have estimated the distance of a thunderstorm from the time between lightning and thunder. The greater the time gap between the two signals, the further away the observer is from the location of the lightning. This is because lightning propagates at the speed of light with almost no time delay, while thunder propagates at the much slower speed of sound of around 340 metres per second.
Earthquakes also send out signals that propagate at the  (300,000 kilometers per second) and can be recorded long before the relatively slow seismic waves (about 8 kilometers per second). However, the signals that travel at the speed of light are not lightning bolts, but sudden changes in  caused by a shift in the earth's internal mass. Only recently, these so-called PEGS signals (PEGS = prompt elasto-gravity signals) were detected by seismic measurements. With the help of these signals, it might be possible to detect an  very early before the arrival of the destructive earthquake or tsunami waves.
However, the gravitational effect of this phenomenon is very small. It amounts to less than one billionth of the earth's gravity. Therefore, PEGS signals could only be recorded for the strongest earthquakes. In addition, the process of their generation is complex: they are not only generated directly at the source of the earthquake, but also continuously as the earthquake waves propagate through the earth's interior.
Until now, there has been no direct and exact method to reliably simulate the generation of PEGS signals in the computer. The algorithm now proposed by the GFZ researchers around Rongjiang Wang can calculate PEGS signals with high accuracy and without much effort for the first time. The researchers were also able to show that the signals allow conclusions to be drawn about the strength, duration and mechanism of very . The study was published in the journal Earth and Planetary Science Letters.
An earthquake shifts the rock slabs in the earth's interior abruptly, and thus changes the  in the earth. In strong earthquakes, this displacement can amount to several meters. "Since the gravity that can be measured locally depends on the mass distribution in the vicinity of the measuring point, every earthquake generates a small but immediate change in gravity," says Rongjiang Wang, scientific coordinator of the new study.
However, every earthquake also generates waves in the earth itself, which in turn change the density of the rocks and thus the gravitation a little bit for a short time—the earth's gravity oscillates to some extent in sync with the earthquake. Furthermore, this oscillating gravity produces a short-term force effect on the rock, which in turn triggers secondary seismic waves. Some of these gravitationally triggered secondary seismic waves can be observed even before the arrival of the primary seismic waves.
"We faced the problem of integrating these multiple interactions to make more accurate estimates and predictions about the strength of the signals," says Torsten Dahm, head of the section Physics of Earthquakes and Volcanoes at GFZ. "Rongjiang Wang had the ingenious idea of adapting an algorithm we had developed earlier to the PEGS problem—and succeeded."
"We first applied our new algorithm to the Tohoku quake off Japan in 2011, which was also the cause of the Fukushima tsunami," says Sebastian Heimann, program developer and data analyst at GFZ. "There, measurements on the strength of the PEGS signal were already available. The consistency was perfect. This gave us certainty for the prediction of other earthquakes and the potential of the signals for new applications."
In the future, by evaluating the changes in gravity many hundreds of kilometres away from the epicentre of an earthquake off the coast, this method could be used to determine, even during the earthquake itself, whether a strong earthquake is involved that could trigger a tsunami, according to the researchers. "However, there is still a long way to go," says Rongjiang Wang. "Today's measuring instruments are not yet sensitive enough, and the environmentally induced interference signals are too great for the PEGS signals to be directly integrated into a functioning tsunami early warning system."
New early signals to quantify the magnitude of strong earthquakes

More information: Shenjian Zhang et al, Prompt elasto-gravity signals (PEGS) and their potential use in modern seismology, Earth and Planetary Science Letters (2020). DOI: 10.1016/j.epsl.2020.116150