Wednesday, April 01, 2020

Scary red or icky green? We can't say what color coronavirus is and dressing it up might feed fears

by Simon Weaving, The Conversation
Credit: Shutterstock

Images of the latest coronavirus have become instantly recognizable, often vibrantly colored and floating in an opaque background. In most representations, the shape of the virus is the same—a spherical particle with spikes, resembling an alien invader.


But there's little consensus about the color: images of the virus come in red, orange, blue, yellow, steely or soft green, white with red spikes, red with blue spikes and many colors in between.

In their depictions of the virus, designers, illustrators and communicators are making some highly creative and evocative decisions.

Color, light and fear

For some, the lack of consensus about the appearance of viruses confirms fears and increases anxiety. On March 8 2020, the director-general of the World Health Organisation warned of the "infodemic" of misinformation about the coronavirus, urging communicators to use "facts not fear" to battle the flood of rumors and myths.

The confusion about the color of coronavirus starts with the failure to understand the nature of color in the sub-microscopic world.

Our perception of color is dependent on the presence of light. White light from the sun is a combination of all the wavelengths of visible light—from violet at one end of the spectrum to red at the other.

When white light hits an object, we see its color thanks to the light that is reflected by that object towards our eyes. Raspberries and rubies appear red because they absorb most light but reflect the red wavelength.
An artist’s impression of the pandemic virus. Credit: 
Fusion Medical Animation/Unsplash, CC BY

But as objects become smaller, light is no longer an effective tool for seeing. Viruses are so small that, until the 1930s, one of their scientifically recognized properties was their invisibility. Looking for them with a microscope using light is like trying to find an ant in a football stadium at night using a large searchlight: the scale difference between object and tool is too great.


It wasn't until the development of the electron microscope in the 1930s that researchers could "see" a virus. By using electrons, which are vastly smaller than light particles, it became possible to identify the shapes, structures and textures of viruses. But as no light is involved in this form of seeing, there is no color. Images of viruses reveal a monochrome world of gray. Like electrons, atoms and quarks, viruses exist in a realm where color has no meaning.

Vivid imagery

Grey images of unfamiliar blobs don't make for persuasive or emotive media content.
A colorised scanning electron micrograph image of a VERO E6 cell (blue) heavily infected with SARS-COV-2 virus particles (orange), isolated from a patient sample. Credit: NIAID/Flickr, CC BY

Research into the representation of the Ebola virus outbreak in 1995 revealed the image of choice was not the worm-like virus but teams of Western medical experts working in African villages in hermetically sealed suits. The early visual representation of the AIDS virus focused on the emaciated bodies of those with the resulting disease, often younger men.

With symptoms similar to the common cold and initial death rates highest amongst the elderly, the coronavirus pandemic provides no such dramatic visual material. To fill this void, the vivid range of colorful images of the coronavirus have strong appeal.

Many images come from stock photo suppliers, typically photorealistic artists' impressions rather than images from electron microscopes.

The Public Health Library of the US government's Centre for Disease Control (CDC) provides one such illustration, created to reveal the morphology of the coronavirus. It's an off-white sphere with yellow protein particles attached and red spikes emerging from the surface, creating the distinctive "corona" or crown. All of these color choices are creative decisions.
The CDC illustration reveals ‘ultrastructural morphology’ exhibited by coronaviruses.
Credit: CDC/Alissa Eckert, MS; Dan Higgins/MAMS

Biologist David Goodsell takes artistic interpretation a step further, using watercolor painting to depict viruses at the cellular level.

One of the complicating challenges for virus visualisation is the emergence of so-called "color" images from electron microscopes. Using a methodology that was originally described as "painting," scientists are able to add color to structures in the grey-scale world of imaging to help distinguish the details of cellular micro-architecture. Yet even here, the choice of color is arbitrary, as shown in a number of colored images of the coronavirus made available on Flickr by the National Institute of Allergy and Infectious Diseases (NIAID). In these, the virus has been variously colored yellow, orange, magenta and blue.
A composite of images created by NIAID. Colours have been attributed by scientists but these are arbitrary. Credit: NIAID/Flickr, CC BY

Embracing grey

Whilst these images look aesthetically striking, the arbitrary nature of their coloring does little to solve WHO's concerns about the insecurity that comes with unclear facts about viruses and disease.
Some artists’ impressions include blood platelet images. Credit: Shutterstock

One solution would be to embrace the colorless sub-microscopic world that viruses inhabit and accept their greyness.

This has some distinct advantages: firstly, it fits the science that color can't be attributed where light doesn't reach. Secondly, it renders images of the virus less threatening: without their red spikes or green bodies they seem less like hostile invaders from a science fiction fantasy. And the idea of greyness also fits the scientific notion that viruses are suspended somewhere between the dead and the living.

Stripping the coronavirus of the distracting vibrancy of vivid color—and seeing it consistently as an inert grey particle—could help reduce community fear and better allow us to continue the enormous collective task of managing its biological and social impact

Provided by The Conversation This article is republished from The Conversation under a Creative Commons license. Read the original article.

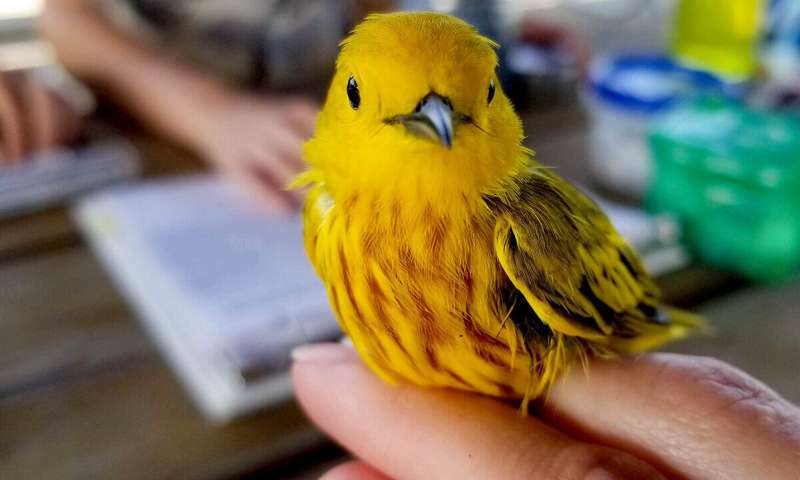
When warblers warn of cowbirds, blackbirds get the message

When warblers warn of cowbirds, blackbirds get the message
Yellow warblers have evolved a special "seet" call that warns 
other warblers when cowbirds are nearby. Credit: Shelby Lawson
This is the story of three bird species and how they interact. The brown-headed cowbird plays the role of outlaw: It lays its eggs in other birds' nests and lets them raise its young—often at the expense of the host's nestlings. To combat this threat, yellow warblers have developed a special "seet" call that means, "Look out! Cowbird!"
In a new study, researchers at the University of Illinois at Urbana-Champaign report that red-winged blackbirds respond to the seet call as if they know what it means.
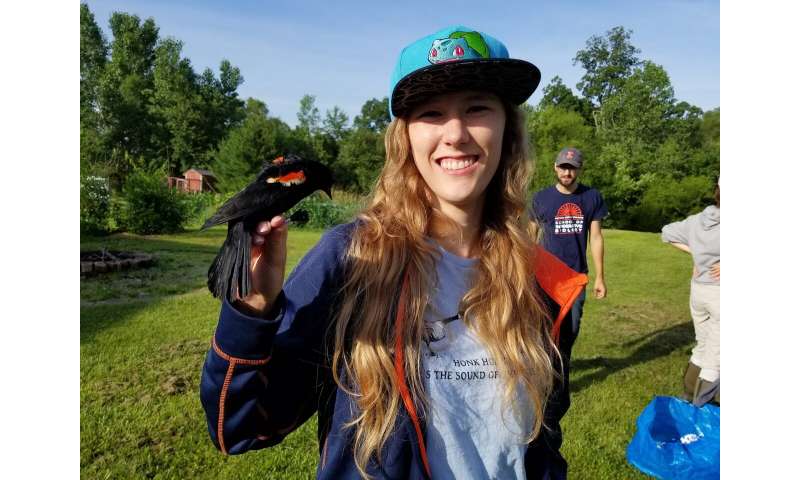
"Does this mean red-winged blackbirds understand that the call is specific to cowbirds or are they just responding to a general alarm?" said graduate student Shelby Lawson, who led the study with Mark Hauber, a professor of evolution, ecology and behavior at the U. of I. The researchers sought to answer that question by playing back the calls of several  in warbler and blackbird territories to see how the birds reacted.
They report their findings in the journal Communications Biology.
"We know that eavesdropping on the calls of other species is common across the animal kingdom," Lawson said. "Birds do it. Mammals do it. There are studies of different primates that do it—and even birds that listen in when they do."
In the rainforests of Ivory Coast, for example, tropical birds known as hornbills have deciphered some of the calls of the Diana monkey. The hornbills ignore the monkeys' alarm calls for ground predators, which are no threat to the birds, but heed the monkeys' calls for hawks, which are predators of hornbills.
"Chickadees have very general alarm calls that we now know signal the size of different predators," Lawson said. "A lot of birds will listen to these calls and respond based on the danger posed to them. There's also a study of nuthatches listening to chickadee calls."
But all these studies look at  directed at predators that can kill adult animals, Lawson said.
"Yellow warblers are the only bird we know about that has developed a specific call for a brood parasite," she said. "When they see a brown-headed cowbird, yellow warblers will make the seet call and then females that hear the call will go back to their nest and sit on it tightly to protect their eggs. They only do this with cowbirds. They don't seet at predators or anything else."
In an earlier study, Lawson and her colleagues were playing audio of seet calls to study warbler behavior when they noticed that red-winged blackbirds were also responding aggressively to the calls. This prompted the new study.
To learn what the red-winged blackbirds understood about the calls, the researchers played a variety of bird calls in red-wing and yellow warbler territories and watched how the birds responded. They found that the red-winged blackbirds responded identically to the seet calls, the sound of cowbird chatter and blue jay calls—all of which signal a threat to their nests.
When warblers warn of cowbirds, blackbirds get the message
University of Illinois graduate student Shelby Lawson studies the interactions of red-winged blackbirds, cowbirds and yellow warblers. Credit: Shelby Lawson
"They responded very aggressively to these calls, more so than they did to the  'chip' call, which is just a general antipredator call," Lawson said. When red-wings heard the warblers seeting, they flew close to the loudspeaker and looked around for the threat, she said.
When red-winged blackbirds see any kind of  in their territory, they swoop at it and dive bomb it. Male red-wings have so many mates in so many nests that they must defend a wide territory from interlopers and threats, Lawson said. This is why red-winged blackbirds are known as the "knights of the prairie."
In defending their own nests from predators, they end up helping out other bird species—in particular, yellow warblers. Previous research shows that yellow warblers that nest near red-winged blackbirds suffer less from cowbirds laying their eggs in their nests.
The warblers also appear to help the blackbirds by warning of nest predators, the researchers said.
When warblers warn of cowbirds, blackbirds get the message
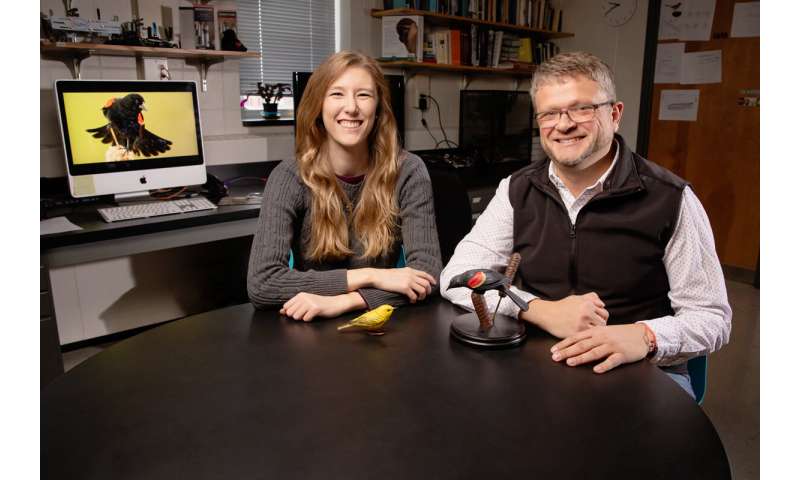
Mark Hauber, right, a U. of I. professor of evolution, ecology and behavior; graduate student Shelby Lawson and their colleagues discovered that red-winged blackbirds eavesdrop on yellow warblers when the warblers warn of cowbirds near their nests. Credit: L. Brian Stauffer
"We found that the red-winged blackbirds that nest really close to the warblers respond more strongly to the seet calls than those that nest far away," Lawson said.
The researchers have more work to do to determine whether the blackbirds understand that the seet call means "cowbird," specifically, or if it is just interpreted as a general danger to the nest. In a future study, the researchers will play the seet call to re-wings at the end of the nesting season to see if the blackbirds respond as aggressively to the sound after their eggs have hatched. Yellow warblers stop making the seet call when their nestlings are secure and too old to be bothered by cowbirds.
"This is the first report of a bird eavesdropping on another species' warning of a brood parasite," Hauber said. "We don't yet know if the red-winged  understand that the warning is specific to cowbirds, but it's obvious they understand that the call represents a threat to the —and that benefits them."Red-winged blackbird nestlings go silent when predators are near

More information: "Heterospecific eavesdropping on an anti-parasitic referential alarm call" Communications Biology (2020). DOI: 10.1038/s42003-020-0875-7
Journal information: Communications Biology 

Soy scaffolds: Breakthrough in cultivated meat production

Researchers from the Technion-Israel Institute of Technology and Aleph Farms have achieved a breakthrough in the production of cultivated meat grown outside an animal's body. In findings published today in Nature Food, soy protein, which is readily available and economically efficient, can be used as scaffolds for growing bovine tissue.
The innovative technology, whereby  is grown on scaffolds made of soy protein, was spearheaded by Professor Shulamit Levenberg, dean of Technion's Faculty of Biomedical Engineering, over the past few decades. The technology was originally intended for medical applications, in particular for  engineering for transplants in humans.
There are several incentives for developing cultured . These include  caused by the meat-production industry, increased use of antibiotics that accelerates the growth of drug-resistant bacteria, ethical reservations about the suffering of animals during the meat production process, and the industry's detrimental ecological impact due to the intensive use of natural resources.
Aleph Farms is the first company to successfully grow slaughter-free steaks, using original technology developed by Prof. Levenberg and her team. Prof. Levenberg is the company's founding partner and chief scientist, and the current research was supervised by doctoral student Tom Ben-Arye and Dr. Yulia Shandalov.
The article in Nature Food presents an innovative process for growing cultured meat tissue in only three-to-four weeks that resembles the texture and taste of beef. The process is inspired by nature, meaning that the cells grow in a controlled setting similar to the way they would grow inside a cow's body.
The cells grow on a scaffold that replaces the extracellular matrix (ECM) found in animals. Since this is a food product, the scaffold must be edible, and therefore only edible alternatives were considered. Soy protein was selected as the  on which the cells adhere and proliferate with the help of myogenesis-related growth factors, similarly to the tissue engineering technology developed by Prof. Levenberg.
Soy protein, an inexpensive byproduct obtained during the production of soy oil, is readily available and rich in protein. It is a porous material, and its structure promotes cell and tissue growth. Soy protein's tiny holes are suitable for cell adherence, division, and proliferation. It also has larger holes that transmit oxygen and nutrients essential for building muscle tissue. Furthermore, soy  scaffolds for growing cultured meat can be produced in different sizes and shapes, as required.
The cultured meat in this research underwent testing that confirmed its resemblance to slaughtered steak in texture and taste. According to Prof. Levenberg, "We expect that in the future it will be possible to also use other vegetable proteins to build the scaffolds. However, the current research using  is important in proving the feasibility of producing meat from several types of  on plant-based platforms, which increases its similarity to conventional bovine meat."
More information: Tom Ben-Arye et al. Textured soy protein scaffolds enable the generation of three-dimensional bovine skeletal muscle tissue for cell-based meat, Nature Food (2020). DOI: 10.1038/s43016-020-0046-5
Mystery solved: The origin of the colors in the first color photographs
by CNRS 
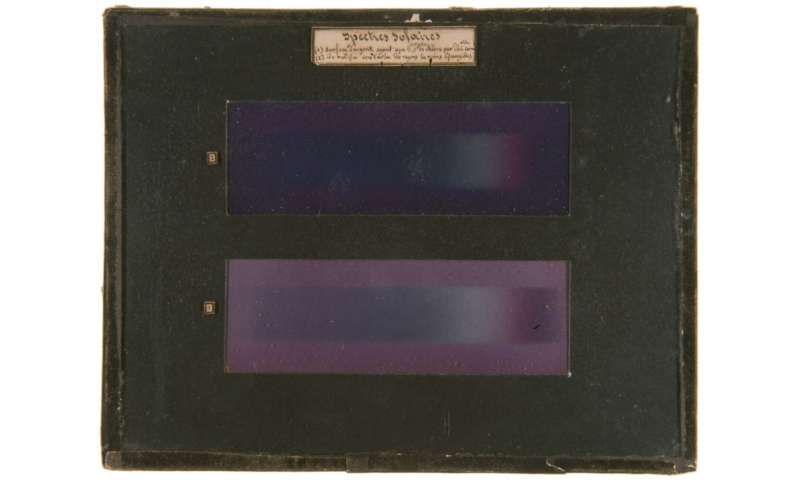
Edmond Becquerel, Solar spectra, 1848, photochromatic images, Musée Nicéphore Niépce, Chalon-sur-Saône.

 A palette of colors on a silver plate: That is what the world's first color photograph looks like.

 It was taken by French physicist Edmond Becquerel in 1848. His process was empirical, never explained, and quickly abandoned. 

Now, a team at the Centre de recherche sur la conservation (CNRS/Muséum National d'Histoire Naturelle/Ministère de la Culture), in collaboration with the SOLEIL synchrotron and the Laboratoire de Physique des Solides (CNRS/Université Paris-Saclay), reports that the colors obtained by Edmond Becquerel were due to the presence of metallic silver nanoparticles. 

Their study was published on 30 March 2020 in Angewandte Chemie International Edition.
In 1848, in the Muséum d'Histoire Naturelle in Paris, Edmond Becquerel managed to produce a color photograph of the solar spectrum. These photographs, which he called "photochromatic images," are considered to be the world's first color photographs. Few of these have survived because they are light-sensitive and because very few were produced in the first place. It took the introduction of other processes for color photography to become popular in society.

For more than 170 years, the nature of these colors has been debated in the scientific community, without resolution. Now we know the answer, thanks to a team at the Centre de recherche sur la conservation (CNRS/Muséum National d'Histoire Naturelle/Ministère de la Culture) in collaboration with the SOLEIL synchrotron and the Laboratoire de Physique des Solides (CNRS/Université Paris-Saclay). 

After having reproduced Edmond Becquerel's process to make samples of different colors, the team started by re-examining 19th-century hypotheses using 21st century tools. If the colors were due to pigments formed during the reaction with light, there should have been variations in chemical composition from one color to another, which no spectroscopy method has shown. If they were the result of interference, like the shades of some butterflies, the colored surface should have shown regular microstructures about the size of the wavelength of the color in question. Yet no periodic structure was observed using electron microscopy.

However, when the colored plates were examined, metallic silver nanoparticles were revealed in the matrix made of silver chloride grains—and the distributions of sizes and locations of these nanoparticles vary according to color. 

The scientists assume that according to the light's color (and therefore its energy), the nanoparticles present in the sensitized plate reorganize: Some fragment and others coalesce. The new configuration gives the material the ability to absorb all colors of light, with the exception of the color that caused it, thereby producing the color that we see. 

Nanoparticles having properties related to color are known as surface plasmons, electron vibrations (here, those of the metallic silver nanoparticles) that propagate in the material. A spectrometer in an electron microscope measured the energies of these vibrations to confirm this hypothesis.


More information: Victor de Seauve et al, Spectroscopies and electron microscopies unravel the origin of the first colour photographs, Angewandte Chemie (2020). DOI: 10.1002/ange.202001241

Replication and study of the colouration of Edmond Becquerel's photochromatic images, Victor de Seauve, Marie-Angélique Languille, Saskia Vanpeene, Christine Andraud, Chantal Garnier, Bertrand Lavédrine, Journal of Cultural Heritage, 2020 (in press). arxiv.org/abs/2001.05250

Mesoamerican copper smelting technology aided colonial weaponry

Mesoamerican copper smelting technology aided colonial weaponry
This hearth from one of the Mesoamerican smelting furnaces, seen as it was being excavated by Dorothy Hosler and her team in Mexico, was among the sites that revealed that indigenous people were producing copper for the Spanish colonists. Credit: Dorothy Hosler
When Spanish invaders arrived in the Americas, they were generally able to subjugate the local peoples thanks, in part, to their superior weaponry and technology. But archeological evidence indicates that, in at least one crucial respect, the Spaniards were quite dependent on an older Indigenous technology in parts of Mesoamerica (today's Mexico, Guatemala, Belize, and Honduras).
The invaders needed  for their artillery, as well as for coins, kettles, and pans, but they lacked the knowledge and skills to produce the metal. Even Spain at that time had not produced the metal domestically for centuries, relying on imports from central Europe. In Mesoamerica they had to depend on local smelters, furnace builders, and miners to produce the essential material. Those , in turn, were able to bargain for exemption from the taxes levied on the other Indigenous people.
This dependence continued for at least a century, and perhaps as long as two centuries or more, according to new findings published in the journal Latin American Antiquity, in a paper by Dorothy Hosler, professor of archeology and ancient technology at MIT, and Johan Garcia Zaidua, a researcher at the University of Porto, in Portugal.
The research, at the site of El Manchón, in Mexico, made use of information gleaned from more than four centuries worth of archeological features and artifacts excavated by Hosler and her crew over multiple years of fieldwork, as well as from lab work and historical archives in Portugal, Spain, and Mexico analyzed by Garcia.
El Manchón, a large and remote settlement, initially displayed no evidence of Spanish presence. The site consisted of three steep sectors, two of which displayed long house foundations, some with interior rooms and religious sanctuaries, patios, and a configuration that was conceptually Mesoamerican but unrelated to any known ethnic groups such as the Aztec. In between the two was an area that contained mounds of slag (the nonmetallic material that separates out during smelting from the pure metal, which floats to the surface).
The Spanish invaders urgently needed enormous quantities of copper and tin to make the bronze for their cannons and other armaments, Hosler says, and this is documented in the historical and archival records. But "they didn't know how to smelt," she says, whereas  suggest the Indigenous people had already been smelting copper at this settlement for several hundred years, mostly to make ritual or ceremonial materials such as bells and amulets. These artisans were highly skilled, and in Guerrero and elsewhere had been producing complex alloys including copper-silver, copper-arsenic, and copper-tin for hundreds of years, working on a small scale using blowpipes and crucibles to smelt the copper and other ores.
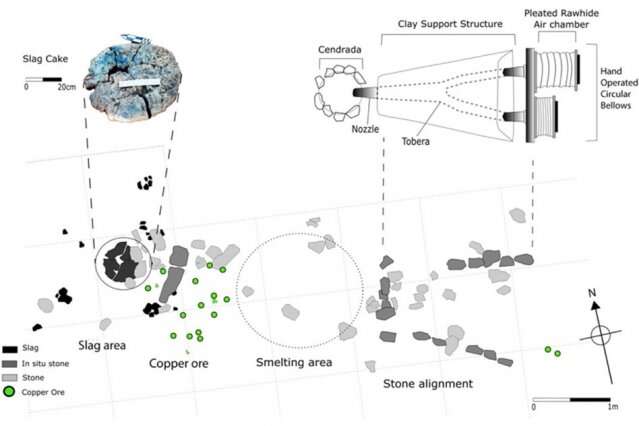
But the Spanish desperately required large quantities of copper and tin, and in consultation with Indigenous smelters introduced some European technology into the process. Hosler and her colleagues excavated an enigmatic feature that consisted of two parallel courses of stones leading toward a large cake of slag in the smelting area. They identified this as the remains of a thus-far-undocumented hybrid type of closed furnace design, powered by a modified hand-held European bellows. A small regional museum in highland Guerrero illustrates just such a hybrid furnace design, including the modified European-introduced bellows system, capable of producing large volumes of copper. But no actual remains of such furnaces had previously been found.
Mesoamerican copper smelting technology aided colonial weaponry
Diagram shows the excavation site of one of the indigenous smelting furnaces, adapted to use European-style bellows instead of blowpipes. Callouts at top show a large chunk of slag, the material left over from smelting, and a drawing of the reconstructed design of the furnace. Credit: Dorothy Hosler
The period when this site was occupied spanned from about 1240 to 1680, Hosler says, and may have extended to both earlier and later times.
The Guerrero site, which Hosler excavated over four field seasons before work had to be suspended because of local drug cartel activity, contains large heaps of copper slag, built up over centuries of intensive use. But it took a combination of the physical evidence, analysis of the ore and slags, the archaeological feature in the the smelting area, the archival work, and reconstruction drawing to enable identification of the centuries of interdependence of the two populations in this remote outpost.
Earlier studies of the composition of the slag at the site, by Hosler and some of her students, revealed that it had formed at a temperature of 1150 degrees Celsius, which could not have been achieved with just the blowpipe system and would have required bellows. That helps to confirm the continued operation of the site long into the colonial period, Hosler says.
Years of work went into trying to find ways to date the different deposits of slag at the site. The team also tried archaeomagnetic data but found that the method was not effective for the materials in that particular region of Mexico. But the written historical record proved key to making sense of the wide range of dates, which reflected centuries of use of the site.
Documents sent back to Spain in the early colonial period described the availability of the locally produced copper, and the colonists' successful tests of using it to cast bronze artillery pieces. Documents also described the bargains made by the Indigenous producers to gain economic privileges for their people, based on their specialized metallurgical knowledge.
"We know from documents that the Europeans figured out that the only way they could smelt copper was to collaborate with the Indigenous people who were already doing it," Hosler says. "They had to cut deals with the Indigenous smelters."
Hosler says that "what's so interesting to me is that we were able to use traditional archeological methods and data from materials analysis as well as ethnographic data" from the furnace in a museum in the area, "and historical and archival material from 16th century archives in Portugal, Spain, and Mexico, then to put all the data from these distinct disciplines together into an explanation that is absolutely solid."Maize, not metal, key to native settlements' history in NY

More information: Johan García Zaldúa et al. Copper Smelting at the Archaeological Site of El Manchón, Guerrero: From Indigenous Practice to Colonial-Scale Production, Latin American Antiquity (2020). DOI: 10.1017/laq.2019.105
How the layouts, or textures, of cities influence extreme weather events

by Andrew Logan, Massachusetts Institute of Technology
Researchers at the MIT Concrete Sustainability Hub are studying the connections between urban layouts and hazard losses. Credit: NASA

If you've ever turned down a city street only to be blasted with air, you've stepped into what is known as an urban canyon.


Much like their geological counterparts, urban canyons are gaps between two tall surfaces—in this case, buildings. The gusts they channel, however, have real implications. They can magnify a hurricane's winds or increase a city's air temperature depending on their arrangement—an arrangement known as city texture. The problem is, according to researchers at the MIT Concrete Sustainability Hub (CSHub), that current hazard mitigation practices don't consider city texture. Consequently, they frequently underestimate damages, in some cases by as much as a factor of three.

Reconsidering current practices

To understand the potential impact of city texture, CSHub researchers first investigated the current construction practices. One of the practices they examined were building codes.

According to the Federal Emergency Management Agency, "Building codes are sets of regulations governing the design, construction, alteration, and maintenance of structures." One of their purposes is to protect the inhabitants of a building from natural disasters by specifying the strength of that building.

To keep buildings safe from wind hazards, codes stipulate how a building must interact with the wind, a value known as a drag coefficient. The drag coefficient of a building determines the amount of air resistance it will experience when exposed to the wind. As a building's drag coefficient increases, so does its likelihood of damage.

"Design codes assume that buildings have fixed drag coefficients. And in a way, that makes sense—the shape of a building doesn't change much," says Jake Roxon, a researcher at CSHub. "However, we've found that it's not just the shape of the building that affects its drag coefficient, but also the local configuration of adjacent buildings, which we refer to as urban texture."

Urban texture measures the probability of finding a neighboring building at a certain distance away from a given building. Roxon calculates it by drawing rings of a certain diameter around each building in a city. Then he counts the number of buildings in each ring.


The more buildings in each ring, the greater the probability is of finding a building at that distance. And the higher the probability, the more ordered and regular the local texture is, while the lower the probability, the more disordered and unpredictable. To capture a whole city's texture, Roxon averages together the texture of each of its buildings.

"On average, we have found that areas with disordered textures have more resilience," says Roxon. "If you are unable to predict which angle the wind will come from, it will offer the greatest level of protection. On the other hand, for an ordered city with the same density of buildings, you would expect to see more damage during an extreme hazard event."

The reason behind the resilience of disordered streets is how they distribute wind. By distributing wind more randomly, disordered cities like Boston or Paris experience less of the magnification that occurs as the wind travels the corridors of ordered cities, such as New York. In some cases, cities with more ordered textures can magnify hurricane winds from a Category 3 to a Category 4, Roxon has found.

The impact of city texture on drag coefficients and wind loads appeared prominently during Hurricane Irma in 2017, which passed through West Florida.

"An example of the texture effect is Sarasota and Lee counties in Florida during Irma," explains Ipek Bensu Manav, a CSHub researcher collaborating with Roxon. "Those counties are situated close to each other geographically, so they experience a similar hurricane risk. And when you look at the building stocks, they are also similar—mostly single and two-floor single-family houses."

However, the two counties differed in terms of texture.

"Sarasota County has a less-ordered texture, falling less onto a typical grid, and Lee County has a more orderly texture," says Manav. "When looking at Lee County we saw more structural damage—some buildings collapsed completely. There were more flooding and overturning of vegetation as well. So, Irma caused a lot more damage in the county that had a higher texture effect."

It turns out, too, that ordered textures have a similar effect on heat.

"We have found this to be the case with temperature as well—specifically, the urban heat island effect," says Roxon. "Ordered cities experience the greatest temperature difference between them and their rural surroundings at night."

Code cracking

So, then, if layouts of streets greatly influence hazard damage, why don't building codes account for them?
Credit: Massachusetts Institute of Technology

Simply put, it's currently too difficult to incorporate them.

Right now, the standard tool for investigating the drag coefficients of a building is computational fluid dynamics (CFD). CFD simulations measure the drag coefficient of a building and its hazard risk by modeling the flow of heat and wind. Though highly accurate, CFD simulations demand prohibitively intense time and computing requirements at scale.

"Using current resources, CFD simulations simply don't work on the scale of cities," says Roxon. "New York City, for example, has over 1 million buildings. Running a simulation would take a long time. And if you make just one small adjustment to the arrangement of buildings or the direction of the wind, you have to rerun the simulation."

Despite their imperfections, CFD simulations remain an important tool for understanding wind flow. But Roxon believes his city texture model can compensate for CFD's limitations and, in the process, make cities more resilient.

"We have found that there are certain variables derived from city texture that allow us, with relative accuracy, to estimate the drag coefficients for buildings and identify areas vulnerable to risks of damage. Then we can run CFD simulations to determine precisely where that damage will occur."

Essentially, city texture serves as a first-line tool for stakeholders, allowing them to assess risk and then use their resources, including CFD, more efficiently to identify vulnerable buildings for retrofit and, in turn, save lives.

The complete picture

In addition to the loss of life, natural disasters inflict an immense financial toll. According to the National Oceanographic and Atmospheric Administration, 258 natural disasters have caused more than $1.75 trillion of damage in the United States since 1980.

While numerous practices can predict and mitigate these costs, Manav has found that they still leave a lot on the table—namely, city texture.

By collaborating with Roxon, she has discovered that by discounting community characteristics like city texture, current models underestimate losses, often dramatically.

To apply texture to hurricane losses, Manav looked once again to Florida's Sarasota and Lee counties. She conducted a conventional loss estimation and a city texture-adjusted loss estimation for each county based on the 95th percentile of annual expected hazard events—equivalent to some of the strongest hurricanes, like Irma. She found that the expected losses increased when she incorporated city texture into her estimations. The increase was particularly acute in Lee County, whose ordered texture would likely magnify wind loads.

"In Sarasota County, we saw an increase in the expected loss from 1 percent to 6 percent of average home's value when incorporating city texture," says Manav. "But doing the same for Lee County, we saw an appreciably higher amount of damage, equivalent to approximately 9 percent of an average home's value."

Without incorporating city texture, then, these conventional estimations dramatically underestimate damages. This makes residents unaware of their hazard risk, and consequentially leaves them vulnerable.

The incentives for resilience

As sobering as these loss estimations are, Manav hopes they may yet help communities become more hazard-resilient.

Currently, she notes, hazard resilience has not become broadly implemented because most remain unaware of its cost benefits.

"One reason hazard-mitigation practices are not being implemented is that their benefits are not being communicated thoroughly," she says. "Obviously, there is the cost of constructing to better standards. But to balance out these costs there are the benefits of reduced repair costs following hazard events."

These reduced damage costs are significant.

Actions as simple as choosing hardier shingles, improving roof-to-wall connections, and adding shutters and impact-rated windows can mitigate hazard damages enough to pay back in as little as two years in hazard-prone areas like coastal Florida.

By using city texture to calculate hazard costs, Manav and Roxon hope homeowners, developers, and policymakers will choose to implement these relatively simple practices. The only key is making their incentives widely known.

Explore furtherAn atomic-scale erector set
More information: Role of City Texture in Urban Heat Islands at Nighttime. hdl.handle.net/1721.1/114808

Provided by Massachusetts Institute of Technology

This story is republished courtesy of MIT News (web.mit.edu/newsoffice/), a popular site that covers news about MIT research, innovation and teaching.
Sophisticatedly engineered 'watercourts' stored live fish, fueling Florida's Calusa kingdom

by Natalie Van Hoose, Florida Museum of Natural History
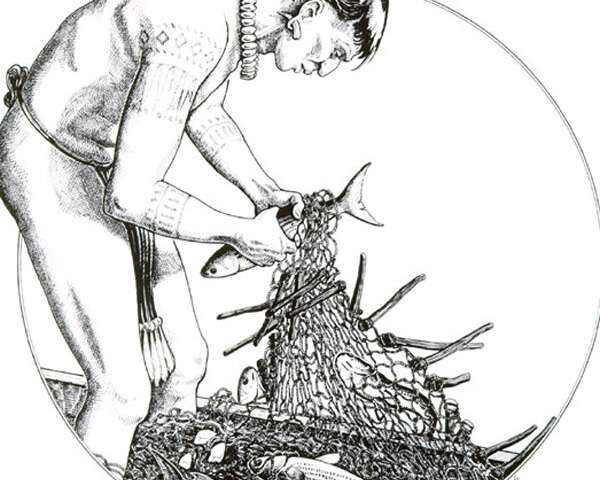
The Calusa kingdom ranks among the most politically complex groups of hunter-gatherers of the historic world. Unusually, it was powered by fishing, not farming. Massive enclosures enabled the Calusa to store enough fish to sustain population growth and fuel large-scale construction projects. Credit: Merald Clark/Florida Museum

The mighty Calusa ruled South Florida for centuries, wielding military power, trading and collecting tribute along routes that sprawled hundreds of miles, creating shell islands, erecting enormous buildings and dredging canals wider than some highways. Unlike the Aztecs, Maya and Inca, who built their empires with the help of agriculture, the Calusa kingdom was founded on fishing.


But like other expansive cultures, the Calusa would have needed a surplus of food to underwrite their large-scale construction projects. This presented an archaeological puzzle: How could this coastal kingdom keep fish from spoiling in the subtropics?

A new study points to massive structures known as watercourts as the answer. Built on a foundation of oyster shells, these roughly rectangular enclosures walled off portions of estuary and likely served as short-term holding pens for fish before they were eaten, smoked or dried. The largest of these structures is about 36,000 square feet—more than seven times bigger than an NBA basketball court—with a berm of shell and sediment about 3 feet high. Engineering the courts required an intimate understanding of daily and seasonal tides, hydrology and the biology of various species of fish, researchers said.

The watercourts help explain how the Calusa could rely primarily on the sea.

"What makes the Calusa different is that most other societies that achieve this level of complexity and power are principally farming cultures," said William Marquardt, curator emeritus of South Florida Archaeology and Ethnography at the Florida Museum of Natural History. "For a long time, societies that relied on fishing, hunting and gathering were assumed to be less advanced. But our work over the past 35 years has shown the Calusa developed a politically complex society with sophisticated architecture, religion, a military, specialists, long-distance trade and social ranking—all without being farmers."
The "West Court" marked in this LiDAR map of Mound Key, the capital of the Calusa kingdom, is more than 36,000 square feet, more than seven times the size of an NBA basketball court. These courts were engineered with knowledge of tides and fish biology. Credit: Victor Thompson et al.

The fact that the Calusa were fishers, not farmers, created tension between them and the Spaniards, who arrived in Florida during the 16th century when the Calusa kingdom was at its zenith, said study lead author Victor Thompson, director of the University of Georgia's Laboratory of Archaeology.

"The Spanish soldiers, priests and officers were used to dealing with agriculturalists, such as the people they colonized in the Caribbean who grew maize surpluses for them," Thompson said. "This would not have been possible with the Calusa. In fact, in a late 1600s mission attempt by the Franciscans, hoes were unloaded off the ship, and when the Calusa saw this, they remarked, 'Why didn't they also bring slaves to till the ground?'"


Thompson, Marquardt and colleagues analyzed two watercourts along the southwest shore of Mound Key, an island in Estero Bay off Florida's Gulf Coast and the seat of Calusa power for about 500 years.

These courts, still visible today, flank the grand canal, a marine highway nearly 2,000 feet long and averaging 100 feet wide, which bisects the key. Both have yards-long openings in the berms along the canal, possibly to allow Calusa to drive fish into the enclosures, which could then be closed with a gate or net.

The team studied the watercourts and surrounding areas using remote sensors, cores of sediment and shell and excavations. The bisected key features two large shell mounds, one on either side of the island. Remote sensing showed slopes leading from the watercourts to the top of the mounds, which may have been causeways for transporting food. On the shoreline, researchers found evidence of burning and small post molds, possibly for racks used to smoke and dry fish.
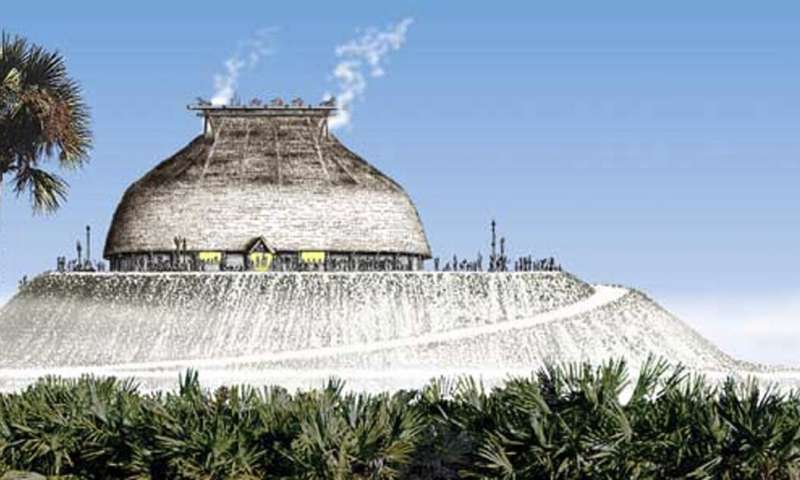
The fish surplus stored in watercourts likely enabled the Calusa to complete large-scale construction projects. The largest watercourt was built during a key construction phase of the king's manor on Mound Key. The Spanish recorded the manor as capable of holding 2,000 people. Credit: Merald Clark/Florida Museum

Radiocarbon dating suggests the watercourts were built between A.D. 1300 and 1400—around the end of a second phase in the construction of a king's manor, an impressive structure that would eventually hold 2,000 people, according to Spanish documents.

A.D. 1250 also corresponds to a drop in sea level, which "may have impacted fish populations enough to help inspire some engineering innovation," said Karen Walker, Florida Museum collection manager of South Florida Archaeology and Ethnography.

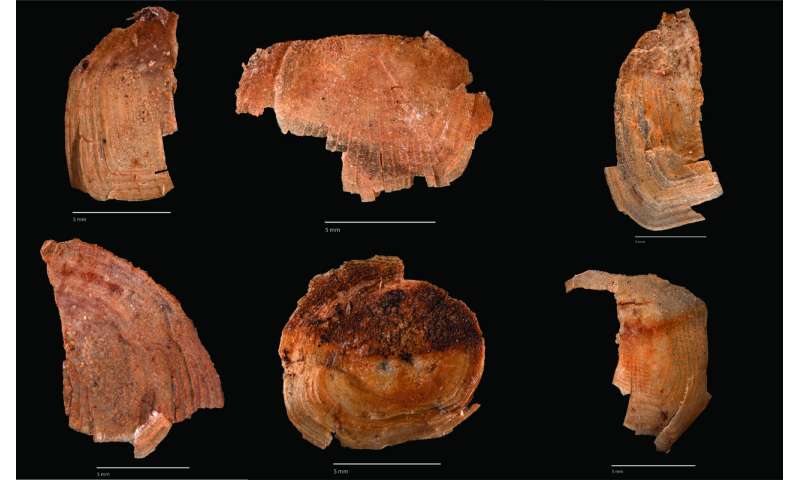
Fish bones and scales found in the western watercourt show the Calusa were capturing mullet and likely pinfish and herring, all schooling species. Florida Gulf Coast University geologist Michael Savarese's analysis of watercourt core samples revealed dark gray sediment that was rich in organic material, suggesting poor circulation. High tide would have refreshed the water to some extent, Marquardt said.

"We can't know exactly how the courts worked, but our gut feeling is that storage would have been short-term—on the order of hours to a few days, not for months at a time," he said.

While researchers previously hypothesized watercourts were designed to hold fish, this is the first attempt to study the structures systematically, including when they were built and how that timing correlates with other Calusa construction projects, Marquardt said.
Archaeological specimens of mullet (Mugil sp.) fish scales recovered from a live-storage area at Mound Key, the capital of the Calusa Kingdom in Southwest Florida. Credit: Zachary S. Randall (Florida Museum of Natural History, Gainesville, FL).

The Calusa dramatically shaped their natural environment, but the reverse was also true, Thompson said.

"The fact that the Calusa obtained much of their food from the estuaries structured almost every aspect of their lives," he said. "Even today, people who live along coasts are a little different, and their lives continue to be influenced by the water—be it in the food they eat or the storms that roll in on summer afternoons in Southwest Florida."

The study will publish this week in the Proceedings of the National Academy of Sciences.

Explore further
Building on shells: Interdisciplinary study starts unraveling mysteries of Calusa kingdom
More information: Victor D. Thompson et al, Ancient engineering of fish capture and storage in southwest Florida, Proceedings of the National Academy of Sciences (2020). DOI: 10.1073/pnas.1921708117
Research team releases new global groundwater maps

March 31, 2020 Ellen Gray, NASA's Goddard Space Flight Center

30, 60, and 90-day forecasts of dry and wet conditions relative to the historic record for the Lower 48 United States use groundwater data from the NASA/GFZ GRACE-FO satellites for the initial conditions. This comparison shows the groundwater forecast made for August 2019 compared to the output based on the satellite observations for the same month. Credits: NASA / Scientific Visualization Studio

NASA researchers have developed new satellite-based, weekly global maps of soil moisture and groundwater wetness conditions and one to three-month U.S. forecasts of each product. While maps of current dry/wet conditions for the United States have been available since 2012, this is the first time they have been available globally.

"The global products are important because there are so few worldwide drought maps out there," said hydrologist and project lead Matt Rodell of NASA's Goddard Space Flight Center in Greenbelt, Maryland. "Droughts are usually well known when they happen in developed nations. But when there's a drought in central Africa, for example, it may not be noticed until it causes a humanitarian crisis. So it's valuable to have a product like this where people can say, wow, it's really dry there and no one's reporting it."

These maps are distributed online by the National Drought Mitigation Center at the University of Nebraska-Lincoln (UNL) to support U.S. and global drought monitoring.

"Being able to see a weekly snapshot of both soil moisture and groundwater is important to get a complete picture of drought," said professor Brian Wardlow, director for the Center for Advanced Land Management Information Technologies at UNL, who works closely with Rodell on developing remote sensing tools for operational drought monitoring.

Monitoring the wetness of the soil is essential for managing agricultural crops and predicting their yields, because soil moisture is the water available to plant roots. Groundwater is often the source of water for crop irrigation. It also sustains streams during dry periods and is a useful indicator of extended drought. But ground-based observations are too sparse to capture the full picture of wetness and dryness across the landscape like the combination of satellites and models can.


A Global Eye on Water

Both the global maps and the U.S. forecasts use data from NASA and German Research Center for Geosciences's Gravity Recovery and Climate Experiment Follow On (GRACE-FO) satellites, a pair of spacecraft that detect the movement of water on Earth based on variations of Earth's gravity field. GRACE-FO succeeds the highly successful GRACE satellites, which ended their mission in 2017 after 15 years of operation. With the global expansion of the product, and the addition of U.S. forecasts, the GRACE-FO data are filling in key gaps for understanding the full picture of wet and dry conditions that can lead to drought.


The satellite-based observations of changes in water distribution are integrated with other data within a computer model that simulates the water and energy cycles. The model then produces, among other outputs, time-varying maps of the distribution of water at three depths: surface soil moisture, root zone soil moisture (roughly the top three feet of soil), and shallow groundwater. The maps have a resolution of 1/8th degree of latitude, or about 8.5 miles, providing continuous data on moisture and groundwater conditions across the landscape.

The GRACE and GRACE-FO satellite-based maps are among the essential data sets used by the authors of the U.S. Drought Monitor, the premier weekly map of drought conditions for the United States that is used by the U.S. Department of Agriculture and the Federal Emergency Management Agency, among others, to evaluate which areas may need financial assistance due to losses from drought.

"GRACE [provided and GRACE-FO now provides] a national scope of groundwater," said climatologist and Drought Monitor author Brian Fuchs, at the drought center. He and the other authors use multiple data sets to see where the evidence shows conditions have gotten drier or wetter. For groundwater, that used to mean going to individual states' groundwater well data to update the weekly map. "It's saved a lot of time having that groundwater layer along with the soil moisture layers, all in one spot," Fuchs said. "The high-resolution data that we're able to bring in allows us to draw those contours of dryness or wetness right to the data itself."

One of the goals of the new global maps is to make the same consistent product available in all parts of the world—especially in countries that do not have any groundwater-monitoring infrastructure.
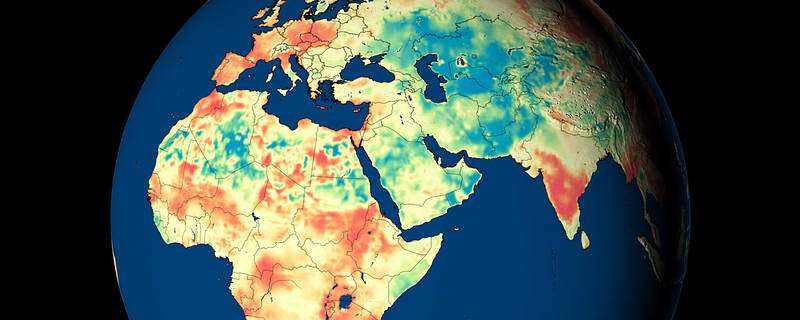
Weekly maps of dry conditions in red and wet conditions in blue relative to the historic record are now available for the globe at three depths: surface soil moisture, root zone soil moisture, and groundwater, the latter shown in this global view. Credit: NASA / Scientific Visualization Studio
"Drought is really a key [topic]... with a lot of the projections of climate and climate change," Wardlow said. "The emphasis is on getting more relevant, more accurate and more timely drought information, whether it be soil moisture, crop health, groundwater, streamflow—[the GRACE missions are] central to this," he said. "These types of tools are absolutely critical to helping us address and offset some of the impacts anticipated, whether it be from population growth, climate change or just increased water consumption in general."

Both the Center for Advanced Land Management and the National Drought Mitigation Center are based in UNL's School of Natural Resources, and they are working with international partners, including the U.S. Agency for International Development and the World Bank, to develop and support drought monitoring using the GRACE-FO global maps and other tools in the Middle East, North Africa, South Africa, South East Asia, and India.

Droughts can be complex, both in timing and extent. At the surface, soil moisture changes rapidly with weather conditions. The moisture in the root zone changes a little slower but is still very responsive to weather. Lagging behind both is groundwater, since it is insulated from changes in the weather. But for longer-term outlooks on drought severity—or, conversely, flood risk in low-lying areas—groundwater is the metric to watch, said Rodell.

"The groundwater maps are like a slowed down, smoothed version of what you see at the surface," Rodell said. "They represent the accumulation of months or years of weather events." That smoothing provides a more complete picture of the overall drying or wetting trend going on in an area. Having an accurate accounting of groundwater levels is essential for accurately forecasting near-future conditions.

The new forecast product that projects dry and wet conditions 30, 60, and 90 days out for the lower 48 United States uses GRACE-FO data to help set the current conditions. Then the model runs forward in time using the Goddard Earth Observing System, Version 5 seasonal weather forecast model as input. The researchers found that including the GRACE-FO data made the resulting soil moisture and groundwater forecasts more accurate.

Since the product has just been rolled out, the user community is only just beginning to work with the forecasts, but Wardlow sees a huge potential.

"I think you'll see the GRACE-FO monitoring products used in combination with the forecasts," Wardlow said. "For example, the current U.S. product may show moderate drought conditions, and if you look at the forecast and the forecast shows next month that there's a continued drying trend, then that may change the decision versus if it was a wet trend."

The U.S. forecast and global maps are freely available to users through the drought center's data portal.


Explore furtherGRACE-FO will help monitor droughts
Provided by NASA's Goddard Space Flight Center


Watchdog finds new problems with FBI wiretap applications

FBI
The FBI has failed to follow its own policies for ensuring the accuracy of applications it submits to conduct wiretaps in national security investigations, including in some cases by not having documentation to support arguments made to judges, according to a letter released Tuesday,
The findings are on top of problems identified last year by the 's office, which concluded that FBI agents had made significant errors and omissions in applications to eavesdrop on a former Trump campaign adviser during the early months of the Russia investigation. Those mistakes prompted internal changes within the FBI and spurred a congressional debate over whether the bureau's surveillance tools should be reined in.
After the Russia report was submitted last December, Inspector General Michael Horowitz announced a broader review of the FBI's spy powers and its applications before the secretive Foreign Intelligence Surveillance Court. As part of that review, the watchdog office examined how well the FBI was complying with internal rules that require agents to submit supporting documentation to back up every factual assertion they make in the application.
Those rules, known as the Woods Procedures, were developed in 2001 after mistakes were identified in multiple applications, known by the acronym FISA, that were submitted in counterterrorism investigations.
Horowitz said in a letter to FBI Director Chris Wray that in four of the 29 FISA applications his office selected for review, the FBI could not produce any supporting documents or records. In the 25 applications that were supplemented with supporting documentation, the office "identified apparent errors or inadequately supported facts in all" of them.
In some instances, facts stated in the applications were not supported by any documentation, and in others were either not corroborated by the documentation or even inconsistent with it. The watchdog office found an average of about 20 issues per application it reviewed.
As a result, Horowitz wrote, "we do not have confidence that the FBI has executed its Woods Procedures in compliance with FBI policy, or that the process is working as it was intended to help achieve the 'scrupulously accurate' standard for FISA applications."
The inspector general's office did not make a judgment as to whether the mistakes that it identified were "material" to the investigation or to the court's decision to authorize the wiretap.
The office recommended that the FBI "perform a physical inventory" to ensure that supporting documentation, known as Woods Files, exists for every application submitted to the court in all pending investigations. It also recommended that the FBI examine the results of "past and future accuracy reviews" so that it can identify trends and patterns and develop better training for agents.
In a response letter, FBI Associate Deputy Director Paul Abbate said the FBI was working to address the inspector general's concerns and agreed with the office's recommendations. He said the errors identified by the inspector general will be addressed by the more than 40 corrective actions that Wray ordered last year in the aftermath of the Russia investigation report.
"As Director Wray has stressed, FISA is an indispensable tool to guard against national security threats, but we must ensure that these authorities are carefully exercised and that FISA applications are scrupulously accurate," Abbate wrote.
The Foreign Intelligence Surveillance Court was established in 1978 to receive applications from the FBI to eavesdrop on people it suspects of being agents of a foreign power, such as potential spies or terrorists. Critics have long complained about the opaque, one-sided nature of the application process, and longstanding calls to overhaul the system received a bipartisan push because of the errors identified during the FBI's investigation into ties between the Trump campaign and Russia.
The congressional debate tripped up FBI efforts to renew three surveillance provisions that expired this month. Though the House passed Justice Department-backed legislation to address some of the civil liberties concerns identified by the inspector general, the Senate adjourned last week without approving the bill.
FBI working to 'burn down' cyber criminals' infrastructure

© 2020 The Associated Press. All rights reserved. This material may not be published, broadcast, rewritten or redistributed without permission.
The disturbing link between Trump’s acquittal and his malignant coronavirus negligence
March 31, 2020 By John Stoehr, The Editorial Board- Commentary


There’s a fake argument circulating that goes something like this. The president isn’t to blame for the coronavirus pandemic that has now killed more Americans than were murdered on Sept. 11, 2001. Instead, the Democrats are to blame. They distracted Donald Trump with their pointless impeachment and failed attempt to remove him.

This article was originally published at The Editorial Board

The “lost month,” as the Times called it, wasn’t the result of indifference, paranoia and/or dereliction of duty on the part of the chief executive but instead the result of petty partisanship and senseless hate of a president fighting for the American people.

Or something like that. It’s hard to say. These talking points are never well-thought. Just speaking them, as if they were spells and incantations, is what matters to the sycophants, golems and ghouls the president enjoys surrounding himself with.

In any case, we know the truth.

US intelligence officials briefed Trump in early January, warning that a contagion was coming the likes of which we have never seen before. The president did nothing. Senators from both parties were briefed in early February. They urged Trump to ask for emergency funding to counteract COVID-19’s spread. The president did nothing.

On Saturday, the US death toll reached 2,000. Three days later, it reached 3,000. Sept. 11, 2001, had 2,977 victims. At this rate the body count might actually eclipse the number of Americans who died fighting in World War II (about 300,000). Indeed, that seems likely. The White House’s point-person, Dr. Deborah Birx, told the Today show Monday we can expect as many as 200,000 dead “if we do things almost perfectly.”

The fake argument gets something right, though. It gets right the connection between the president’s acquittal and his malign negligence. Think about it for a minute.

He was acquitted of treason (extorting a foreign leader so he’d interfere with an election). 

He was acquitted of sabotage (undermining the constitutional authority of the Congress.) Thanks to the GOP, there’s virtually nothing Trump has to do to honor his oath to defend the US from all enemies. There’s nothing he has to do to “take care” that our laws are faithfully executed. Nothing, because who’s doing to make him?

Well, public opinion might. That can be addressed by signing into law (so far) three rounds of stimulus that will shovel mountains of cash into the economy, buoying Wall Street confidence and keeping high the Dow and S&P 500. That can also be addressed by preventing the public from knowing how many people are dead from COVID-19.

If that means malicious lying, so be it. It that means prohibiting hospitals from getting tests, ventilators and personal protective equipment (PPE), so be it. If that means subverting states’ rights and sovereignty, so be it. If that means mass death, so be it. Trump was acquitted of putting his interests above the nation’s. Why stop now?

The Times reported a phone call Monday in which the governors, Republican and Democrats, confirmed two vital facts. One, that the federal government has been outbidding states with vendors selling tests, ventilators and PPE. Two, and at the same time, the federal government has not provided states with enough tests, ventilators and PPE. “I haven’t heard about testing being a problem,” Trump said, which is code for, “I don’t want to hear about testing being a problem so I literally won’t hear it.”

Yes, Trump will block the states from getting coronavirus testing in order to keep the national number of dead artificially low. Yes, that’s a terrible thing to presume of one’s president, but seriously. What did you expect? Is any of this all that surprising?

This is the same president who ordered the confiscation of babies from immigrant mothers; who banned Muslims from entering the US from certain countries; who attacked civil liberties and undermined impartial justice; who inspired acts of antisemitism, racism and mass murder; who stole daily from public coffers; and who got away with treason, complaining all the while that he doesn’t get enough credit.

The only people left in America capable of surprise are those who voted for his promise to punish people for the fun it. The only people left in America capable of surprise are those who don’t think it’s fun anymore, not when they are getting punished. They might say what a Trump voter said about a year ago: “I thought he was going to do good things. He’s not hurting the people he needs to be hurting.”

Don’t think Trump is in trouble with his base, though. It’s as masochistic as it is sadistic. The GOP itself has a high tolerance for high frequency death, even if Republicans are among the dead. After all, gun massacres happen in red states, too. Instead of tightening their gun laws, however, they seek to loosen them more.