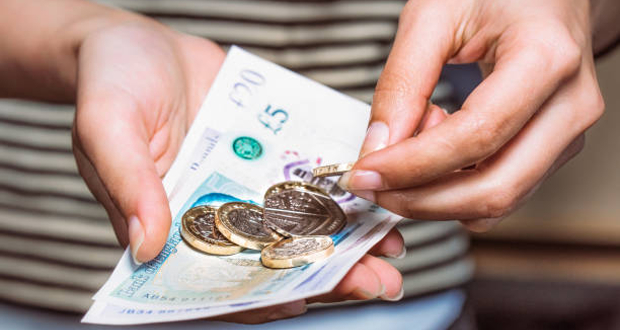
Four-week grocery price inflation has also hit another record high since Kantar began tracking prices in this way in 2008, now sitting at 14.7%.
Fraser McKevitt, head of retail and consumer insight at Kantar, said: “Yet again, we have a new record high figure for grocery price inflation and it’s too early right now to call the top.
“Consumers face a £682 jump in their annual grocery bill if they continue to buy the same items and just over a quarter of all households [27%] now say they’re struggling financially, which is double the proportion we recorded last November.
Consumer concerns
“Nine in ten of this group say higher food and drink prices are a major concern, second only to energy bills, so it’s clear just how much grocery inflation is hitting people’s wallets and adding to their domestic worries.”
Own label sales have jumped again by 10.3% over the latest four weeks, as shoppers adopt different strategies to manage their budgets. The branded goods market grew far slower at 0.4%.
McKevitt added: “Food and drink spending is generally non-discretionary so it’s not easy for shoppers to cut back the amount they buy.
“Many are looking to reduce costs in other ways and the big shift to own label is still accelerating. While some of the rise will be down to price inflation, we can clearly see the trend in sales of the very cheapest value own label ranges, which are up by a whopping 42%.
 “These items currently represent just under 3% of the market, although retailers have been adding new products in recent months, so it will be interesting to see if this continues.”
Some consumers found light relief at Halloween this year although sales were down compared with 2021.
“Our data runs for the four weeks to 30 October so picks up all but the final purchases shoppers made for Halloween,” said McKevitt.
“The data shows just over one in ten households bought a pumpkin in October, but sales didn’t match the levels we saw last year. There’s clear evidence that the new regulations for products high in fat, sugar and salt are changing the way these items are sold. The proportion of confectionery bought on promotion during the month of October was 26%, down from 36% this time last year.”
“This time last year two million consumers had already bought their festive Christmas pudding. We’ve seen 32% fewer shoppers doing that this time around, suggesting people are not trying to spread the cost of their purchasing – at least not in October.
World Cup
“This Christmas is going to be a bit different of course, with the men’s football World Cup kicking off on 20 November. The novelty of two home nations playing for the first time in nearly 25 years should generate a lot of excitement and could boost sales at the tills depending on when the games fall. Beer in particular does well when the football is on.
“During the 2018 men’s World Cup, the number of shoppers buying beer to enjoy at home tripled on the day of England’s first match against Tunisia. The evening games for the 2022 tournament will likely generate the biggest sales including England’s match against the US on 25 November.”
‘Big Four’
Aldi was the fastest growing retailer in the latest period, increasing its sales by 22.7% year on year to now hold a 9.2% market share. Lidl boosted sales by 21.5% to take its market share to a new record high of 7.2%.
Asda again led the traditional ‘Big Four’ with sales growing by 5.3%, maintaining an overall market share of 14.3%. Meanwhile, sales at Sainsbury’s increased by 3.3% with its market share now at 14.9%. The largest retailer Tesco had a 27.0% share and saw sales grow by 3.1%. Morrisons’ market share is now 9.0%.
Iceland grew slightly ahead of the market, with sales increasing by 5.3%. Co-op’s sales rose by 3.3%, while Waitrose’s sales dipped by 1.9%. Online retailer Ocado held sales flat versus last year and it has a 1.6% share of the market which equals the share of symbols and independents.
| | Total Till Roll – Consumer Spend | 12 weeks to 31 Oct 2021 | Share | 12 weeks to 30 Oct 2022 | Share | Change YoY | | | | £m | % | £m | % | % | | | | Total Grocers | 28,893 | 100.0% | 30,398 | 100.0% | 5.2% | | | | Total Multiples | 28,406 | 98.3% | 29,926 | 98.4% | 5.4% | | | | Tesco | 7,964 | 27.6% | 8,209 | 27.0% | 3.1% | | | | Sainsbury’s | 4,385 | 15.2% | 4,531 | 14.9% | 3.3% | | | | Asda | 4,128 | 14.3% | 4,346 | 14.3% | 5.3% | | | | Morrisons | 2,878 | 10.0% | 2,747 | 9.0% | -4.6% | | | | Aldi | 2,290 | 7.9% | 2,811 | 9.2% | 22.7% | | | | Lidl | 1,800 | 6.2% | 2,187 | 7.2% | 21.5% | | | | Co-op | 1,819 | 6.3% | 1,880 | 6.2% | 3.3% | | | | Waitrose | 1,448 | 5.0% | 1,421 | 4.7% | -1.9% | | | | Iceland | 653 | 2.3% | 688 | 2.3% | 5.3% | | | | Ocado | 489 | 1.7% | 488 | 1.6% | 0.0% | | | | Other Multiples | 552 | 1.9% | 618 | 2.0% | 12.1% | | | | Symbols & Independents | 487 | 1.7% | 472 | 1.6% | -3.1% |
|
|


 “These items currently represent just under 3% of the market, although retailers have been adding new products in recent months, so it will be interesting to see if this continues.”
No comments:
Post a Comment