Monday, December 20, 2021


Robotic Monitoring of the Deep-Sea Carbon Cycle and Climate Change

Thought LeadersPaul McGill
Alana Sherman
Crissy Huffard

In this interview, we speak to researchers from the Monterey Bay Aquarium Research Institute about the Benthic Rover II and how it helps to monitor the deep-sea carbon cycle and climate change.

Please introduce yourself and tell us

about your background in ocean monitoring?

We are Crissy Huffard, Senior Research Specialist (marine biologist), Alana Sherman, Electrical Engineering Group Lead (electrical engineer), and Paul McGill, Electrical Engineer (electrical engineer).

The three of us work as part of a team to study deep-ocean carbon cycling at Station M, which sits 4,000 meters deep off the central California coast. Alana and Paul, along with Rich Henthorn and John Ferreira, are on the technological innovation side of the team, while Crissy works with Ken Smith to interpret data the instruments bring back.

What role does the deep seafloor play in

 carbon cycling and sequestration?

Globally, the deep ocean is a very important carbon sink. Deep-ocean carbon storage capacity ultimately influences how much carbon dioxide the ocean can take out of the atmosphere.

At Station M, seafloor communities (animals and microbes) eat a lot of this carbon (an “ingredient” of marine snow that drifts to the abyssal seafloor from the waters above) as it settles, leaving very little, if any, to be stored long term in the sediments.

Why is understanding the activities surrounding 

the deep seafloor so important?

This information ultimately helps us understand where and how much carbon gets stored in the ocean.

How was the Benthic Rover II created 

and what were the challenges faced when developing it?

The Benthic Rover II followed a first version (Benthic Rover I) that Ken Smith developed at Scripps Institution of Oceanography in the 1990s, but was lost at sea.

The Benthic Rover II was designed to accomplish the science objective to study carbon cycling and survive extreme pressure, almost-freezing temperatures, corrosive seawater, and ship operations in high seas.

What steps had to be taken to release 

the rover into the ocean originally?

To handle the corrosive, high-pressure environment, the Benthic Rover II is made almost entirely of titanium and plastic, and its flotation is provided by rugged “syntactic foam” blocks (tiny, hollow glass spheres embedded in epoxy resin) arranged to maintain an upright orientation.

The bumper protects it from just that—bumps—that might take place during deployment and recovery in the high seas.

What can the Benthic Rover II measure 

about the seafloor and how?

The Benthic Rover II’s main science objective is to help us understand carbon consumption. It lowers two acrylic chambers (with stir bars and an oxygen sensor inside) down into the sediment and measures oxygen depletion for 48 hours.

With these data, we estimate the carbon consumption by animals and microbes living there. It also takes pictures of the seafloor and records information about ambient water conditions such as currents, oxygen concentration, and temperature.

How is the Benthic Rover II recovered

every year and its findings assessed?

The Benthic Rover II is called to the surface with an acoustic signal that tells it to drop its 250-pound ballast weight. Once on the surface, we find it either by sight or using its radio and satellite beacons. The crew of MBARI’s R/V Western Flyer then recover it onto the ship.

Data are downloaded and backed up on the ship, then taken to shore for analysis of engineering performance and scientific results.

What has the data collected from Benthic Rover II over the last seven years shown?

The deep-sea is dynamic! In the past ten years, we’ve seen a large increase in the amount of carbon making its way to the deep sea. Data from the Benthic Rover II is helping us understand how much, if any, of this carbon might be stored in the sediments.

When coupled with results from other autonomous instruments at Station M, we’re even able to study what types of marine snow might be especially efficient at storing carbon in sediments.

What do your results show you about 

the future of the ocean and its role in 

climate change?

Humans’ impact on the surface ocean is translating to changes in the deep sea. Problems like ocean acidification and deoxygenation aren’t limited to the surface ocean. We need to worry about them changing the full ocean depths.

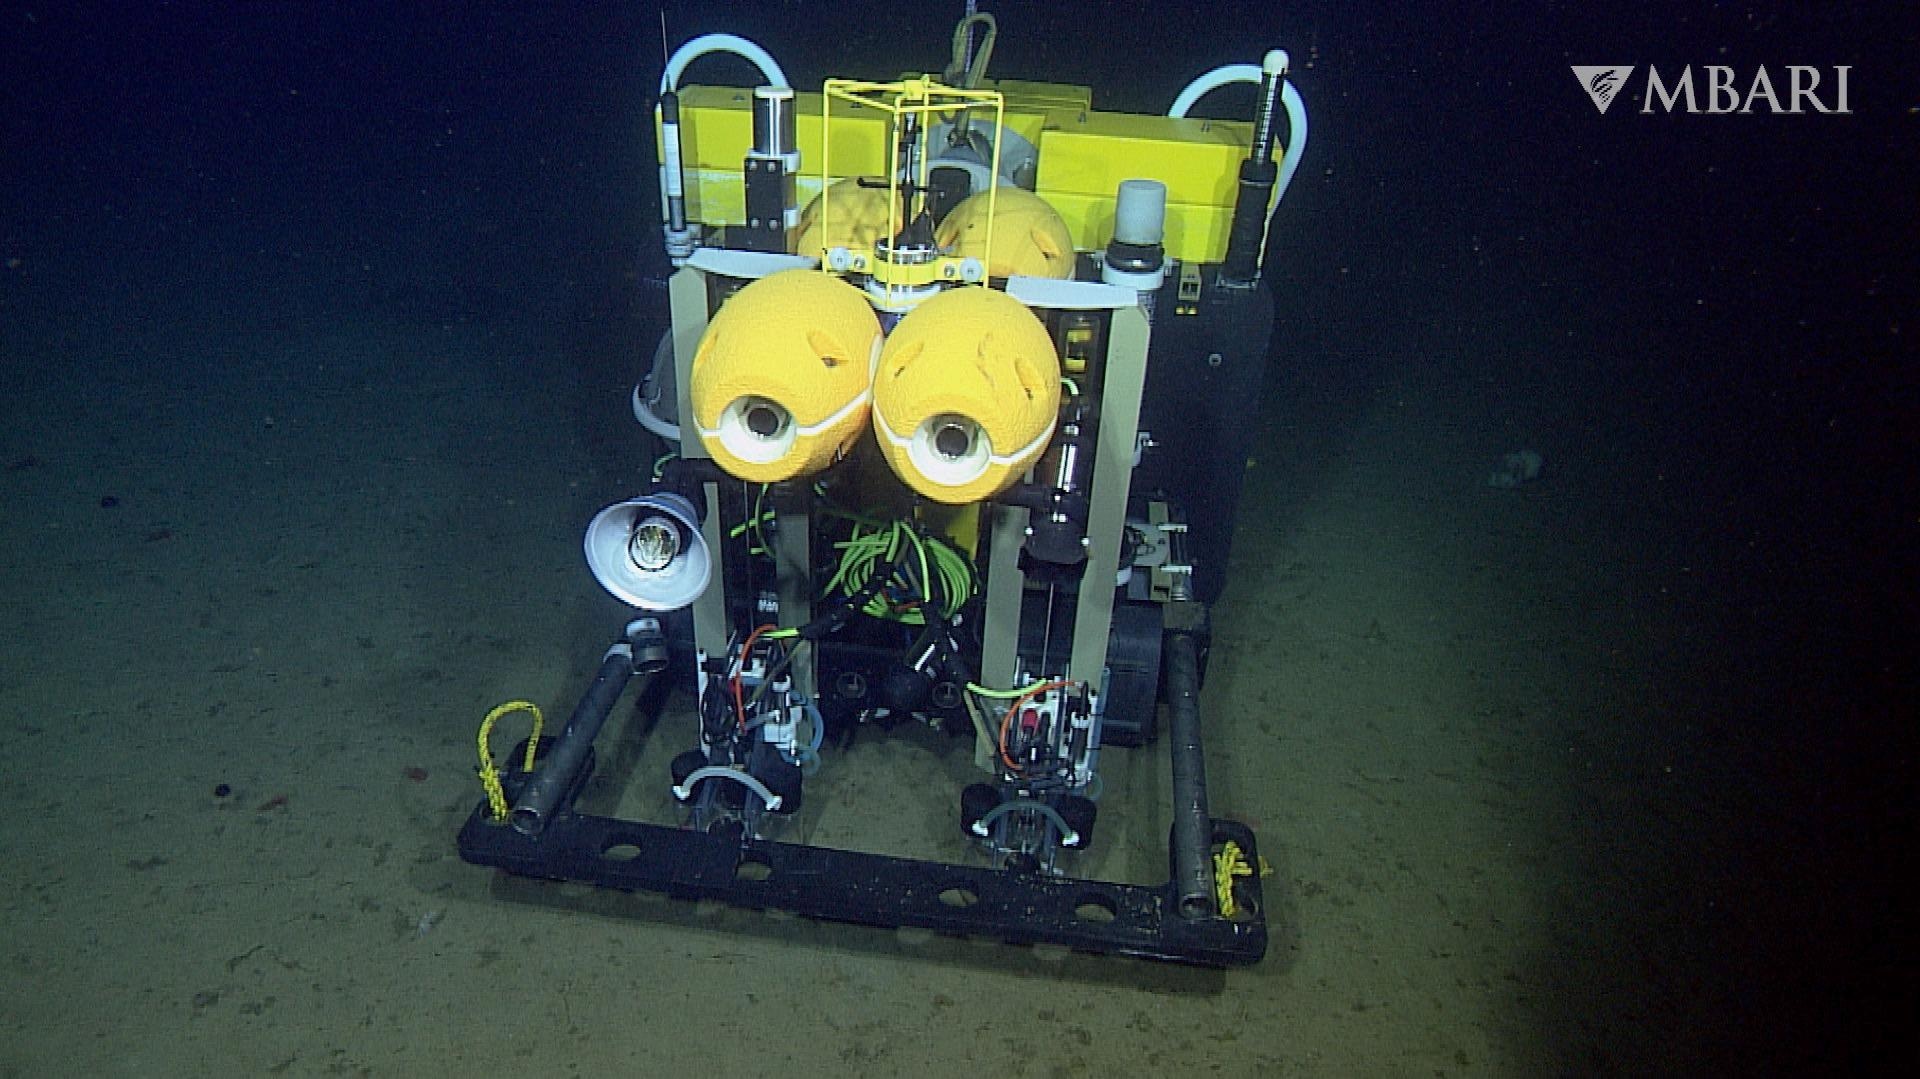
MBARI’s Benthic Rover II during a deployment at Station M, an MBARI research site off the coast of central California                Image Credit: © 2016 MBARI

What is the next stage for the Benthic Rover II?

We’re testing pH sensors to add to the system to help us better refine our estimates of carbon consumption.

Using the knowledge that the rover has given us, 

what do you think needs to be done to maintain

 the health of our oceans and planet?

Limit our total carbon emissions and educate the public on the important issue of ocean acidification.

Where can readers find more information?

About the Researchers

Crissy, Paul, and Alana work at MBARI in Moss Landing, California. MBARI (Monterey Bay Aquarium Research Institute) is a private non-profit oceanographic research center, founded by David Packard in 1987. The mission of MBARI is to advance marine science and technology to understand a changing ocean. Learn more at www.mbari.org.


 How Increasing Sea Temperatures Affect Marine Species Migration

Thought LeadersShahar ChaikinMarine Ecology & Biodiversity Lab
Tel-Aviv University

AZoCleantech speaks to Shahar Chaikin from Tel-Aviv University about his latest research on the role of climate change on marine species migration and distribution. This work was also conducted with Ph.D. candidate Shahar Dubiner and Professor Jonathan Belmaker. The team found that the warming climate drives marine species to migrate deeper as the ocean they live in warms. 

Can you tell us about your role at 

Tel Aviv University?

I am currently a Ph.D. candidate in Professor Jonathan (Yoni) Belmaker’s lab, School of Zoology, The Steinhardt Museum of Natural History, Tel-Aviv University.

How did you begin your research into

 marine species migration?

As far as I remember myself, I was interested in marine organisms. During my undergraduate studies, I studied seasonal migrations of rays as part of their assumed breeding season. Since then, I began a direct Ph.D. program that allowed me to further expand my study for other marine organisms and explore the potential effects of climate change on species distributions. Together with my supervisor Yoni, we established my Ph.D. dissertation, aimed at elucidating patterns and drivers underlying marine species depth distributions.

What were the key findings of your 

recent study on marine animal migration?

We found evidence that an increasingly warming climate may drive marine species such as fish, cephalopods, and crustaceans to compress their depth distributions. This means that their minimum depth limits (i.e., shallow depth limits) are deepening with warming. Furthermore, the amount of deepening is strongly related to species traits. For instance, cold-water species may deepen more than warm-water species.

This image of fish and cephalopods was taken on the Israeli coast in the Mediterranean Sea. Image Credit: Shahar Chaikin

Why is understanding marine species behavior important?

The oceans encompass most of our planet and have an important role in supplying vital services for both humans and the surrounding organisms such as oxygen and food. Understanding species responses to a changing climate may allow us to predict the potential distribution of important food resources, the efficiency of our future marine protected areas, and the species composition of our future oceans.

What implications does this study have

for fishing and future marine nature reserves?

Our ocean’s biota is undergoing a constant change with the shift of our climate. We assume that letting our current MPAs conserve the same habitats and grounds through time may not serve the same amount of protection for the future marine communities, as their distributions are also about to change.

Similarly, and based on our models, fishery grounds are predicted to deepen for cold-water and deep-water species in particular. Conversely, shallow-water species may not be able to deepen to cope with increasingly warming waters. Therefore, they may have to adapt as deeper environments may not serve as an optimal habitat.

How has the planet’s warming had a direct

 impact on the Mediterranean Sea in particular?

The semi-enclosed nature of the Mediterranean Sea makes it particularly sensitive to climate change. As a result, it is notorious for having one of the greatest warming rates in the world. For instance, the upper waters of the  Levantine basin have a warming rate of about 1.2 ℃ per decade which is about twice the warming rate in the entire Mediterranean Sea, a hotspot for climate change.

Generally, cold Atlantic waters are entering the Strait of Gibraltar. These waters flow across the North African shelf and are becoming constantly warmer, saltier (due to evaporation), and poor in nutrients (due to consumption by organisms) while reaching the Levant, the eastern warm edge of the Mediterranean. These waters continue to flow north and then west until they exit the Mediterranean Sea back to the Atlantic Ocean. This process may take approximately 100 years in terms of residence time.

How has sea temperature changed in the last

100 years?

Globally, according to Intergovernmental Panel on Climate Change, it appears that since the 1970s, our oceans are constantly warming and at rates that have near doubled since the early 1990s. As mentioned above, some environments are getting warmer than the global average, and we should remember that each ecosystem has its unique conditions.

How is the migratory pattern different in

 warm-water species and cold-water species?

We found that cold-water species are more sensitive to warming. This was evident with greater minimum depth deepenings for cold-water species (i.e species with affinity to cold waters such as the Atlantic mackerel) while compared to warm-water species (e.g., Whiskered sole). This pattern was true for the whole species pool, including fish, crustaceans, and cephalopods.

Before this study, we mainly knew anecdotal examples for species that inhabit shallow water in the Western Mediterranean Sea and dwell in deep waters in the Eastern Mediterranean. Therefore, creating a broad generalization across 236 marine Mediterranean species was an alarming and important understanding.

Were there any key challenges in your research

and how were these overcome?

While conducting a meta-analysis, there are usually many challenges associated with data quality control and standardization across the studies. We had to execute several sensitivity analyses to make sure that our results are not biased by sample locations, sampling intensity, and other potential biases associated with bottom-trawling. After combining all these analyses and closely observing the patterns, we were able to confidently report our results and conclusions.

How should decision-makers prepare in advance 

for the deepening of species?

I believe that decision-makers must have detailed plans for the future. For instance, marine protected area planners should also consider including deep habitats and not protecting only shallow and coastal ecosystems. Specifically, I recommend that each MPA should have a species list combined with species traits to understand the proportion of species of various thermal preferences, depth preferences, and levels of generalism-specialism. These may allow better decision-making according to species’ predicted depth changes.

Unfortunately, I believe that some species such as shallow-water species might be at greater risk than others (e.g. herbivores might not find suitable food at depths). This means that protecting them from overfishing might not always be enough.

Do you have any further research you would 

like to discuss?

In this study, we mainly underscore species’ predicted depth distributions with warming. We did not have data on whether these species are thriving or challenged by redistributions. It is difficult to understand whether deepening species are increasing or decreasing their fitness. Our current study’s overarching goal is to fill this knowledge gap. 

About Shahar Chaikin

I am currently a Ph.D. candidate in Professor Jonathan (Yoni) Belmaker’s lab, School of Zoology, The Steinhardt Museum of Natural History, Tel-Aviv University.

My current dissertation looks at how marine species are impacted by climate change and specifically explaining whether some are facing greater risks with warming. To deal with these questions I use both macroecological and local approaches using data science and field samplings.

I am also a co-founder of “Sharks in Israel”, an NGO that helps protect sharks and rays along the Israeli coast.

How Industrial Fishing Has Altered the Natural Balance of the Ocean

Thought LeadersIan HattonAlexander von Humboldt Research FellowMax Planck Institute for Mathematics in the Sciences

AZoCleantech speaks to Ian Hatton from Max Planck Institute for Mathematics in the Sciences about the consequences of industrial fishing and its effect on the ocean's natural balance.

How did you begin your research

 into industrial fishing and its effect on the ocean?

We began by compiling the biomass of all organisms in the ocean, from bacteria to whales. We used data from hundreds of thousands of measurements, from many different sources and locations globally to estimate the total biomass over the entire ocean. We also tallied meta-analyses and model output to reconstruct biomass in the years prior to 1850, when the ocean was in a more pristine state. Our methods were tailored to each major group of organisms.

What is the Sheldon size spectrum 

and how does it apply to your research?

We are accustomed to grouping organisms into species, but the Sheldon size spectrum groups organisms into size categories, regardless of which species they belong. These size classes get multiplicatively larger as we go from the smallest to the largest (e.g., 1, 10, 100 etc.) The Sheldon spectrum is the hypothesis, now 50 years old, that the total biomass in these different size groups is constant from bacteria to whales. This means that although whales might be 23 orders of magnitude larger than a bacteria (a one with 23 zeros), bacteria are 23 orders of magnitude more abundant, so their total biomass is equal.

What did your research involve?

Our research involved assembling all these disparate data sources to reconstruct the total biomass of all groups from bacteria to whales at a pristine point in time, before industrial fishing and whaling (circa 1850), and compare it to what it looks like today.

How has wide-scale industrial fishing 

affected oceans?

Different researchers might have different perspectives on the impacts of fishing, but the biomass structure of the ocean has been dramatically altered as a result of fishing. We found that the Sheldon spectrum hypothesis is broadly supported by data reconstruction for the pristine ocean, but the largest 1/3 of the spectrum (fish above 10 grams) have been significantly reduced so that this extremely large-scale pattern no longer holds.

industrial fishing, ocean balance

Image Credit: Max Planck Institute for Mathematics in the Sciences

How did your research team construct a large global dataset of marine organisms?

We used >200,000 water samples of bacteria and zooplankton, satellite imagery of chlorophyll to estimate phytoplankton, spatially resolved global biogeochemical models for fish biomass and IUCN data for marine mammals.

How did this dataset enable your team to 

differentiate the spatial distribution of 

12 major aquatic life groups in the ocean?

We used environmental correlates such as temperature and chlorophyll, to interpolate these data over the global ocean, for each group. We also employed two independent spatially resolved global models constrained by catch data to estimate fish over the global ocean. For large mammals, we used global population estimates from the IUCN. Essentially, we tailored our methods to the data available for each major group.

How did you use historical reconstructions 

and marine ecosystem models to assess

 marine biomass in pristine, pre-20th 

century oceans? What was the purpose of this?

We used historical reconstructions to assess the biomass spectrum before industrial fishing. This involved running our fish models back in time prior to industrial fishing, as well as using prior published marine mammal reconstructions. These historical reconstructions are beset by large uncertainties, but still provide a first-order approximation of what the oceans might have looked like before industrial fishing and whaling began.

How did your research highlight the human

 impacts on marine biomass and the

 inefficiency of fishing?

We demonstrated that the size spectrum, possibly life’s largest scale pattern, has been altered by the direct impacts of fishing. In other words, human activity has dramatically changed the law-like property of the ocean. We are still not sure of what the consequences of this could be.

Video Credit: Max Planck Institute for Mathematics in the Sciences

Do you have any future research you are 

able to discuss?

We are currently investigating theoretically where this very large-scale pattern originates. Much of prior thinking on this question was focused on certain groups such as zooplankton. By showing that the pattern appears to hold across all marine life, we need to expand our thinking to processes that could be common across the tree of life.

Where can readers find more information?

https://www.science.org/doi/10.1126/sciadv.abh3732

https://www.mis.mpg.de/institute/presse/news/hatton-humboldt-fellowship.html

About Ian Hatton

Ian Hatton has a background in biology. He previously studied and worked at McGill University, Canada, the National Institute for Mathematical Sciences, South Korea, Princeton University, USA, and the Institut de Ciència i Tecnologia Ambientals in Barcelona, Spain.

He is currently an Alexander von Humboldt Research Fellow at the Max Planck Institute for Mathematics in the Sciences in Leipzig, Germany.

Laura Thomson

Written by

Laura Thomson

Laura Thomson graduated from Manchester Metropolitan University with an English and Sociology degree. During her studies, Laura worked as a Proofreader and went on to do this full time until moving on to work as a Website Editor for a leading analytics and media company. In her spare time, Laura enjoys reading a range of books and writing historical fiction. She also loves to see new places in the world and spends many weekends looking after dogs as part of BorrowmyDoggy.com.

Simultaneous Heatwaves Will be More Frequent Due to Climate Change

Numerous large heatwaves the size of Mongolia happened at the same time approximately every day during the warm seasons of the 2010s throughout the Northern Hemisphere, according to a study guided by scientists from the Washington State University (WSU).

Simultaneous Heatwaves Will be More Frequent Due to Climate Change.
Image Credit: Lucian Dachman on Unsplash.

Applying climate data from 1979 to 2019, the scientists learned that the number of heatwaves taking place concurrently in the mid- to high-latitudes of the Northern Hemisphere was seven times more in the 2010s than in the 1980s. On average, there were simultaneous heatwaves on 143 days each year of the 2010s — nearly every day of the 153 days of the warm months of May to September.

The simultaneous heat events also became hotter and larger: their intensity grew by 17% and their geographic extent grew to 46%.

More than one heatwave occurring at the same time often has worse societal impacts than a single event. If certain regions are dependent on one another, for instance for agriculture or trade, and they’re both undergoing stresses at the same time, they may not be able to respond to both events.

Cassandra Rogers, Study Lead Author and Post-Doctoral Researcher, WSU

Details of the study have been published in the Journal of Climate.

Heatwaves could result in disasters from crop failures to wildfires. Simultaneous heatwaves can increase those threats, the authors highlighted, draining the ability of nations to offer mutual aid in crises as was witnessed during the numerous wildfires in the United States, Australia and Canada related to the 2019 and 2020 heatwaves.

An earlier study also discovered that concurrent heatwaves caused approximately a 4% decrease in crop production worldwide.

The study described large heatwaves as high-temperature events spanning three days or more and covering no less than 1.6 million km2 (around 620,000 square miles), which is approximately equivalent to the size of Iran or Mongolia.

The scientists examined ERA5 data generated by the European Center for Medium-Range Weather Forecasts, which combines massive amounts of observational data from weather stations on land, aircraft and water buoys as well as data from satellites with weather forecasting capacities.

ERA5 offers complete global estimates of hourly data for different climate variables from 1979, when satellite data became available, which is why the research concentrated on this time period.

With this observational data, the scientists learned that the main driver of the heatwaves was the overall increase in global mean temperature because of climate change. The world has warmed 1 °C (about 1.8 °F) over the last 100 years with the vast majority of the increase, two-thirds, happening since 1975.

The team also discovered that increasing incidence of two hemisphere-wide circulation patterns rendered certain areas more susceptible to simultaneous heatwaves, including eastern North America, East Asia, eastern and northern Europe and eastern Siberia.

The research adds more proof for the need to control greenhouse gas emissions and alleviate climate change, the scientists said, and the unrelenting increase in temperature means the world should get ready for more simultaneous heatwaves.

As a society, we are not currently adapted to the types of climate events we’re experiencing right now. It’s important to understand how we can reduce our vulnerability and adapt our systems to be more resilient to these kind of heat events that have cascading societal impacts.

Deepti Singh, Study Co-Author and Associate Professor, School of the Environment, WSU

Besides Rogers and Singh, authors involved in this study include Kai Kornhuber of Columbia University, Sarah Perkins-Kirkpatrick of the University of New South Wales in Australia, and Paul Loikith of Portland State University. This study received support from the National Science Foundation and the Australian Research Council.

Journal Reference:

Rogers, C.D.W., et al. (2021) Six-fold increase in historical Northern Hemisphere concurrent large heatwaves driven by warming and changing atmospheric circulations. Journal of Climatedoi.org/10.1175/JCLI-D-21-0200.1.

Source: https://wsu.edu


Study: Risk of overlapping heat waves grows

 in Northern Hemisphere

Andrew Freedman

AXIOS

A resident splashes water onto their face during a heat wave in Sacramento, Calif., July 8, 2021. 

Photo: David Paul Morris/Bloomberg via Getty Images

The risk of large heat waves happening simultaneously in at least two parts of the Northern Hemisphere is growing due to global warming and its effects on atmospheric circulation, a new study finds.

Why it matters: The study, accepted for publication in the Journal of Climate, adds to concerns about food supply disruptions and other major societal impacts, depending on the location of the concurrent extremes.

Driving the news: The research, led by Cassandra Rogers, a post-doctoral researcher at Washington State University, examined climate data from 1979 to 2019 and found a six-fold increase in the number of simultaneous large heat waves occurring in the Northern Hemisphere warm season between the 1980s and 2010s.

During the same period, the heat events grew in size and intensified. The study was discussed Thursday at a major Earth science meeting in New Orleans.

Details: While heat waves themselves can pose huge risks to human health, with hundreds of deaths attributed to last summer’s Pacific Northwest heat wave, for example, they can also prime the environment for wildfires and affect agriculture.

2019 study by Columbia University’s Kai Kornhuber, a co-author of the new research, found that simultaneous heat waves caused about a 4% decrease in crop production.

That research identified specific patterns of the jet stream, which steers storms, that are associated with heat extremes that tend to occur simultaneously in different breadbasket regions.

One such pattern, for example, can cause heat waves to break out in central North America, Eastern Europe and East Asia, the study found.

What they did: This study quantified large heat waves as periods of three or more days with daily mean temperature greater than the local 90th percentile with a range roughly the size of Mongolia or Iran (about 620,000 square miles).

The researchers were able to show that the primary driver of the increase in simultaneous heat waves is the background warming of the climate, plus warming's influences on atmospheric circulation, through changes in the jet stream, for example.

What they’re saying: "The fact that we know what's happening, we know these events are going to continue to happen, is a real opportunity to actually prevent the deaths that could happen," Rogers told Axios.

"I think it's a little silver lining there, as bad as the predictions are,” she added


41,000 years ago, auroras blazed near the equator

A geomagnetic disruption caused auroras to wander for centuries.
Earth is surrounded by a giant magnetic bubble called the magnetosphere, which is part of a dynamic, interconnected system that responds to solar, planetary and interstellar conditions
. (Image credit: NASA)

If you want to be dazzled by a spectacular northern lights display, your best bet is to skywatch near the North Pole. But that wasn't the case 41,000 years ago, when a disruption of Earth's magnetic field sent auroras wandering toward the equator.

During this geomagnetic disturbance, known as the Laschamp event or the Laschamp excursion, the planet's magnetic north and south weakened, and the magnetic field tilted on its axis and diminished to a fraction of its former strength. This lessened the magnetic pull that normally directs the flow of high-energy solar particles toward the north and south poles, where they interact with atmospheric gases to illuminate night skies as the northern and southern lights.

It took about 1,300 years for the magnetic field to return to its original strength and tilt, and during that time the auroras strayed to near-equatorial latitudes where they are typically never seen, scientists reported on Thursday (Dec. 16) at the annual conference of the American Geophysical Union (AGU), held in New Orleans and online.

This period of intense geomagnetic change may also have shaped changes in Earth's atmosphere that affected living conditions on parts of the planet, presenter Agnit Mukhopadhyay, a doctoral candidate in the Climate and Space Sciences Department at the University of Michigan, said at the AGU conference.

Earth's magnetic field is born in the churning of our planet's molten core. Metallic sloshing near Earth's center and the planet's rotation together generate magnetic poles at the surface in the north and south; magnetic field lines connect the poles in curving arcs. These form a protective zone, also known as the magnetosphere, which shields the planet from radioactive particles from space, according to NASA. The magnetosphere also protects Earth's atmosphere from being worn away by solar wind, or streaming particles blasted outward by the sun.

On the side of Earth that faces the sun (bearing the brunt of the solar wind), the magnetosphere is compressed to approximately 6 to 10 times Earth's radius. On Earth's nighttime side, the magnetosphere streams away into space and can extend for hundreds of Earth-lengths, according to NASA. But about 41,000 years ago, the magnetosphere's strength plummeted "to nearly 4% of modern values" and tilted on its side, Mukhopadhyay said. "Several investigations in the past have predicted that the magnetosphere disappeared completely on the day side," he added.

Mukhopadhyay and his colleagues used a daisy chain of different models to discover this result. They first fed data on the planet's magnetism from ancient rock sediments, as well as volcanic data, into a simulation of the magnetic field during the Laschamp event. They combined this data with simulations of the magnetosphere's interactions with the solar wind, then fed those results into another model that calculated the aurora's location, shape and strength by analyzing parameters of the solar particles that create auroras, such as their ion pressure, density and temperature.

This is the first time that scientists have used this technique "to simulate the geospace system and predict magnetospheric configurations, along with the location of the aurora," Mukhopadhyay said.


Displays such as this one meandered far from their usual locations in northern latitudes, during an event that disrupted Earth's magnetic field for more than 1,000 years.
 (Image credit: Noppawat Tom Charoensinphon/Getty Images)

The team found that even though the magnetosphere shrank to about 3.8 times Earth's radius during the Laschamp event, it never disappeared entirely. During this period of reduced magnetic strength, the poles that were formerly positioned north and south moved toward equatorial latitudes — and the auroras followed them.

"The geomagnetic tilt was significantly skewed from the geographic poles," Mukhopadhyay said. "This led auroral precipitation to follow the magnetic poles and relocate from the geographic polar regions of Earth to equator-ward latitudes."

RELATED CONTENT

In images: Rising 'phoenix' aurora and starburst galaxies light up the skies

Aurora photos: Northern lights dazzle in night-sky images

'Internet apocalypse' could ride to Earth with the next solar storm

Prior studies suggested that the Laschamps event could have affected habitability on prehistoric Earth by plunging the planet into an environmental crisis, and the new models hinted that such an outcome was "highly likely," Mukhopadhyay reported. Earlier this year, other researchers found that a weakened magnetosphere would have been easily penetrated by solar winds, leading to a damaged ozone layer, climate upheaval and extinctions — perhaps even contributing to the disappearance of Neanderthals in Europe, Live Science previously reported.

While their findings don't prove a cause-and-effect relationship between Laschamp's magnetic field changes and serious ecological repercussions on Earth, the models offered insights for future research that could establish such a link, Mukhopadhyay said.
Advertisement

Originally published on Live Science.
Decreased Fungicide Application Causes Decline Of Resistant Fungal Pathogens Indicating Hidden In Field Fitness Costs
By Harry Jones On Dec 18, 2021
Amino acid 198 mutation frequency based on the collection region and the pathogen host. Credit: Michael J. Bradshaw, Holly P. Bartholomew, Dylan Hendricks, Autumn Maust, and Wayne M. Jurick,II

The use of fungicides to treat plant pathogens dates back 150 years, when a mixture of lime and copper sulfate, known as the “Bordeaux mixture,” was used to control fungal diseases in French vineyards. However, as fungicide usage has increased, their efficacy has decreased thanks to a phenomenon known as fungicide resistance.

A new paper in Phytopathology offers an analysis of fungicide resistance, one that came out of COVID-19 shelter-in-place orders. “With the onset of COVID-19, we were brainstorming ways to be productive while not being able to work in the lab,” explained Michael Bradshaw, a plant pathologist with the USDA. “I’m proud that this was the research we came with.”

Bradshaw and colleagues mined genetic data from postharvest pathogens to infer how quickly fungicide resistance develops and analyze the impact of fungicide use.

“What was really interesting is that we noticed a decline in fungicide-resistant pathogens five to ten years after a lag in fungicide usage,” Bradshaw said. “For example, fungicide resistant pathogens peaked between 2005 and 2009, which is five to ten years behind the peak of FRAC 1 fungicide applications.”

Their research also evaluates the global distribution of fungicide-resistant pathogens and determined that host plant, pathogen locality, and pathogen genus are also associated with resistance to certain types of fungicides.

“This study was originally conducted as a resource for countries and farmers reliant on fungicides to control postharvest pathogens,” said Bradshaw. “The compiled data highlights regions and hosts that are most prone to certain resistant pathogens and inform fungicide resistance management strategies.”

Also of note, Bradshaw and his colleagues hypothesize that FRAC1 fungicide-resistant pathogens are less likely to survive in nature when this class of fungicide is not applied, which is contrary to lab-based findings. Future research can evaluate this hypothesis in the field to evaluate FRAC1 class fitness penalties.

New broadly applicable tool provides insight into fungicide resistance

More information:
Michael J. Bradshaw et al, An Analysis of Postharvest Fungal Pathogens Reveals Temporal–Spatial and Host–Pathogen Associations with Fungicide Resistance-Related Mutations, Phytopathology (2021). DOI: 10.1094/PHYTO-03-21-0119-R

Provided by
American Phytopathological Society

Citation:
Decreased fungicide application causes decline of resistant fungal pathogens indicating hidden in field fitness costs (2021, December 17)
retrieved 18 December 2021
from https://phys.org/news/2021-12-decreased-fungicide-application-decline-resistant.html