
October 5, 2022
The Bridge of Sighs (picture below) is an enclosed bridge located in Venice, Italy, which was built in 1603. It connected the city’s courthouse to the city jail. Legend has it that following their conviction, prisoners were escorted through the bridge to the jail. The view from the bridge was their last view of the beauty of Venice, prompting “sighs” from the convicted.

It seems to me that many are becoming resigned to the outlook that yes, the economy is probably heading into recession. I sigh and admit that I now count myself in that group. I crossed the “bridge” recently when the announcement from Federal Express’s CEO that he believes the world is coming into a recession. Federal Express is one of the companies that can be viewed as a “canary in a coal mine.”
FedEx’s reach is global, and their business trends tend to precede other trends. On top of all the other indicators that are suggesting the U.S. economy is coming into recession (if it isn’t already there), the FedEx announcement acted as the last straw. FedEx’s announcement suggests the reach of economic weakness has become global.
Recession Now Top Economic Probability
I have written and publicly suggested my view of a 50% probability of an upcoming recession. I now believe the probability of an upcoming recession is greater than 50%. Recession is now my “main” economic outlook, with the alternative a “soft landing” view in which economic growth remains slow but positive. In the soft landing scenario, the Federal Reserve succeeds in its attempt to bring inflation down without initiating a growth recession. At this time, I find that outcome possible but doubtful.
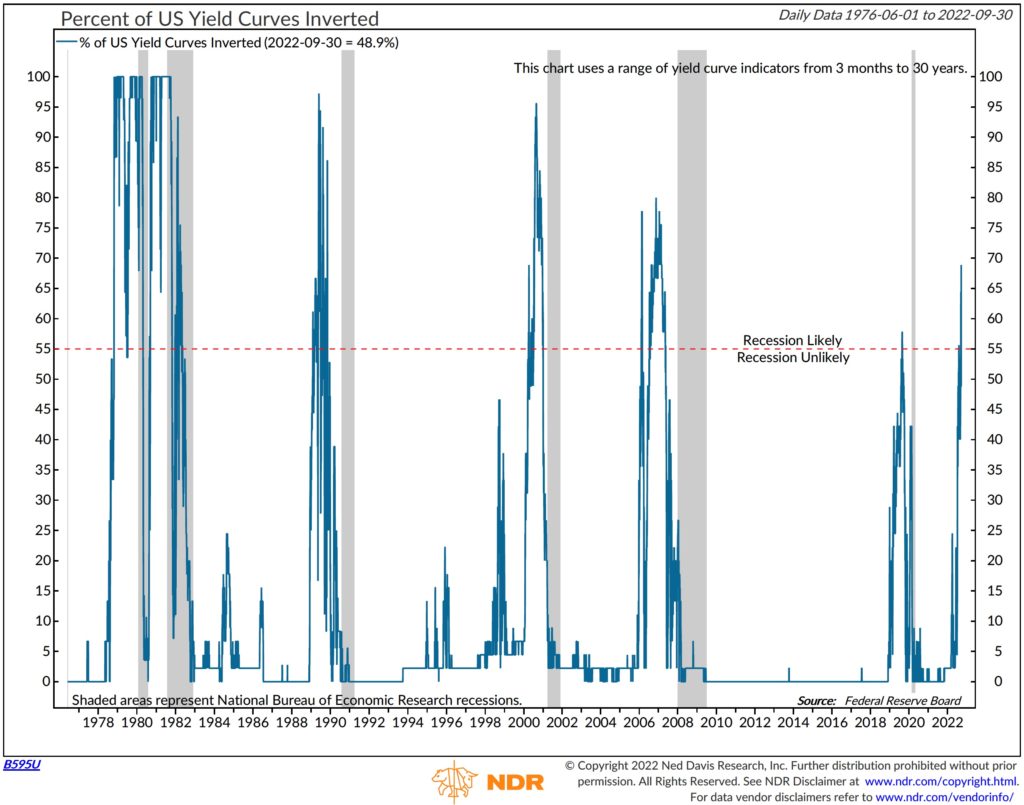
Why do I think we will probably see an economic recession occur over the next 12 months? Two of our three main recession timing indicators are now solidly suggesting a recession is on the horizon. The other (PMI Index) is trending in the wrong direction but has yet to call an outright contraction. Indeed, one of our indicators—shape of yield curve, which went negative six months ago—is widening and broadening. The chart shows the percentage of the U.S. Treasury yield curve that is now inverted. This chart shows that the U.S. economy has, over the last seven business cycles, always fallen into recession when 55% or more of the yield curve inverts. Currently, 62.2% of the curve is inverted, indicating financial stresses are building.
The other factor that has turned negative is the six-month rate of change in the index of leading economic indicators (LEI). This chart clearly shows that the LEI is now lower than it was six months ago. The chart shows periods of previous recessions given the deterioration in the rate of change.
Along with the shape of the yield curve and the data from the LEI, we are seeing a broadening in the weakness of a number of indicators. A weakening in the trend of industrial production output, durable goods orders, “real” retail sales growth and a strong contraction in money supply growth rates suggests growth in the economy is starting to fail.
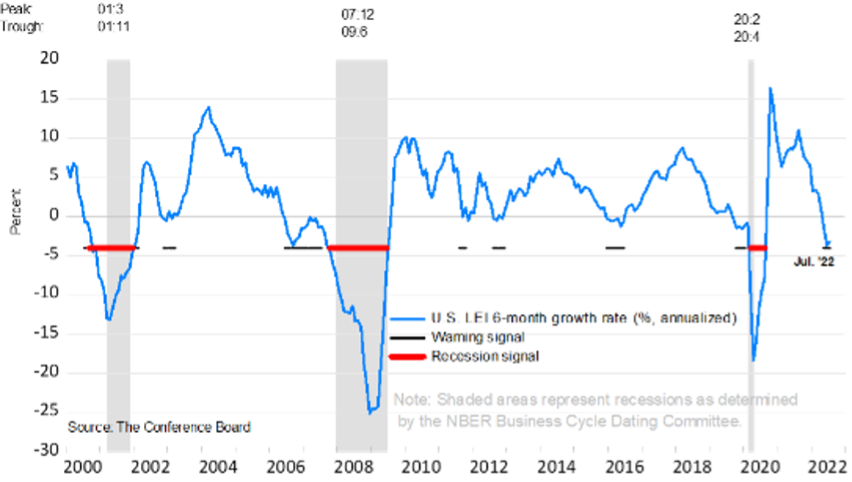
Source: The Conference Board
GDP growth has officially been weak most of this year. According to the Bureau of Economic Analysis, “real” U.S. GDP growth turned negative in the first quarter of this year by -1.6%. It has also reported that real second quarter GDP growth was -0.6%. Some have been suggesting that the U.S. has been in recession all year, citing the thought that recessions occur when we see two back-to-back negative quarterly GDP growth rates.
I have commented on this in detail in prior writings, but according to the National Bureau of Economic Research, which makes “official” recession calls, a recession doesn’t occur because we have seen two negative-growth quarters. By its definition, we see a recession when a contraction occurs in the economy that is deep, broad and long. In its official view, two quarters of negative GDP growth doesn’t enter its definition of recession.
The weakness we saw during the first quarter of this year was driven by weakness in exports and inventory adjustments, both volatile and non-demand-driven factors. Final demand remained positive during the quarter, suggesting the weakness we saw during the first quarter wasn’t broad in scope.
But the trends I am now seeing suggest a weakening in factors that affect growth in final demand. Consider:
Year ChangeQuarterly/Monthly ChangeRetail Sales +9.1% +3.6% Annualized/Quarter
Industrial Production +3.6% -2.4% Annualized/Monthly
Durable Goods Orders +8.8% -2.4% Annualized/Monthly
“Real” Disposable Personal Income Housing Starts -3.7% -6.0% (3-month rate of change)
Source: Ned Davis Research
Some are saying that while real disposable personal income growth isn’t keeping up with inflation, retail sales, which are reported prior to inflation impact, have risen by 9.1% over the last 12 months. How can we fall into recession when retail sales have risen by this amount? That’s a fair question.
But if we consider inflation over that period, real retail sales declined by 0.7% over the last year. If you layer a weak growth rate on top of that, real disposable personal income declined by 3.7% over the last year.1 If real retail sales declined by 0.7% while disposable personal income fell by 3.7%, how did consumers come up with the money to spend?The personal savings rate has fallen by 5.5% year over year. Some consumers have been spending their savings to drive their consumption patterns, which isn’t sustainable.2
Over the last year, credit card debt has risen by 13%. Again, probably not sustainable over the long-term.2
Aside from our main recession-monitoring tools, the evidence of an economic slowdown is upon us, and I would argue the evidence is broadening not narrowing.
With all that being said, what is my forecast for GDP growth and inflation as we prepare to enter 2023?
Long-Term Average2022 Forecast2023 ForecastU.S. “Real” GDP Growth +3.1% +1.0% -1.0%
Consumer Prices +3.7% +6.5% +3.5%
“Nominal” GDP Growth +6.8% +7.5% +2.5%
Unemployment Rate 5.7% 4.0% (year-end) 5% (year-end)
Source: stlouisfed.org. Long-term average based on data from 1948 – 2021.
The holdout in this poor economic tale is the jobs market, which still shows strength (now at 3.7%;3 a very low number given the long-term average noted above). Something we need to consider: Jobs are the last thing businesses tend to cut when entering a weak period and the last thing added when things are good. Job data tends to be a lagging indicator.
That being said, if my concerns are justified, and we do enter a recession, I believe there is ample evidence that suggests the recession will be mild and rather short. The employment data supports this view, as I believe the jobs market, while weakening, probably won’t see the downturn with large layoffs as we saw during the deep, hard recession of 2008-2009 when the unemployment rate exceeded 10%.4
I expect to see a trough unemployment level of less than 6% next year.
Fed Policy Becoming Restrictive
Before we wrap up the recession issue, I need to comment on Fed policy. The Fed will continue to raise rates until they reach their federal funds “terminal” rate (now at 4.5%, per Fed data). I suggest the Fed will reach its terminal fed funds rate following its December meeting later this year.
Does the risk of recession go away at that time? No. Remember, it takes six to 12 months for Fed policy changes to be felt by the “Main Street” economy. We in the financial market business experience this impact almost immediately but the economy doesn’t. I suspect much of the Fed’s policy decisions won’t be fully felt by the economy until the first half of next year. It has now been six months since the first Fed rate increase, which occurred in March of this year. Main Street is just now facing the impact of those rate increases, as the impact will probably be felt until at least the second quarter of next year.
As the Fed continues down the path of raising interest rates (I am suggesting the fed funds rate will eclipse 4% by the end of this year, up from the current 3.12%), money supply growth will move into contraction and liquidity will be withdrawn from the financial system.
This withdrawal is already happening. The latest data from the St. Louis Federal Reserve shows that M2 “real” supply has declined by 5.1% over the last quarter on an annualized basis. Historically, the long-term average real growth rate of money supply has been +3.2%. As supply of money declines, prices (interest rates) rise, which slows the growth in demand for capital and economic activity contracts.
The Fed has made it clear it is willing to risk a short-term economic downturn to win the inflation battle. This is the Fed’s plan, and it is unfolding before our eyes.
Balancing the Imbalance
As I have often said in the past, recessions are part of the business cycle and occur for a reason—something in the economy is out of balance and needs to be corrected. We have too much or too little of something. This time around, we have too much inflation and that needs to be purged from the system. I see inflation as the culprit, the imbalance, if you will, as the driver of the probable upcoming contraction.
The silver lining to the Fed’s tightening monetary policy is yes, inflation rates should decline. It is the cure for the imbalance. As we see improvement in the inflation data, the Fed will change gears. I suspect the Fed will keep interest rates higher longer than some are currently expecting, as it is centered on not making the same mistake the Fed made in the 1970s by becoming prematurely loose with policy.
I continue to believe the upcoming recession (if indeed we see one) will be of the “income statement” variety. As noted, recessions occur for reasons, and the reason this time around is centered on inflation, an economic income statement issue. Historically, income statement recessions (1973, 1982, 1990) tend to be more shallow and quicker than “balance sheet”-oriented recessions (2008, as an example).
If my timing is reasonable, I expect to see the U.S. economy out of recession by the middle-to-end of 2023, and inflation back down in the 3%+ range.
l sigh and wait for better days.
Sources:
1St. Louis Federal Reserve
2Ned Davis Research
3U.S. Bureau of Labor Statistics, Sept. 2, 2022 press release
4St. Louis Federal Reserve
BOILER PLATE
This commentary is limited to the dissemination of general information pertaining to Mariner Wealth Advisors’ investment advisory services and general economic market conditions. The views expressed are for commentary purposes only and do not take into account any individual personal, financial, or tax considerations. As such, the information contained herein is not intended to be personal legal, investment or tax advice or a solicitation to buy or sell any security or engage in a particular investment strategy. Nothing herein should be relied upon as such, and there is no guarantee that any claims made will come to pass. Any opinions and forecasts contained herein are based on information and sources of information deemed to be reliable, but Mariner Wealth Advisors does not warrant the accuracy of the information that this opinion and forecast is based upon. You should note that the materials are provided “as is” without any express or implied warranties. Opinions expressed are subject to change without notice and are not intended as investment advice or to predict future performance. Past performance does not guarantee future results. Consult your financial professional before making any investment decision.
Mariner Wealth Advisors (“MWA”), is an SEC registered investment adviser with its principal place of business in the State of Kansas. Registration of an investment adviser does not imply a certain level of skill or training.MWA is in compliance with the current notice filing requirements imposed upon registered investment advisers by those states in which MWA maintains clients. MWA may only transact business in those states in which it is notice filed or qualifies for an exemption or exclusion from notice filing requirements. Any subsequent, direct communication by MWA with a prospective client shall be conducted by a representative that is either registered or qualifies for an exemption or exclusion from registration in the state where the prospective client resides. For additional information about MWA, including fees and services, please contact MWA or refer to the Investment Adviser Public Disclosure website. Please read the disclosure statement carefully before you invest or send money.
No comments:
Post a Comment