March 8 (UPI) -- NASA said Friday the Europa Clipper Jupiter mission set to launch in October will carry profound messages from humanity as it gathers scientific data to determine if there are life-supporting conditions.
The Europa Clipper spacecraft will be headed for Jupiter's moon, Europa.
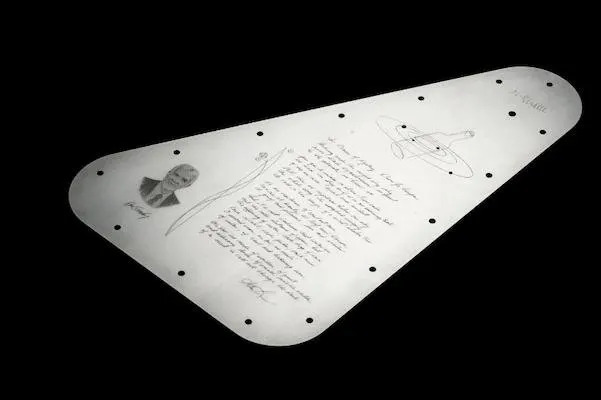
In addition to scientific instruments for experiments and data collection, it will include an engraving of U.S. Poet Laureate Ada Limon's handwritten "In Praise of Mystery: A Poem for Europa."
A silicon chip with more than 2.6 million names submitted by the public is included as the centerpiece of a bottle amid the Jovian system, a reference to NASA's "Messaged In a Bottle Campaign" that invited those names to be submitted.
A 7 by 11 inch plate made of the metal tantalum features waveform engravings of the word "water" in 103 languages.
It includes the Drake Equation etched onto the plate.
That's Astronomer Frank Drake's mathematical formulation from 1961 to estimate the possibility of finding advanced extraterrestrial civilizations.
"We've packed a lot of thought and inspiration into this plate design, as we have into this mission itself," said NASA Project Scientist Robert Pappalardo in a statement. "It's been a decades-long journey, and we can't wait to see what Europa Clipper shows us at this water world."
According to NASA, the main science goal of the mission is to determine whether there are places below Jupiters icy moon Europa that might support life.
The spacecraft will try to determine the thickness of the icy shell on that moon and its surface interactions with the ocean below it. The composition of the ice will also be investigated in an effort to characterize its geology.
The Europa Clipper will fly by Jupiter's moon 50 times to gather the data. If successful the mission will help scientists understand ocean worlds like Europa
Europa Clipper: NASA Reveals Design For Message Being Sent To One Of Jupiter's Moons
BY TREVIN CHRISTIAN CASINADER
The spacecraft will follow NASA’s tradition and carry an inspirational message on its mission to survey Europa’s ability to support life.
SUMMARY
Europa Clipper will explore Jupiter's moon Europa for signs of life with an array of scientific instruments by 2030.Unique messages on the triangular plate aboard Clipper include waveforms of "water" in different languages on the outer side of the platePoem by Ada Limón, a microchip with 2.6 million people's names, and a tribute to founder Ron Greeley on the inner side of the plate.
The Europa Clipper will launch in October and head towards Jupiter's moon Europa. The moon has shown strong evidence of an ocean existing underneath its icy crust. Scientists estimate that the ocean on Europa holds twice as much water as Earth's oceans combined.
The mission
The spacecraft is headed to Europa to determine if the moon's conditions can support life. It is estimated to reach Europa in 2030 after traveling 1.6 billion mi (2.6 billion km). Once within range, the spacecraft will do this through a series of 49 close flybys.
On board is an array of scientific instruments that can gauge the moon's status from orbit. The instruments will determine the thickness of the icy crust and its surface interactions with the ocean below. The Clipper will also investigate the ocean's composition and the moon's geology. The data will help scientists understand the moon's potential to habituate life.
The message
The Europa Clipper will continue in NASA's tradition of sending messages into space. Similar to the Voyager's Golden Record, which carries sounds and images from Earth for potential spacefaring travelers.
The Europa Clipper's message is etched onto a triangular plate measuring 7 by 11 in (18 by 28 cm). The plate features elements on both sides. The commemorative plate will seal the opening of the massive vault, which holds all the scientific equipment of the Europa Clipper.
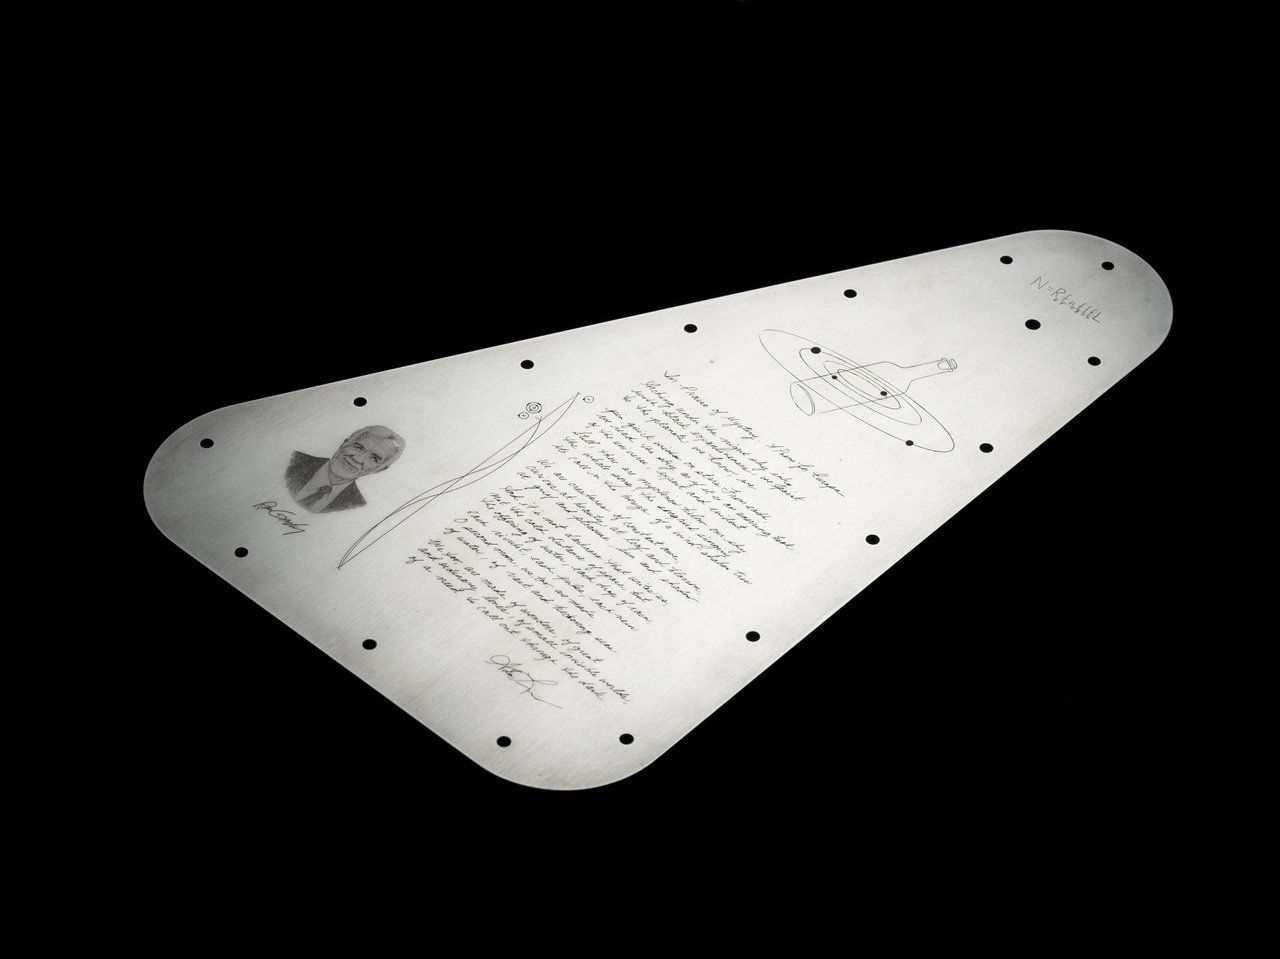
Photo: JPL-Caltech | NASA
Lori Glaze, director of the Planetary Science Division at NASA Headquarters in Washington, spoke about the significance of the plate:
"The content and design of Europa Clipper's vault plate are swimming with meaning. The plate combines the best humanity has to offer across the universe – science, technology, education, art, and math. The message of connection through water, essential for all forms of life as we know it, perfectly illustrates Earth's tie to this mysterious ocean world we are setting out to explore."
On one inner side of the plate, the center is adorned by the handwritten poem "In Praise of Mystery: A Poem for Europa" by US Poet Laureate Ada Limón. Above the poem is an image of a bottle amid the Jovian system. A microchip featuring the names of 2.6 million people will be fitted in the middle of the bottle. The names have been chosen from NASA's Message in a Bottle campaign, which invited the public to submit their names to be sent into space.
The Drake Equation, which estimates the possibility of finding advanced civilizations beyond Earth, is also etched into this inner side of the plate. Astronomer Frank Drake developed the equation, which has inspired and guided astrobiology since then.
In addition, it features a portrait of Ron Greeley, one of the founders of planetary science and one of the scientists who helped develop the foundation for the mission more than 20 years ago. Finally, this side of the plate also features how NASA monitors radio frequencies for messages from space. The frequencies etched on the plate match the waves emitted by Hydrogen and Oxygen. They are depicted as emission lines.
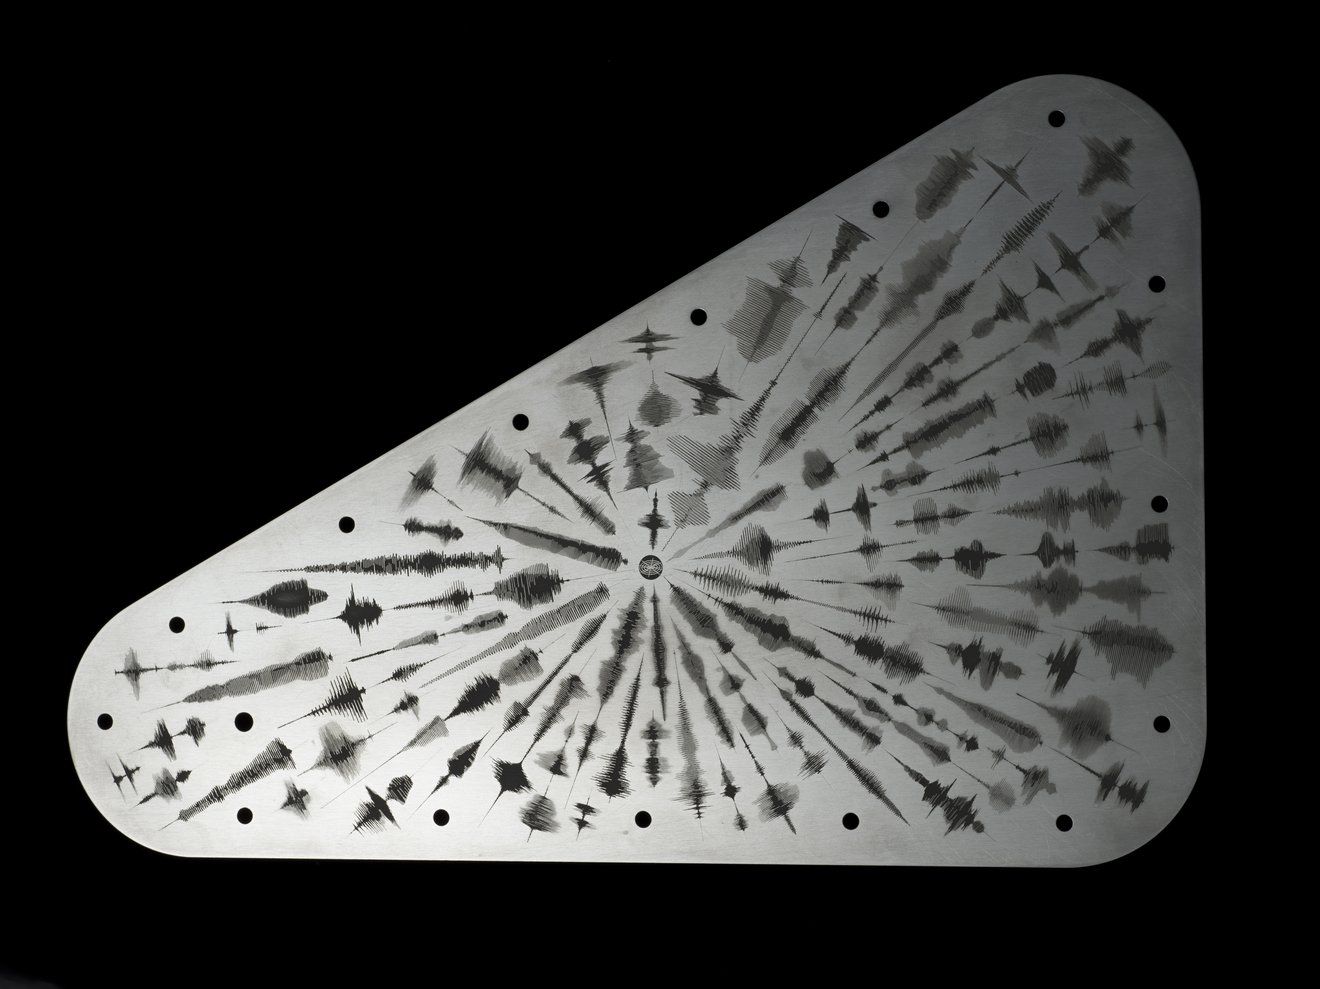
Photo: JPL-Caltech | NASA
The outward-facing side features a collection of waveforms (visual representations of sound) of the word "water" spoken in 103 languages from families worldwide. The waveforms radiate outward from the center, where the American Sign Language symbol for "water" resides.
"We don't know why that place has that kind of an anomaly."
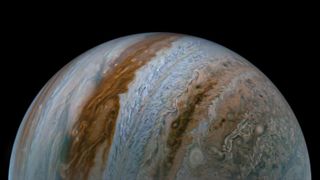
The mysterious workings of Jupiter's intense magnetic field are coming to light, thanks to a tiny jet buried deep in the gas giant's atmosphere. Every four years, this jet appears to fluctuate like a wave.
While it's not yet clear what drives this atmospheric jet, new findings reveal some clues about the invisible, complex workings of an intense area of magnetism near Jupiter's equator, dubbed the "Great Blue Spot." This region isn't actually blue; the name comes from the color scale scientists use to build maps of Jupiter's magnetic field. Unlike Earth's magnetic field, the gas giant's field is not symmetric with its rotational axis — this asymmetry is so pronounced, in fact, that the Great Blue Spot can even be likened to a second south pole poking out from the planet's equator. It also appears part of the region is getting swept westward by one jet while other parts are being tugged at by winds flowing eastward.
"It's a mystery," Yohai Kaspi, a professor of Earth and planetary sciences at the Weizmann Institute of Science in Israel and a co-investigator of NASA's Juno mission, told Space.com "We don't know why that place has that kind of an anomaly."
How deep is Jupiter's Great Red Spot? NASA's Juno mission explores
In a paper published Wednesday (March 6) in Nature, however, scientists may have offered some more insight into the Great Blue Spot. They used data sent home from the Juno probe, presently investigating Jupiter, as it had mapped the Great Blue Spot during a series of targeted flybys conducted during its extended mission. Much like ocean waves that change their speed as they move, the new finding suggests there may be wave-like behavior deep inside Jupiter's metallic core that could power the observed magnetic field, study lead author Jeremy Bloxham of Harvard University told BBC Science Focus.
"These changes can be explained in large part by an eastward drift of the spot, but, as reported in this paper, that rate of drift is fluctuating."
A map of Jupiter's magnetic field highlighting the anomalous Great Blue Spot near the planet's equator. (Image credit: NASA/JPL-Caltech/SwRI/John E. Connerney)
Scientists previously knew this cluster of intense magnetic fields drift more than anywhere else on the gas planet, thanks to strong winds blowing right from its turbulent "surface" to 1,860 miles (3,000 kilometers) deep. At that deepest point, Jupiter's intense magnetic field is thought to dampen these winds.
The newfound jet may even be drifting at a miniscule scale of tens of centimeters per second in that area, as opposed to other jets on the surface which travel many times faster.
RELATED STORIES:
— Uranus grows a smoggy cap while Jupiter's Red Spot keeps shrinking, Hubble telescope reveals (photos)
— Something weird is happening in Jupiter's atmosphere, 40-year study shows
— Jupiter's Great Red Spot is even deeper than scientists had thought
Still, the finding is a "very marginal measurement," said Kaspi, who was not involved with the paper. He says it's better thought of as an initial result within the noise threshold as scientists don't yet have enough data to conclude the jet fluctuates precisely every four years.
"If your data is just from five years, you can't really say anything about a four-year period."
More observations from Juno could deliver certainty soon, which would ultimately help scientists better understand the dynamo that powers Jupiter's complex magnetic field.
A rapidly time-varying equatorial jet in Jupiter’s deep interior
Nature 627, 64–66 (2024)
Abstract
Planetary magnetic fields provide a window into the otherwise largely inaccessible dynamics of a planet’s deep interior. In particular, interaction between fluid flow in electrically conducting interior regions and the magnetic field there gives rise to observable secular variation (time dependency) of the externally observed magnetic field. Secular variation of Jupiter’s field has recently been revealed1,2,3 and been shown to arise, in part, from an axisymmetric, equatorial jet2. Whether this jet is time dependent has not previously been addressed, yet it is of critical importance for understanding the dynamics of the planet’s interior. If steady, it would probably be a manifestation of deep dynamo convective flow (and jets are anticipated as part of that flow4,5,6,7,8,9) but if time dependent on a timescale much shorter than the convective turnover timescale of several hundred years, it would probably have a different origin. Here we show that the jet has a wavelike fluctuation with a period of roughly 4 years, strongly suggestive of the presence of a torsional oscillation10 (a cylindrically symmetric oscillating flow about the rotation axis) or a localized Alfvén wave in Jupiter’s metallic hydrogen interior. This opens a pathway towards revealing otherwise hidden aspects of the magnetic field within the metallic hydrogen region and hence constraining the dynamo that generates Jupiter’s magnetic field.
Main
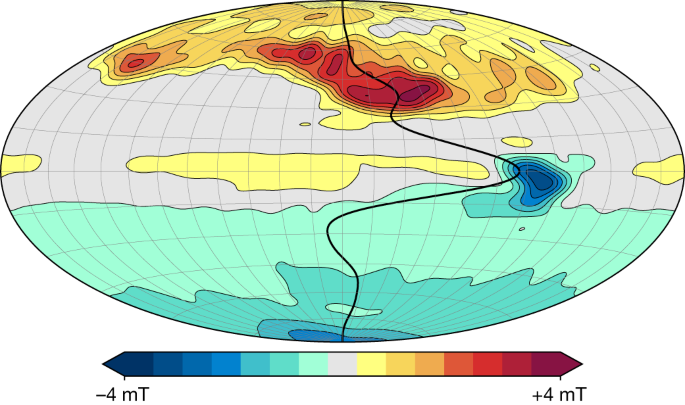
In Fig. 1, we superimpose a steady, axisymmetric, zonal flow profile on a background map of the magnetic field2 derived from Juno magnetic field observations11 from the spacecraft’s first 33 orbits. The flow is dominated by an equatorial jet, which induces intense secular variation in the vicinity of the Great Blue Spot (the region of concentrated field at the equator) as the magnetic field associated with this spot is swept eastwards. Owing to its dominant role in generating the secular variation1,2,3,12, a recent set of orbits by the Juno spacecraft13 was targeted at this region.
The projection is Hammer equal-area with the central meridian at 180° in System III coordinates (highlighted in grey); the central meridian is the zero line for the steady flow. The colour scale for the background magnetic field model is linear between the indicated limits. The flow velocity is scaled with latitude to account for the poleward convergence of meridians; the peak velocity (corresponding to the equatorial jet) is 0.86 cm s−1.
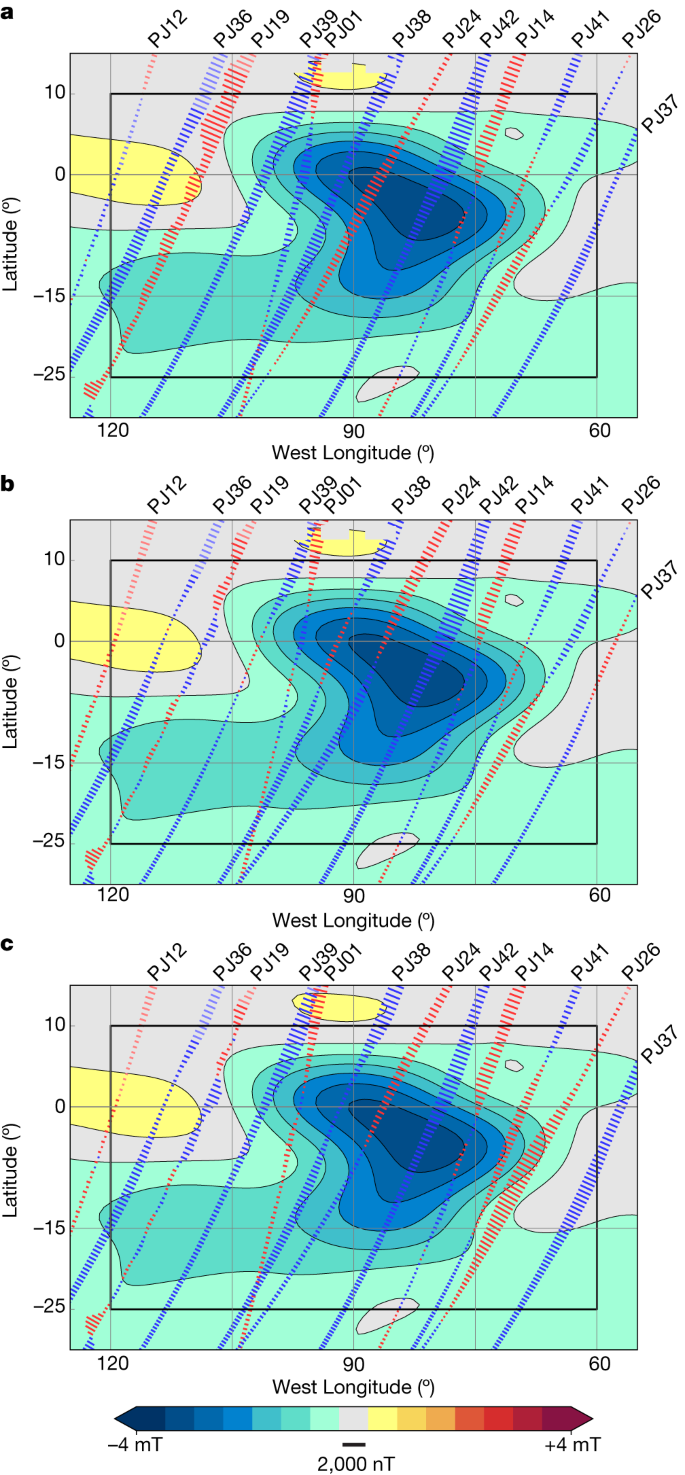
To begin, we produce a new model including the magnetic field observations from these targeted passes (and other subsequent orbits over other regions of the planet). The model is produced using the same method as the model in Fig. 1 (Methods and ref. 2). One pass, PJ02 (in which PJ stands for perijove), did not acquire any data, so the number of data-yielding orbits is 41 compared with 32 orbits for the earlier model; note we refer to these models in terms of the last orbit used, that is, the 33-orbit model (Fig. 1) and the 42-orbit model. The resulting 42-orbit model has a global misfit of 492 nT compared with 411 nT for the 33-orbit model (for comparison, the root-mean-square (r.m.s.) field strength of the observations is 282,000 nT); within a box around the spot (Fig. 2) the misfit is 934 nT compared with 675 nT (where the r.m.s. field strength is 393,000 nT) and the maximum speed of the equatorial jet is 0.64 cm s−1 compared with 0.86 cm s−1. Thus, the fits we obtain to the 42-orbit dataset are poorer than those to the earlier 33-orbit dataset, especially near the spot, indicating that a steady flow performs worse as the time interval spanned by the passes increases. We may have expected, instead, that with the addition of these later passes that the misfit would decrease because these passes are at higher altitude over the spot and hence sample weaker field. Except for the southern hemisphere south of 30 °S, where the flow resolution is poor2, the flow profiles are broadly similar; however, the equatorial jet speed is reduced by 26% in the 42-orbit solution, suggesting that the flow may be changing with time. The pattern of residuals in Fig. 2a lends additional support to this possibility: we can identify pairs of passes that are spatially adjacent but separated in time that have oppositely signed residuals over the spot, notably PJ19 and PJ36, and PJ24 and PJ38. Oppositely signed residuals will result for adjacent passes if the actual flow speed at the time of the passes is greater than the steady flow solution for one pass and smaller for the other.
The residuals (the difference between the observation and the model prediction), calculated every 15 s, are plotted along the track, with positive residuals plotted west of the track (in red) and negative residuals east of the track (in blue) as the spacecraft passes through periapsis from north to south. The radial component of the magnetic field model is shown in the background. The projection is cylindrical with a grid spacing of 15°; the equator is highlighted in grey. The residuals are calculated within the box shown in black. The colour scale is linear between the indicated limits and the bar below the colour scale depicts the residual scale. a, The residuals from the 42-orbit steady flow model. b, The residuals from the 42-orbit steady flow model after applying the pass-by-pass velocity scale factors. c, The residuals from the 42-orbit steady flow model after applying the sinusoidal flow time-variation model.
To examine the possibility that the flow speed is varying, we allow the flow to vary in amplitude on a pass-by-pass basis. We do this by applying a velocity scale factor to the flow for each pass (Methods). The velocity scale factor does not change the flow profile, instead it simply scales its amplitude. By doing so, we find the adjusted flow speed that gives the best fit for a particular pass, but for a different pass that flow speed will probably be different. These adjusted flow speeds represent the average flow speed from the baseline epoch of 2016.5 for each particular pass. In Fig. 2b we show the residuals after applying velocity scale factors to each pass. The residuals are reduced, especially for passes to the west of the spot. The misfit within the box is 721 nT, a variance reduction of 40% from the steady flow solution. This variance reduction can be considered as the maximum that can be achieved simply by varying the flow speed. However, this variation is only physically reasonable if we can find a time-varying flow consistent with the pass-by-pass velocity scale factors, in other words a time-varying flow that yields the corresponding average flow speed for each pass. It is possible, instead, that the different velocity scale factors (or average flow speeds) are mutually inconsistent.
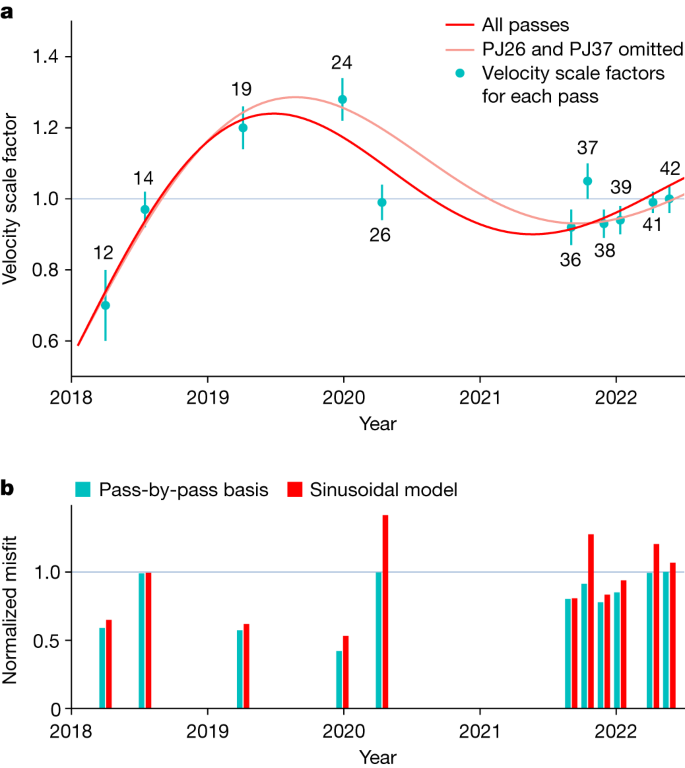
We examine whether such a flow exists by fitting the pass-by-pass velocity scale factors with a simple sinusoidally varying flow model with a single period and no damping (Methods). We omit PJ01 from this analysis as that orbit passes over the spot less than 2 months after the baseline epoch and thus is insensitive to variations in the flow (the flow would advect the spot by less than 0.05° during those 2 months). The best-fit solution is shown in Figs. 2c and 3: it has a period of 3.8 years and results in a variance reduction within the box of 24.8%. As expected, the variance reduction on a pass-by-pass basis varies substantially (Fig. 3b), as those passes with velocity scale factors that differ substantially from unity will have their fit enhanced more than a pass with a factor close to unity. Note that Fig. 3 shows the residuals to the radial component of the field, rather to the three components of the magnetic field, as the radial component is more readily interpreted in terms of changes in the flow speed. In a few cases, though, other components of the field show a much larger reduction in misfit than the radial component, most particularly Bϕ (the east component of the magnetic field) for PJ24. In other words, there is not necessarily a one-to-one correspondence between the residuals in Fig. 2 and the variance reductions in Fig. 3. Comparing Fig. 2a with 2c, we can see that the residuals of the pairs of passes discussed earlier (PJ19 and 36, and 24 and 38) are much reduced. For most passes, the red bars in Fig. 3b (the normalized misfits to the sinusoidal model) are below the grey line corresponding to 1 (the normalized misfit of the 42-orbit steady flow model), but two passes (PJ26 and PJ37) stand well-above the grey line indicating that they are fit worse by the sinusoidal model than by the 42-orbit steady flow model. These two passes are the most easterly passes within the box. PJ37 requires a flow speed almost 15% more rapid than that of PJ36 and PJ38, which though temporally adjacent to PJ37 are not spatially adjacent to PJ37, indicating that additional spatial complexity in the flow may be required. PJ26 is, instead, fit by a slower flow than the sinusoidal model arguing instead for additional temporal complexity. Additional complexity could take the form of more than one wave being present or wave damping. In case our results are skewed by these two passes, we repeat the sinusoidal fit omitting them, as shown by the light red curve in Fig. 3a. The fit to most of the remaining passes, in particular PJ24 and the targeted passes (PJ36, PJ38, PJ39, PJ41 and PJ42) is improved. The period of the sinusoidal fit is changed by only a small amount from 3.8 to 4.1 years.
a, The cyan symbols represent the velocity scale factors for each pass. The error bars represent one standard deviation (Methods). The red curve shows the sinusoidal fit using all the passes and the light red curve the fit omitting PJ26 and PJ37 (for details of the fit, see Methods, equation (12). b, The misfit to each pass, normalized by the misfit to the 42-orbit steady flow model. The cyan bars represent the normalized misfit after applying velocity scale factors on a pass-by-pass basis; the red bars represent the normalized misfit after applying the sinusoidal model. In both panels, we depict the 42-orbit steady flow model by a horizontal line. a, The line corresponds to the unadjusted velocity of the 42-orbit steady flow model, in other words a velocity scale factor of unity for all passes. b, The horizontal line shows a misfit of 1, as the misfits have been normalized to the 42-orbit steady flow model.
The period of roughly 4 years suggests that this is a torsional oscillation or Alfvén wave rather than, for example, a MAC (magnetic-Archimedean-Coriolis) wave14, which would have a much longer period. Torsional oscillations have also been proposed as the origin of cloud level variability in Jupiter on subdecadal timescales15: the zonal shear associated with a torsional oscillation may modulate the heat flux from the deep interior, which may in turn result in variability of observed infrared emissions at cloud level. The wave speed of torsional oscillations is determined by the r.m.s. value of the component of the magnetic field, , perpendicular to the rotation axis10 (where the average is taken over longitude and the latitude band of interest). For an equatorial belt of ±10° about the equator (the latitudinal extent of the deep equatorial jet), we find mT at 0.9 RJ. This corresponds to an Alfvén wave speed of 10−2 ms−1.
The period of the oscillation depends, of course, on its wavenumber k, for which we have no direct observation. If the cloud level variability is due to torsional oscillations, then the wavenumber can be estimated from the length scale of those variations, yielding dimensionless wavenumbers kRJ/2π in the range 10 to 15 (ref. 15). Here, however, we are examining a single equatorial fluctuation rather than a set of torsional oscillations spanning a wide range of latitudes. For the equatorial jet, a dimensionless wavenumber of 10 could be considered (although this would be based on the azimuthal extent of the jet rather than its wavenumber in the s direction) yielding a period of roughly 15 years: that is, four times longer than that found here.
However, our estimate of may be too small: the field is most probably stronger at depths below 0.9 RJ, but the field below that depth cannot be reliably estimated from the externally observed potential field owing to the rapid increase of electrical conductivity with depth16; and second, intense, small scale magnetic fields (which will be geometrically attenuated in the observations at satellite altitude) may serve to increase further.
A period of 4 years corresponds to a field strength mT, similar to the field strength associated with the spot itself, so the wave may instead be a localized Alfvén wave propagating along the field lines associated with the spot (which are largely in the s direction), rather than an axisymmetric torsional oscillation, in which case a superimposed longer period torsional oscillation may then also be exciteMethods
Data availability
All data used in this study are available from the NASA Planetary Data System (https://pds.nasa.gov). The 42-orbit model can be downloaded from https://doi.org/10.7910/DVN/HFFI7A. Source data are provided with this paper.
Code availability
Example code to read the 42-orbit model can be downloaded from https://doi.org/10.7910/DVN/HFFI7A.
References
Moore, K. M. et al. Time variation of Jupiter’s internal magnetic field consistent with zonal wind advection. Nat. Astron. 3, 730–735 (2019).
Bloxham, J. et al. Differential rotation in Jupiter’s interior revealed. J. Geophys. Res. Planets 127, e2021JE007138 (2022).
Connerney, J. E. P. et al. A new model of Jupiter’s magnetic field at the completion of Juno’s prime mission. J. Geophys. Res. Planets 127, e2021JE007055 (2022).
Busse, F. H. A simple model of convection in the Jovian atmosphere. Icarus 29, 255–260 (1976).
Christensen, U. R. Zonal flow driven by deep convection in the major planets. Geophys. Res. Lett. 28, 2553–2556 (2001).
Aurnou, J. M. & Olson, P. L. Strong zonal winds from thermal convection in a rotating spherical shell. Geophys. Res. Lett. 28, 2557–2559 (2001).
Heimpel, M., Aurnou, J. & Wicht, J. Simulation of equatorial and high-latitude jets on Jupiter in a deep convection model. Nature 438, 193–196 (2005).
Gastine, T., Wicht, J., Duarte, L., Heimpel, M. & Becker, A. Explaining Jupiter’s magnetic field and equatorial jet dynamics. Geophys. Res. Lett. 41, 5410–5419 (2014).
Yadav, R. K., Heimpel, M. & Bloxham, J. Deep convection–driven vortex formation on Jupiter and Saturn. Sci. Adv. 6, eabb9298 (2020).
Taylor, J. B. The magneto-hydrodynamics of a rotating fluid and the Earth’s dynamo problem. Proc. R. Soc. London. Series A. Math. Phys. Sci. 274, 274–283 (1963).
Connerney, J. E. P. et al. The Juno magnetic field investigation. Space Sci. Rev. 213, 39–138 (2017).
Sharan, S. et al. The Internal structure and dynamics of Jupiter unveiled by a high-resolution magnetic field and secular variation model. Geophys. Res. Lett. 49, e2022GL098839 (2022).
Bolton, S. J. et al. The Juno mission. Space Sci. Rev. 213, 5–37 (2017).
Hide, R. Free hydromagnetic oscillations of the Earth’s core and the theory of the geomagnetic secular variation. Phil. Trans. R. Soc. London. Series A Math. Phys. Sci. 259, 615–647 (1966).
Hori, K., Jones, C. A., Antuñano, A., Fletcher, L. N. & Tobias, S. M. Jupiter’s cloud-level variability triggered by torsional oscillations in the interior. Nat. Astron. 7, 825–835 (2023).
French, M. et al. Ab initio simulations for material properties along the Jupiter Adiabat. Astrophys. J. Suppl. Series 202, 5 (2012).
Roberts, P. H. & Scott, S. On analysis of the secular variation. J. Geomagnet. Geoelectric. 17, 137–151 (1965).
Langel, R. A. & Estes, R. H. Large-scale, near-field magnetic fields from external sources and the corresponding induced internal field. J. Geophys. Res. Solid Earth 90, 2487–2494 (1985).
Jackson, A. & Bloxham, J. Mapping the fluid flow and shear near the core surface using the radial and horizontal components of the magnetic field. Geophys. J. Int. 105, 199–212 (1991).
Acknowledgements
We acknowledge support from the NASA Juno project.
Author information
Authors and Affiliations
Contributions
J.B. conceived the study, analysed the data and wrote the manuscript. H.C. contributed to the study through numerous discussions and suggestions. D.J.S. (chair of the Juno Interiors Working Group), J.P.E.C. (Juno mission deputy principal investigator and magnetometer lead scientist) and S.J.B. (Juno mission principal investigator) contributed to the writing and editing of the manuscript.
Corresponding author
Ethics declarations
Competing interests
The authors declare no competing interests.
Peer review
Peer review information
Nature thanks Chris Jones and the other, anonymous, reviewer(s) for their contribution to the peer review of this work.
Additional information
Publisher’s note Springer Nature remains neutral with regard to jurisdictional claims in published maps and institutional affiliations.
Source data
Rights and permissions
Open Access This article is licensed under a Creative Commons Attribution 4.0 International License, which permits use, sharing, adaptation, distribution and reproduction in any medium or format, as long as you give appropriate credit to the original author(s) and the source, provide a link to the Creative Commons licence, and indicate if changes were made. The images or other third party material in this article are included in the article’s Creative Commons licence, unless indicated otherwise in a credit line to the material. If material is not included in the article’s Creative Commons licence and your intended use is not permitted by statutory regulation or exceeds the permitted use, you will need to obtain permission directly from the copyright holder. To view a copy of this licence, visit http://creativecommons.org/licenses/by/4.0/.

No comments:
Post a Comment