GREENWASHING FROM VISUAL CAPITALIST
CANADIAN INVESTMENT IN URANIUMYOU MAY OR MAYNOT FIND THESE ATTRIBUTED IN MSM
Uranium: Powering the Cleanest Source of Energy

Published 12 hours ago
on August 19, 2021
By Sponsored Content
The following content is sponsored by the Sprott Physical Uranium Trust
Uranium: Powering the Cleanest Source of Energy
The world’s energy needs are growing with its population. However, achieving a net-zero carbon economy while meeting our growing energy needs requires a larger role for clean, sustainable, and reliable sources. Nuclear is one such energy source.
The above graphic from the Sprott Physical Uranium Trust highlights how uranium is powering one of the cleanest and most reliable sources of energy in nuclear power.
The Cleanest Energy Sources
Although all energy sources have tradeoffs, some are better for the environment than others.
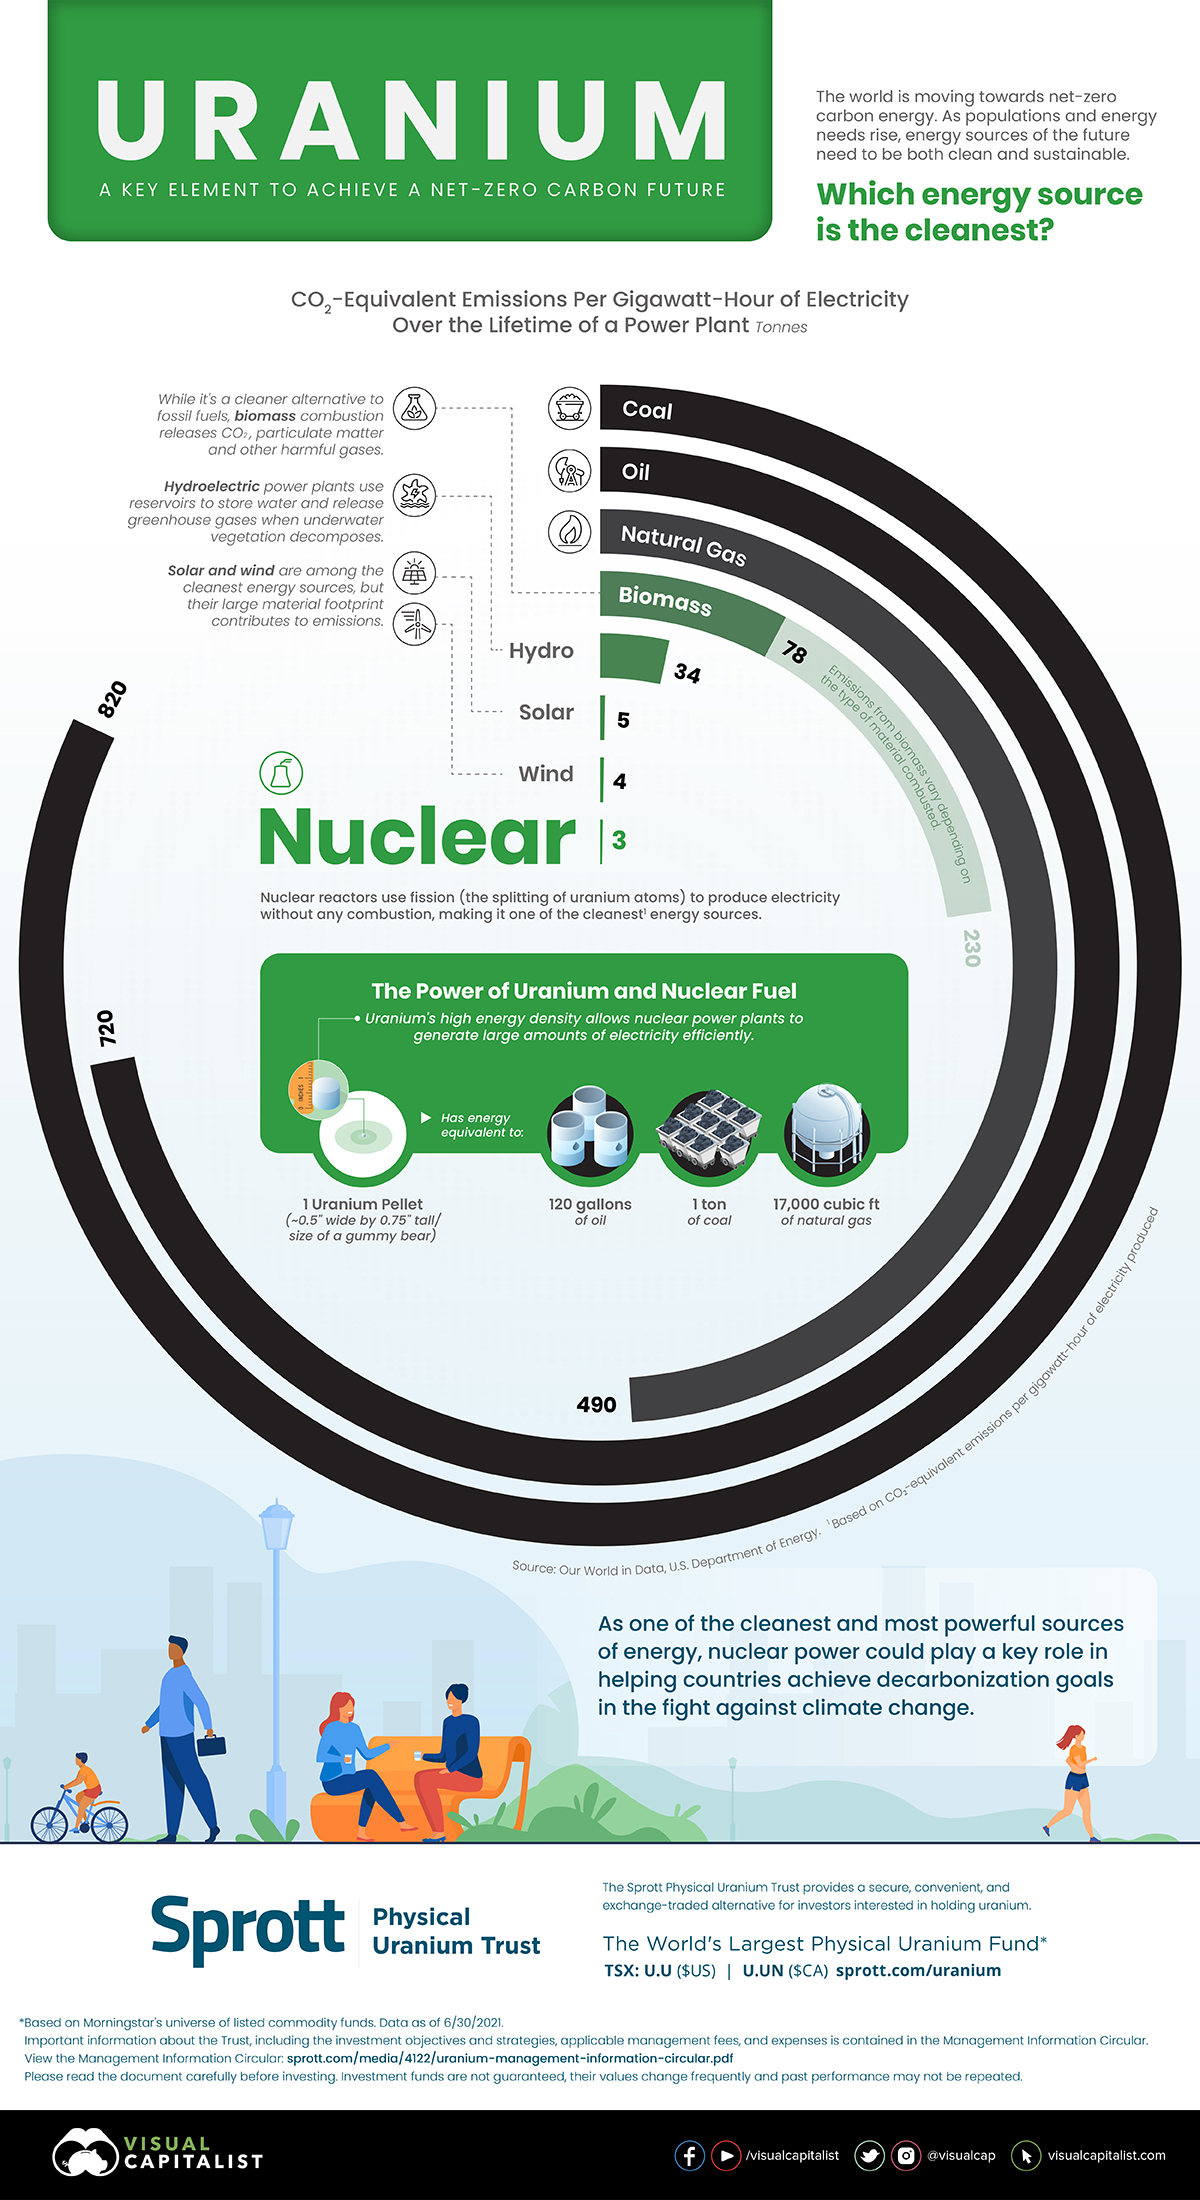
To find the cleanest sources of energy, Our World in Data calculated CO2-equivalent emissions per gigawatt-hour (GWh) of electricity generated over the lifecycle of power plants for different energy sources. This includes the footprint of raw materials, transport, and construction of power plants.
Energy SourceCO2-equivalent Emissions Per GWh (tonnes)TypeCoal 820 Fossil fuel
Oil 720 Fossil fuel
Natural Gas 490 Fossil fuel
Biomass 78-230* Non-renewable
Hydro 34 Renewable
Solar 5 Renewable
Wind 4 Renewable
Nuclear 3 Non-renewable
*Emissions from biomass vary depending on the type of fuel combusted.
It’s not surprising that coal, oil, and natural gas plants emit much more greenhouse gases than their renewable and non-renewable counterparts. In fact, emissions per GWh from coal power plants are roughly 273 times higher than nuclear power plants.
Hydropower offers a cleaner and renewable alternative to fossil fuels, however, the concrete and materials used in dam construction contribute to emissions. Furthermore, the decomposition of underwater vegetation in reservoirs also releases methane and carbon dioxide into the environment. Still, emissions per GWh from hydropower are around 24 times lower than coal.
Solar and wind are often the most mentioned energy sources when it comes to the clean energy transition. However, their energy densities are lower than fossil fuels and as a result, they often require more units to generate the same amount of power. For example, generating one GWh of electricity can take more than three million photovoltaic panels, or 412 utility-scale wind turbines. Constructing these massive solar and wind farms adds up to a relatively large material footprint and consequently, GHG emissions.
This is where nuclear power comes in.
Why is Nuclear the Cleanest Source of Energy?
Nuclear power plants use fission to generate electricity without any combustion, avoiding emissions from the process of electricity generation. What’s more, on average, it only takes one typical nuclear reactor to generate one GWh of electricity. The power generation capacity of nuclear reactors is largely due to the high energy density of uranium and nuclear fuel.
According to the U.S. Department of Energy, a single, eraser-sized uranium pellet contains the same amount of energy as 120 gallons of oil or 17,000 cubic feet of natural gas. This allows nuclear power plants to generate large amounts of electricity efficiently, making them one of the cleanest energy sources per GWh of electricity produced.
Nuclear’s Role in the Clean Energy Transition
Nuclear power offers several advantages in the transition to clean energy.
Besides being carbon-free and sustainable, nuclear power is also one of the most reliable and safest sources of energy. In fact, nuclear plants in the United States have a capacity factor of 92.5%, which means that they run at maximum capacity for almost 93% of the time during a year.
As one of the cleanest, most powerful, and reliable sources of energy, nuclear power could play a key role in helping countries achieve decarbonization goals in the fight against climate change.
Road to Decarbonization: U.S. Coal Plant Closures
This infographic highlights announced coal plant closures in the U.S. and how much power will be affected.
Published 2 days ago
on August 17, 2021
By Sponsored Content
Road to Decarbonization: U.S. Coal Plant Closures
As the push to decarbonize starts to kick into gear in the U.S., how do coal plant closures factor into the equation?
With a target of net-zero emissions by 2050, the U.S. is examining all aspects of its economy to see where action is needed. In the automotive industry, for example, the Biden administration is aiming for half of new vehicles to be electric by 2030, following in the footsteps of automakers that have made similar commitments.
But in the power sector that supplies electricity for much of the country, fossil fuels continue to be large emission sources. Coal, which accounted for just 19% of electricity generated in the U.S. in 2020, created 54% of the power sector’s emissions.
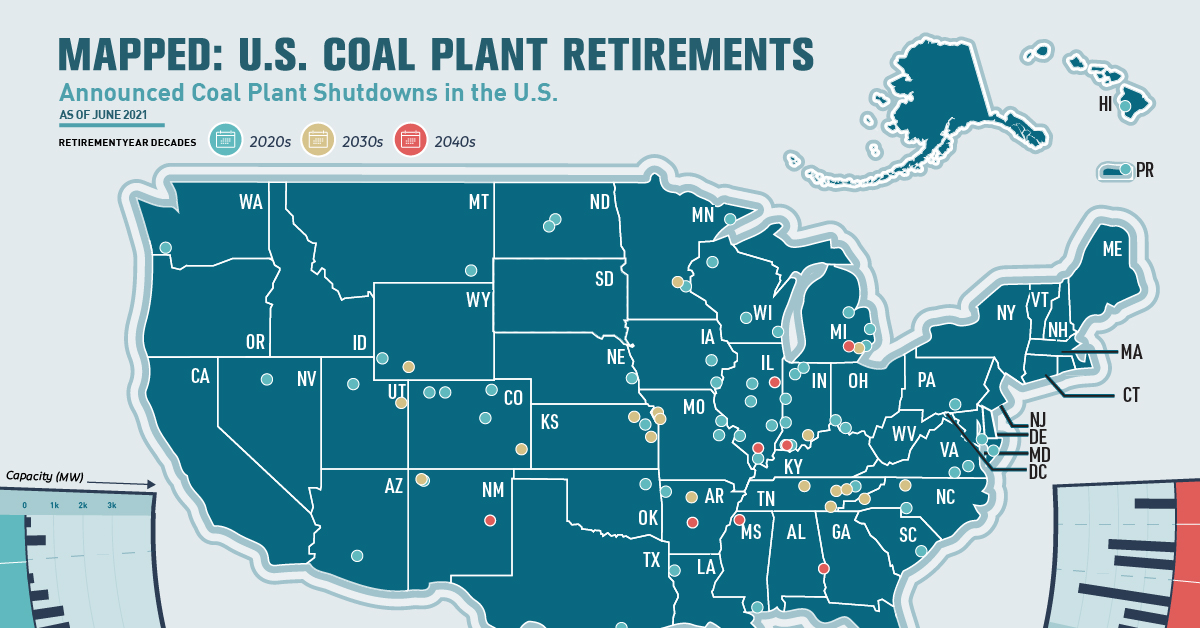
That’s leading to U.S. utilities feeling the pressure to retire coal plants and look for alternatives. This infographic from the National Public Utilities Council visualizes the coal plant closures that have been announced, and how much power will be affected as a result.
Where Are U.S. Coal Plant Closures Happening?
Accurately tracking coal plant closures currently means turning to non-profits and parsing through company reports. To assemble this list, we leveraged the Global Energy Monitor and Carbon Brief and cross-referenced against company sustainability reports and news releases.
The result? 80 coal plants with a total capacity of 98.3 GW publicly scheduled for full retirement over the next three decades.
Search:
PlantStateRetirement DateCapacity (MW)Burlington IA 2021 212
Dolet Hills LA 2021 721
AES Hawaii HI 2022 204
Coal Creek ND 2022 1,210
E.D. Edwards IL 2022 645
Edgewater WI 2022 414
Fayette* (announced not confirmed) TX 2022 1,690
Heskett ND 2022 115
Joppa IL 2022 1,100
Meramec MO 2022 924
Showing 1 to 10 of 80 entries
Noticeably, most of the coal plant closures are targeted in the Midwest (which uses the most coal for power). And most of the retirements are coming early, with the 2020s seeing more than half of announced closures and retired capacity (53.6 GW).
But the largest coal plants with announced retirement dates are currently scheduled for the 2030s and 2040s. That includes Duke Energy’s Gibson power plant in Indiana, the fifth largest coal plant in the U.S. and the largest with a retirement date.
What’s Next for U.S. Decarbonization?
Though it seems like the U.S. has a lot of coal plant closures announced, there’s a lot left to go.
The 98.3 GW of tracked coal plant closures is just 45% of U.S. coal electricity production in 2020. Though many utilities have talked about eventually assessing and planning retirements for some of the remaining 55%, no concrete plans have been announced yet.
“In our industry, deciding to exit coal-fired power is not taken lightly,” said Omaya Ahmad, Sustainability Policy Consultant at Arizona Public Service. “Our coal plants are often the oldest in our fleet and are largely the reason our service territories have grown and flourished into what they are today. However, the pressures presented by climate change and the economic demands tied to coal have required a commitment to transition to clean energy.”
Coal Plant Closures Are Part of a Larger Equation
But as Ahmad explains, turning off coal plants is not such a quick-and-easy fix.
“Such a transition will be a lofty undertaking and will not come without its own challenges,” said Ahmad. “Recognizing the regional transition landscape and timeline depicted on a map like this one will help utilities adequately prepare for and support their coal communities as we all take steps to reach a clean energy economy.”
And coal plants are just one part of the decarbonization equation. Some utilities are opting to transform coal power plants into natural gas plants, which are more cost-efficient and emit less than coal. Even though many utilities and consumers are turning away from carbon emitting fuel sources entirely, there are more than 200 new natural gas plants planned in the U.S.
But the big question is how the generated electricity from coal will be replaced. Communities that rely on coal for power (and economic strength) will have to turn to natural gas or work on renewables capacity, while others have already started the transition.
National Public Utilities Council is the go-to resource for all things decarbonization in the utilities industry. Learn more.
Deep Diving for Metals: Visualizing Ocean Mining
As more metals are necessary for electrification and clean energy transition, companies are looking at an unexplored market: ocean mining.
Published 1 week ago
on August 12, 2021
By Sponsored Content
Deep Diving for Metals: Visualizing Ocean Mining
The mining sector has been one of the biggest beneficiaries in the COVID-19 recovery.
Several countries’ recovery packages have ignited demand for commodities like copper, iron ore and lithium. Given that more metals are necessary for electrification and the clean energy transition, many companies are looking at an unexplored market: ocean mining.
Mining of the Deep Sea is still under study but metals are abundant on the seafloor. Reserves are estimated to be worth anywhere from $8 trillion to more than $16 trillion.
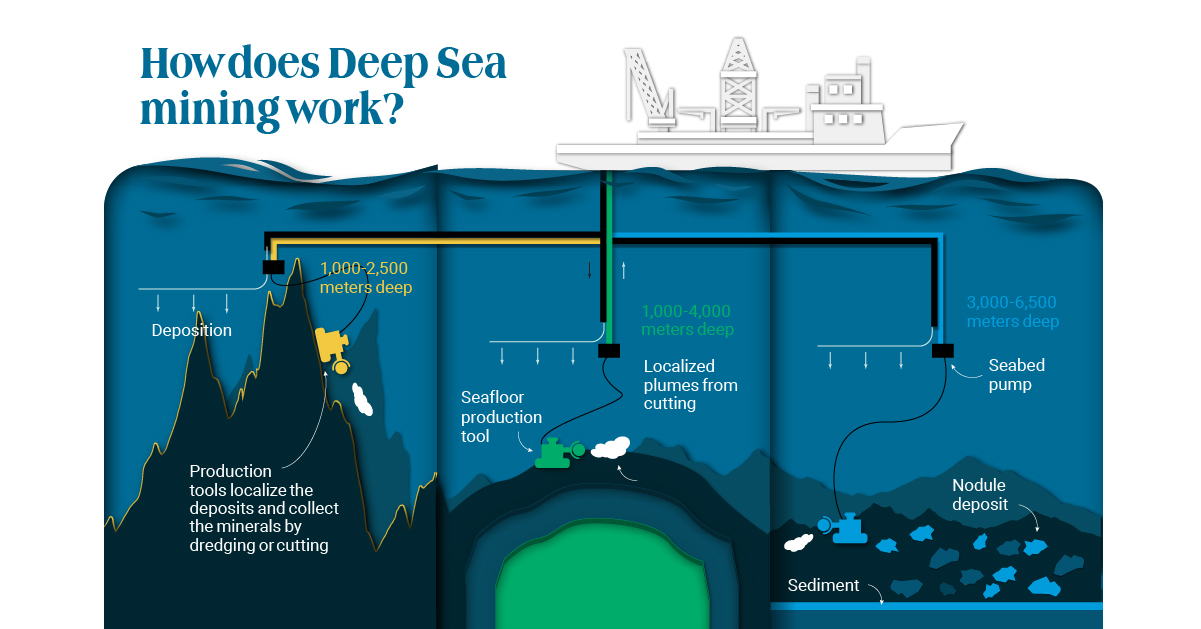
This infographic from Prospector provides a visual overview of the seabed mining process.
Down in the Depths
The most prolific area for ocean mining is the Clarion Clipperton Zone (CCZ) in the Eastern Pacific Ocean, between Hawaii and Mexico. Almost 20 international mining companies have contracts to explore the region which spans over 5,000 kilometers.
Most of the metals are found in potato-sized rock-like polymetallic nodules. Millions of years old, the nodules grow by absorbing metals from the seawater, expanding slowly around the core of shell, bone, or rock.
Show entries
Search:
Mineral DepositsDepthMineralsPolymetallic sulfide 1,000 to 4,000m Copper, lead, zinc, silver, and gold
Polymetallic nodules 3,000 to 6,500m Nickel, cobalt, manganese, copper, ammonium sulfate
Cobalt crusts 1,000 to 2,500m Cobalt, nickel, manganese, rare earth, iron, copper
Showing 1 to 3 of 3 entries
PreviousNext
Source: The Pew Charitable Trusts
It is estimated that there are 21 billion tonnes of polymetallic nodules resting on the ocean floor in the CCZ, containing an estimated:
6 billion tonnes of manganese
226 million tonnes of copper – about 25% of land-based reserves
94,000 million tonnes of cobalt – about six times as much as current land-based reserves
270 million tonnes of nickel – 100 times the annual global nickel production in 2019
Cobalt-rich ferromanganese crusts are found on the sides of underwater mountain ranges and seamounts. Similar to nodules, these crusts form over millions of years as metal compounds in the water. Roughly 57% of them are located in the Pacific.
Polymetallic sulfide deposits formed after seawater seeps into volcanic rocks can be found along tectonic plate boundaries on the Pacific Ocean, Indian Ocean, and the Atlantic Ocean.
How Does Ocean Mining Work?
Extraction of minerals from the seafloor is planned to involve either modified dredging (for nodules), cutting (for massive sulphides and crusts), and transport of the material as a slurry in a riser or basket system to a surface support vessel.
The mineral-bearing material is then processed in a ship (cleaning and dewatering – with the wastewater and sediment being returned to the ocean) and then transferred to a barge for transport to shore where it will be further processed to extract the target metals.
Towards a Greener Future
Growing demand for batteries to power electric cars and store wind and solar energy has driven up the cost of many metals and bolstered the business case for seabed mining.
According to a study published in the Journal of Cleaner Production, producing battery metals from nodules could reduce emissions of CO² by 70-75%, cut land use by 94% and eliminate 100% of solid waste.
Here is a look at how ocean and land mining compares:
Show entries
Search:
ProcessOcean MiningLand MiningProspecting time 1-2 years 2-8 years
Exploration cost USD $20 million USD $10 million
Development time 4-6 years from discovery 10+ years from discovery
Development cost USD $1 billion Up to billions of dollars a year
Mining and extraction Less than USD $1 billion yearly, 20-30+ years Up to billions of dollars a year, 50+ years
Closure and reclamation Investigative ways to offset displacement of sea life and surfaces Restore the lands to the extent possible, revegetate, dry tailings ponds
Source: The Metals Company
The United Nations Convention on the Law of the Sea (UNCLOS) has so far approved 28 exploration contracts in the Pacific, Indian and Atlantic Oceans, covering 1.3 million square kilometers of the ocean floor.
With many companies turning their eyes to the unexplored riches of the ocean, seabed mining could offer a wealth of untapped minerals on the ocean floor.
THE VISUAL CAPITALIST
Uranium: Powering the Cleanest Source of Energy
Published 12 hours ago
on August 19, 2021
By Sponsored Content
The following content is sponsored by the Sprott Physical Uranium Trust
Uranium: Powering the Cleanest Source of Energy
The world’s energy needs are growing with its population. However, achieving a net-zero carbon economy while meeting our growing energy needs requires a larger role for clean, sustainable, and reliable sources. Nuclear is one such energy source.
The above graphic from the Sprott Physical Uranium Trust highlights how uranium is powering one of the cleanest and most reliable sources of energy in nuclear power.
The Cleanest Energy Sources
Although all energy sources have tradeoffs, some are better for the environment than others.
To find the cleanest sources of energy, Our World in Data calculated CO2-equivalent emissions per gigawatt-hour (GWh) of electricity generated over the lifecycle of power plants for different energy sources. This includes the footprint of raw materials, transport, and construction of power plants.
Energy SourceCO2-equivalent Emissions Per GWh (tonnes)TypeCoal 820 Fossil fuel
Oil 720 Fossil fuel
Natural Gas 490 Fossil fuel
Biomass 78-230* Non-renewable
Hydro 34 Renewable
Solar 5 Renewable
Wind 4 Renewable
Nuclear 3 Non-renewable
*Emissions from biomass vary depending on the type of fuel combusted.
It’s not surprising that coal, oil, and natural gas plants emit much more greenhouse gases than their renewable and non-renewable counterparts. In fact, emissions per GWh from coal power plants are roughly 273 times higher than nuclear power plants.
Hydropower offers a cleaner and renewable alternative to fossil fuels, however, the concrete and materials used in dam construction contribute to emissions. Furthermore, the decomposition of underwater vegetation in reservoirs also releases methane and carbon dioxide into the environment. Still, emissions per GWh from hydropower are around 24 times lower than coal.
Solar and wind are often the most mentioned energy sources when it comes to the clean energy transition. However, their energy densities are lower than fossil fuels and as a result, they often require more units to generate the same amount of power. For example, generating one GWh of electricity can take more than three million photovoltaic panels, or 412 utility-scale wind turbines. Constructing these massive solar and wind farms adds up to a relatively large material footprint and consequently, GHG emissions.
This is where nuclear power comes in.
Why is Nuclear the Cleanest Source of Energy?
Nuclear power plants use fission to generate electricity without any combustion, avoiding emissions from the process of electricity generation. What’s more, on average, it only takes one typical nuclear reactor to generate one GWh of electricity. The power generation capacity of nuclear reactors is largely due to the high energy density of uranium and nuclear fuel.
According to the U.S. Department of Energy, a single, eraser-sized uranium pellet contains the same amount of energy as 120 gallons of oil or 17,000 cubic feet of natural gas. This allows nuclear power plants to generate large amounts of electricity efficiently, making them one of the cleanest energy sources per GWh of electricity produced.
Nuclear’s Role in the Clean Energy Transition
Nuclear power offers several advantages in the transition to clean energy.
Besides being carbon-free and sustainable, nuclear power is also one of the most reliable and safest sources of energy. In fact, nuclear plants in the United States have a capacity factor of 92.5%, which means that they run at maximum capacity for almost 93% of the time during a year.
As one of the cleanest, most powerful, and reliable sources of energy, nuclear power could play a key role in helping countries achieve decarbonization goals in the fight against climate change.
Road to Decarbonization: U.S. Coal Plant Closures
This infographic highlights announced coal plant closures in the U.S. and how much power will be affected.
Published 2 days ago
on August 17, 2021
By Sponsored Content
Road to Decarbonization: U.S. Coal Plant Closures
As the push to decarbonize starts to kick into gear in the U.S., how do coal plant closures factor into the equation?
With a target of net-zero emissions by 2050, the U.S. is examining all aspects of its economy to see where action is needed. In the automotive industry, for example, the Biden administration is aiming for half of new vehicles to be electric by 2030, following in the footsteps of automakers that have made similar commitments.
But in the power sector that supplies electricity for much of the country, fossil fuels continue to be large emission sources. Coal, which accounted for just 19% of electricity generated in the U.S. in 2020, created 54% of the power sector’s emissions.
That’s leading to U.S. utilities feeling the pressure to retire coal plants and look for alternatives. This infographic from the National Public Utilities Council visualizes the coal plant closures that have been announced, and how much power will be affected as a result.
Where Are U.S. Coal Plant Closures Happening?
Accurately tracking coal plant closures currently means turning to non-profits and parsing through company reports. To assemble this list, we leveraged the Global Energy Monitor and Carbon Brief and cross-referenced against company sustainability reports and news releases.
The result? 80 coal plants with a total capacity of 98.3 GW publicly scheduled for full retirement over the next three decades.
Search:
PlantStateRetirement DateCapacity (MW)Burlington IA 2021 212
Dolet Hills LA 2021 721
AES Hawaii HI 2022 204
Coal Creek ND 2022 1,210
E.D. Edwards IL 2022 645
Edgewater WI 2022 414
Fayette* (announced not confirmed) TX 2022 1,690
Heskett ND 2022 115
Joppa IL 2022 1,100
Meramec MO 2022 924
Showing 1 to 10 of 80 entries
Noticeably, most of the coal plant closures are targeted in the Midwest (which uses the most coal for power). And most of the retirements are coming early, with the 2020s seeing more than half of announced closures and retired capacity (53.6 GW).
But the largest coal plants with announced retirement dates are currently scheduled for the 2030s and 2040s. That includes Duke Energy’s Gibson power plant in Indiana, the fifth largest coal plant in the U.S. and the largest with a retirement date.
What’s Next for U.S. Decarbonization?
Though it seems like the U.S. has a lot of coal plant closures announced, there’s a lot left to go.
The 98.3 GW of tracked coal plant closures is just 45% of U.S. coal electricity production in 2020. Though many utilities have talked about eventually assessing and planning retirements for some of the remaining 55%, no concrete plans have been announced yet.
“In our industry, deciding to exit coal-fired power is not taken lightly,” said Omaya Ahmad, Sustainability Policy Consultant at Arizona Public Service. “Our coal plants are often the oldest in our fleet and are largely the reason our service territories have grown and flourished into what they are today. However, the pressures presented by climate change and the economic demands tied to coal have required a commitment to transition to clean energy.”
Coal Plant Closures Are Part of a Larger Equation
But as Ahmad explains, turning off coal plants is not such a quick-and-easy fix.
“Such a transition will be a lofty undertaking and will not come without its own challenges,” said Ahmad. “Recognizing the regional transition landscape and timeline depicted on a map like this one will help utilities adequately prepare for and support their coal communities as we all take steps to reach a clean energy economy.”
And coal plants are just one part of the decarbonization equation. Some utilities are opting to transform coal power plants into natural gas plants, which are more cost-efficient and emit less than coal. Even though many utilities and consumers are turning away from carbon emitting fuel sources entirely, there are more than 200 new natural gas plants planned in the U.S.
But the big question is how the generated electricity from coal will be replaced. Communities that rely on coal for power (and economic strength) will have to turn to natural gas or work on renewables capacity, while others have already started the transition.
National Public Utilities Council is the go-to resource for all things decarbonization in the utilities industry. Learn more.
Deep Diving for Metals: Visualizing Ocean Mining
As more metals are necessary for electrification and clean energy transition, companies are looking at an unexplored market: ocean mining.
Published 1 week ago
on August 12, 2021
By Sponsored Content
Deep Diving for Metals: Visualizing Ocean Mining
The mining sector has been one of the biggest beneficiaries in the COVID-19 recovery.
Several countries’ recovery packages have ignited demand for commodities like copper, iron ore and lithium. Given that more metals are necessary for electrification and the clean energy transition, many companies are looking at an unexplored market: ocean mining.
Mining of the Deep Sea is still under study but metals are abundant on the seafloor. Reserves are estimated to be worth anywhere from $8 trillion to more than $16 trillion.
This infographic from Prospector provides a visual overview of the seabed mining process.
Down in the Depths
The most prolific area for ocean mining is the Clarion Clipperton Zone (CCZ) in the Eastern Pacific Ocean, between Hawaii and Mexico. Almost 20 international mining companies have contracts to explore the region which spans over 5,000 kilometers.
Most of the metals are found in potato-sized rock-like polymetallic nodules. Millions of years old, the nodules grow by absorbing metals from the seawater, expanding slowly around the core of shell, bone, or rock.
Show entries
Search:
Mineral DepositsDepthMineralsPolymetallic sulfide 1,000 to 4,000m Copper, lead, zinc, silver, and gold
Polymetallic nodules 3,000 to 6,500m Nickel, cobalt, manganese, copper, ammonium sulfate
Cobalt crusts 1,000 to 2,500m Cobalt, nickel, manganese, rare earth, iron, copper
Showing 1 to 3 of 3 entries
PreviousNext
Source: The Pew Charitable Trusts
It is estimated that there are 21 billion tonnes of polymetallic nodules resting on the ocean floor in the CCZ, containing an estimated:
6 billion tonnes of manganese
226 million tonnes of copper – about 25% of land-based reserves
94,000 million tonnes of cobalt – about six times as much as current land-based reserves
270 million tonnes of nickel – 100 times the annual global nickel production in 2019
Cobalt-rich ferromanganese crusts are found on the sides of underwater mountain ranges and seamounts. Similar to nodules, these crusts form over millions of years as metal compounds in the water. Roughly 57% of them are located in the Pacific.
Polymetallic sulfide deposits formed after seawater seeps into volcanic rocks can be found along tectonic plate boundaries on the Pacific Ocean, Indian Ocean, and the Atlantic Ocean.
How Does Ocean Mining Work?
Extraction of minerals from the seafloor is planned to involve either modified dredging (for nodules), cutting (for massive sulphides and crusts), and transport of the material as a slurry in a riser or basket system to a surface support vessel.
The mineral-bearing material is then processed in a ship (cleaning and dewatering – with the wastewater and sediment being returned to the ocean) and then transferred to a barge for transport to shore where it will be further processed to extract the target metals.
Towards a Greener Future
Growing demand for batteries to power electric cars and store wind and solar energy has driven up the cost of many metals and bolstered the business case for seabed mining.
According to a study published in the Journal of Cleaner Production, producing battery metals from nodules could reduce emissions of CO² by 70-75%, cut land use by 94% and eliminate 100% of solid waste.
Here is a look at how ocean and land mining compares:
Show entries
Search:
ProcessOcean MiningLand MiningProspecting time 1-2 years 2-8 years
Exploration cost USD $20 million USD $10 million
Development time 4-6 years from discovery 10+ years from discovery
Development cost USD $1 billion Up to billions of dollars a year
Mining and extraction Less than USD $1 billion yearly, 20-30+ years Up to billions of dollars a year, 50+ years
Closure and reclamation Investigative ways to offset displacement of sea life and surfaces Restore the lands to the extent possible, revegetate, dry tailings ponds
Source: The Metals Company
The United Nations Convention on the Law of the Sea (UNCLOS) has so far approved 28 exploration contracts in the Pacific, Indian and Atlantic Oceans, covering 1.3 million square kilometers of the ocean floor.
With many companies turning their eyes to the unexplored riches of the ocean, seabed mining could offer a wealth of untapped minerals on the ocean floor.
THE VISUAL CAPITALIST
No comments:
Post a Comment