The art of science
Nature Physics 17, 869–870 (2021)
They say a picture tells a thousand words, so by that accounting, the visual word count of a Nature Physics paper doubles that of its text. So how best to use that budget?
The German painter Margaret Leiteritz made a name for herself a century ago by turning scientific data into works of art1. As long-time Leiteritz fans, we at Nature Physics are firm believers in the idea that information carries an intrinsic beauty. When we select images for the cover of our issue each month, we always prioritize those featuring real data. And those data that don’t make it to the cover are lovingly curated in our Instagram account (www.instagram.com/nature.physics/). But aesthetics is only a small part of what makes a figure beautiful — and effective.

The message a paper tells in its figures can be more persuasive than that of its text. And like the written word, scientific images benefit from a certain economy. Great scientific figures are self-contained and self-evident, conveying only the information necessary to support a paper’s claims.
That’s not to say that brevity should give way to misinformation. We are committed to reproducibility in scientific research, and encourage authors to provide all the data necessary to allow others to understand and replicate their findings. But for this we allocate up to ten extended data files that are integrated into the online version of the paper, in addition to a separate document containing supplementary information. This way, specialists can easily access exhaustive imaging data, for example, leaving the authors free to convey clear, uncluttered information in the figures accompanying the main text of the paper.
Effective figures are also coherent. The caption of each figure published in a Nature Physics paper begins with a single unifying title, regardless of how many parts it has. So ideally, each figure should convey a single message. Think of it as a built-in structure: each paper relays the findings of a study in four (or six) chapters, each with its own illustration.
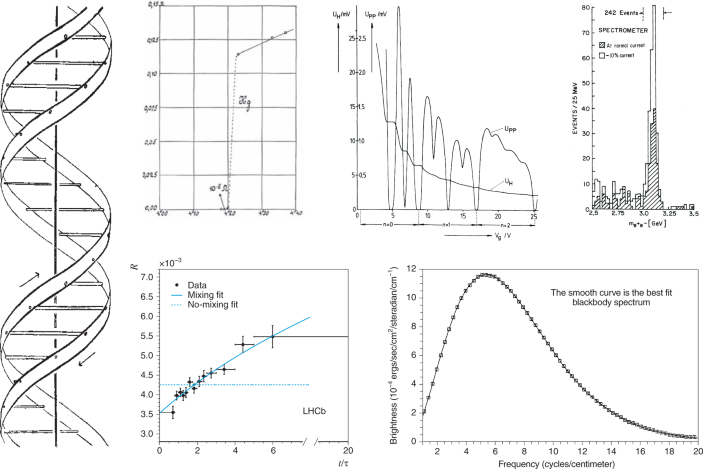
A look back at the history of scientific figures reveals how easily excellent figures capture key findings. For example, James Watson and Francis Crick’s 1953 report of the structure of DNA famously included only a schematic in support of their revolutionary claim (pictured, far left) — perhaps because the data underpinning the discovery weren’t theirs to publish2.
Heike Kamerlingh Onnes offered more information when he presented his discovery of superconducting mercury at the first Solvay conference in 1911 — but the unmistakable jump in resistance (top left) was just as minimal, and as clear, as the double helix. The quantized nature of the Hall voltage of a two-dimensional electron gas was similarly clear in the plot that earned Klaus von Klitzing the 1985 Nobel Prize in Physics (top centre).
The existence of the charm quark was writ large in the signal of what later became known as the J/ψ meson (top right), and the news that neutral charm mesons oscillate — or mix — was similarly effective in a 2013 Large Hadron Collider beauty (LHCb) result (bottom left). Another triumph of data fitting came two decades earlier, when the cosmic microwave background measured on the Cosmic Background Explorer (COBE) satellite was shown to be consistent with the blackbody spectrum, lending crucial support to the Big Bang hypothesis (bottom right).
These plots may not be the masterworks of Margaret Leiteritz, but with a bit of thought and care, figures can be an essential tool for conveying the central conclusions of a scientific paper. And for those discoveries that really do make a difference, in time we can also learn to appreciate them as iconic representations of human enquiry.
No comments:
Post a Comment