These Global Cities Show the Highest Real Estate Bubble Risk
Published October 19, 2022
By Nick Routley
These Global Cities Show the Highest Real Estate Bubble Risk (visualcapitalist.com)
▼ Use This Visualization
These Global Cities Show the Highest Real Estate Bubble Risk
Housing bubbles are a tricky phenomenon. As a market gathers steam and prices increase, it remains a matter of debate whether that market is overvalued and flooded with speculation, or it’s simply experiencing robust demand.
Of course, once a bubble bursts, it’s all obvious in hindsight.
One common red flag is when prices decouple from local incomes and rents. As well, imbalances in the real economy, such as excessive construction activity and lending can signal a bubble in the making.
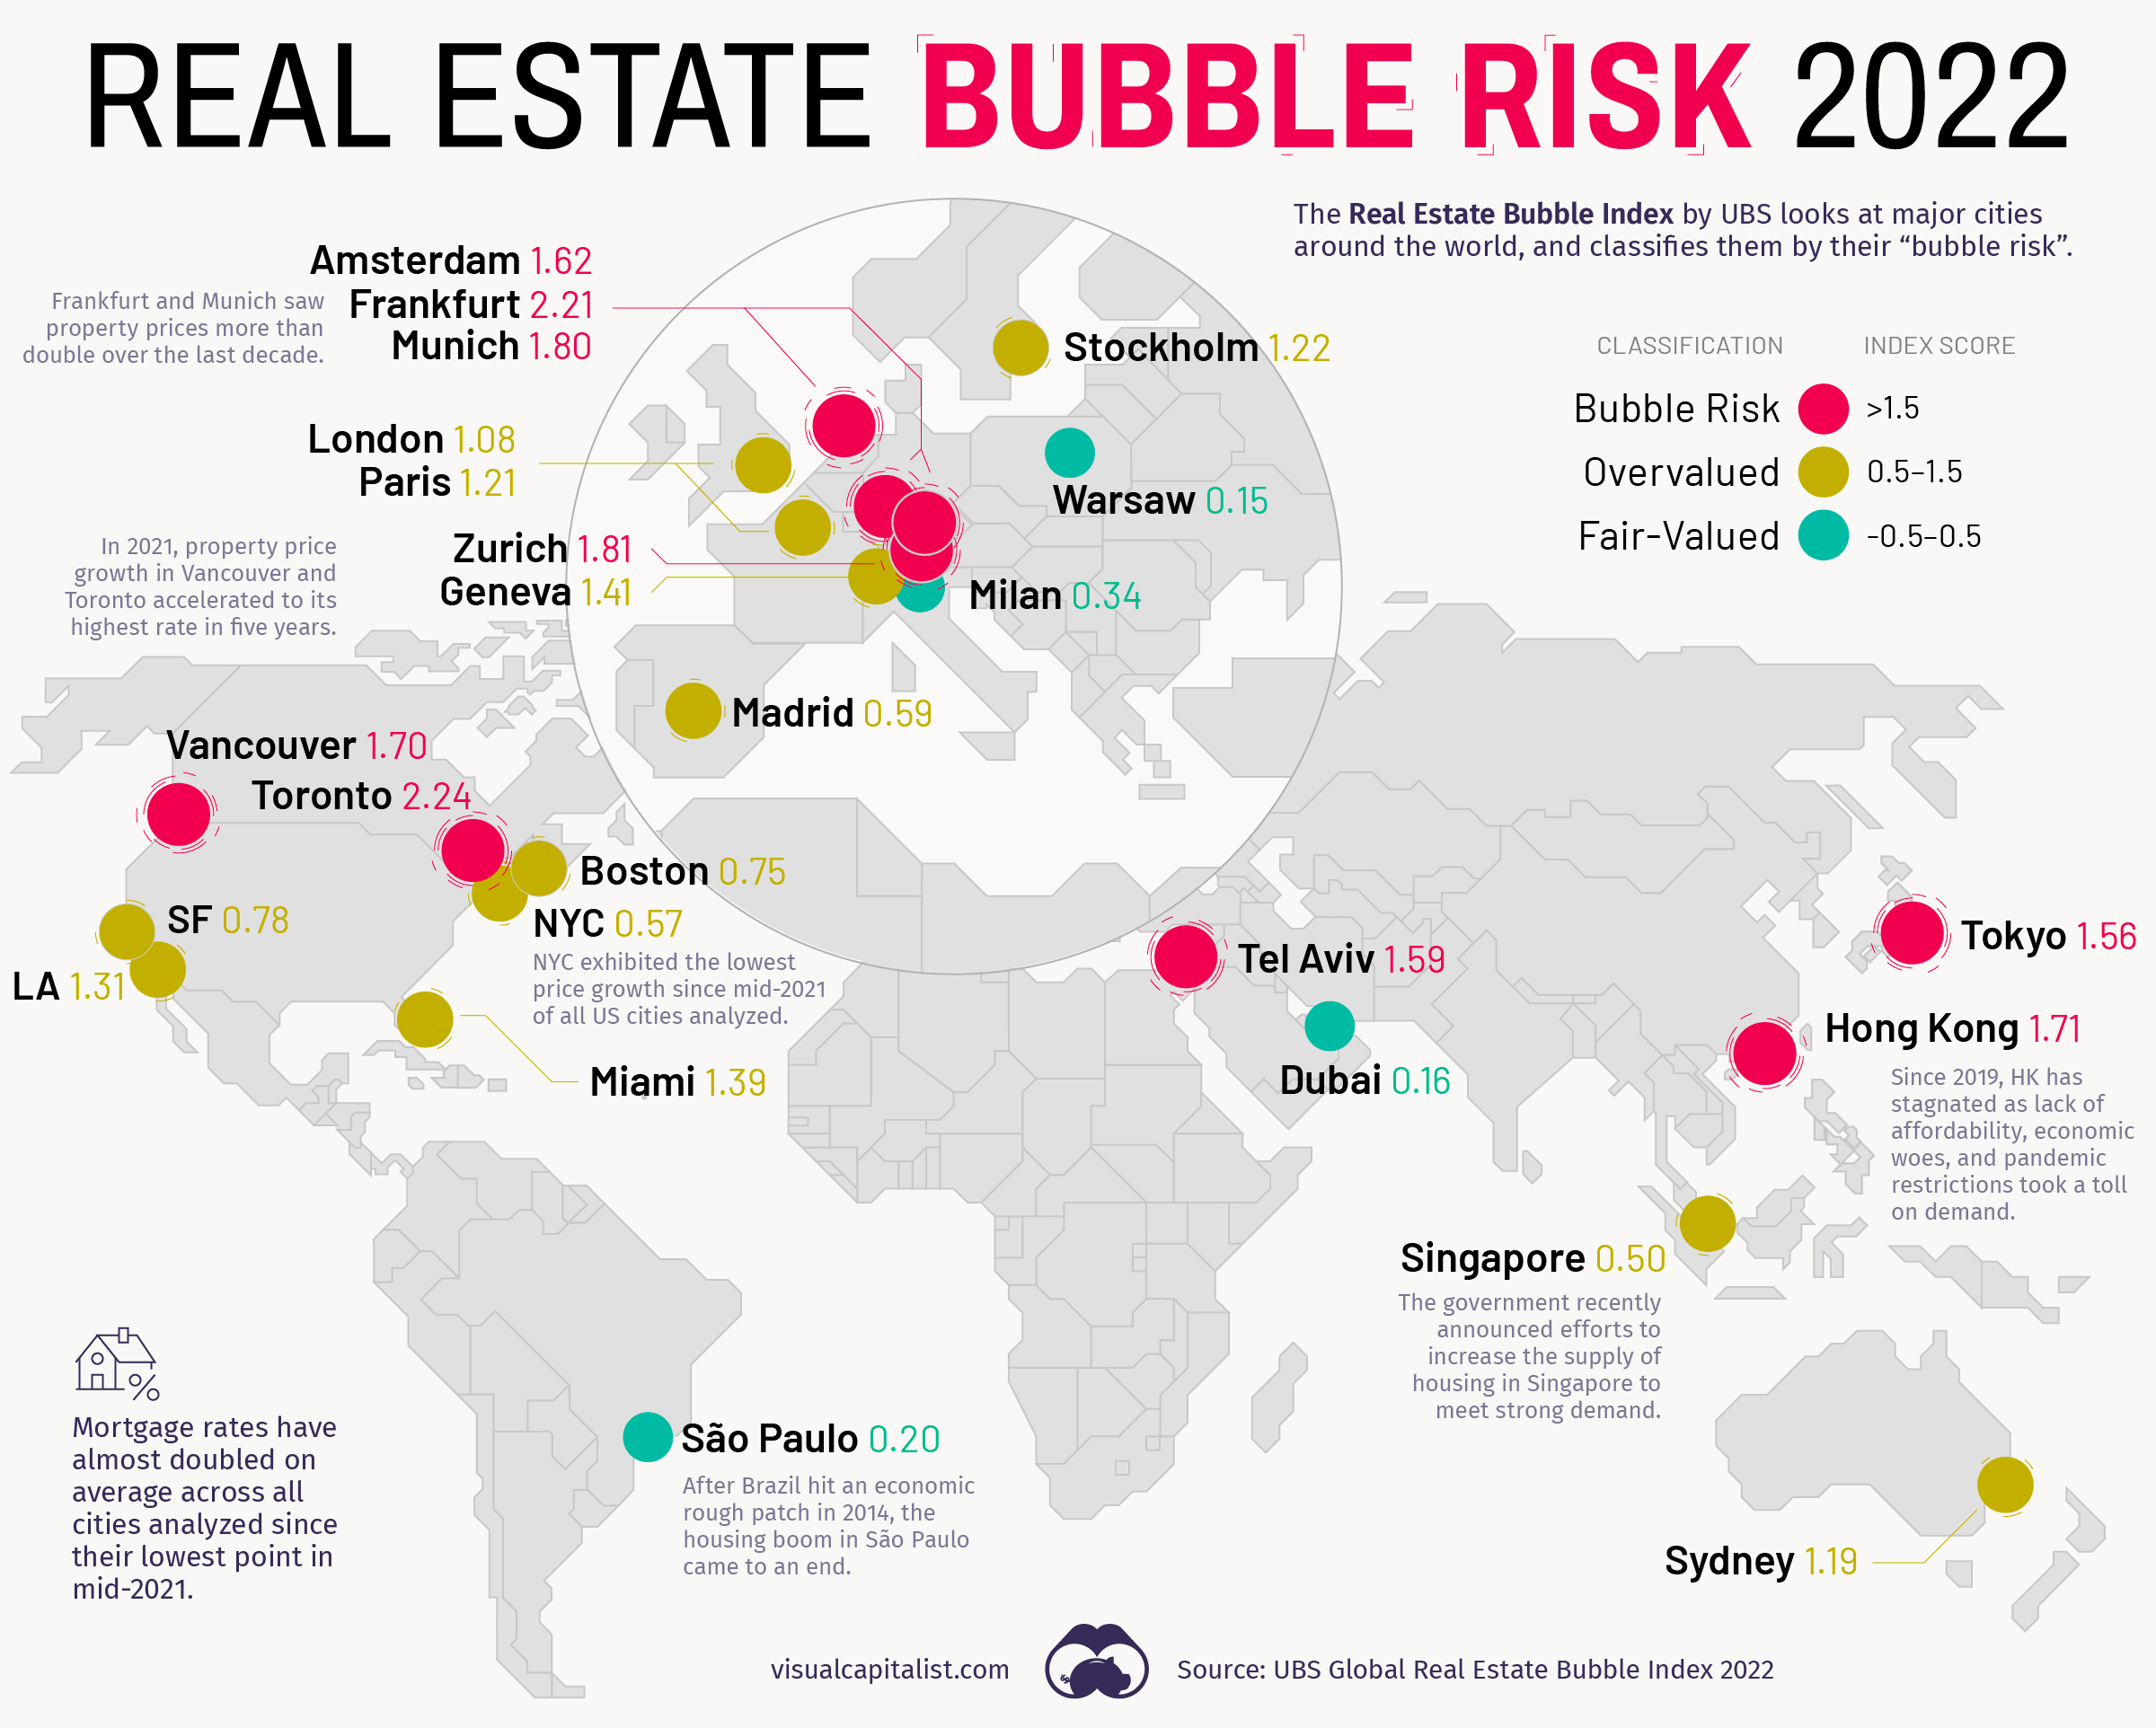
The map above, based on data from the Real Estate Bubble Index by UBS, examines 25 global cities, scoring them based on their bubble risk.
Overinflated Markets
In the 2022 edition of the Real Estate Bubble Index, nine of the cities covered were classified as having extreme bubble risk (1.5 or higher score).
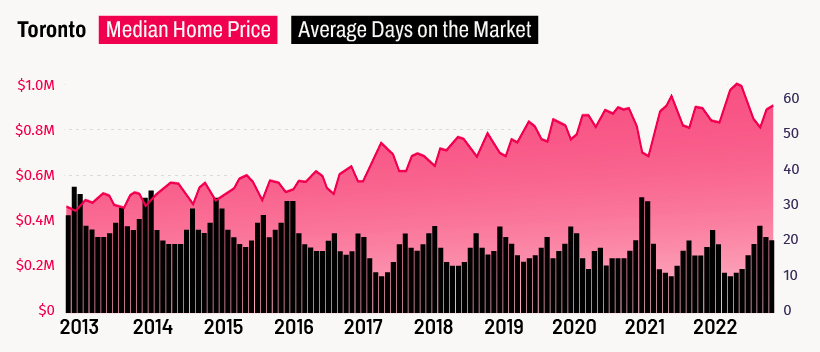
Canada’s largest city finds itself at the top of a ranking no city wants to end up on. Toronto’s home prices have been rising steadily for years now, and many, including UBS, believe that the city is now firmly in bubble territory.
Vancouver also finds itself in a similar position. Both Canadian cities have a high quality of life and have thriving tech industries.
Notably, none of the U.S. cities analyzed find themselves in the most extreme bubble risk category. The closest scoring U.S. city was Miami, which sits firmly in overvalued territory (0.5-1.5 range) with a score of 1.39.
Examining the Trends
In recent years, low interest rates helped push home prices and incomes further apart.
For cities in the bubble risk zone, prices have climbed by an average of 60% in inflation-adjusted terms over the past decade, while rents and real incomes increased by just 12%. And, while COVID-19 briefly put a dent in urban demand, rents in the cities analyzed rose at around the same pace as pre-pandemic times.
As a result, all but three of the cities saw positive price growth over the past year from a nominal price perspective:
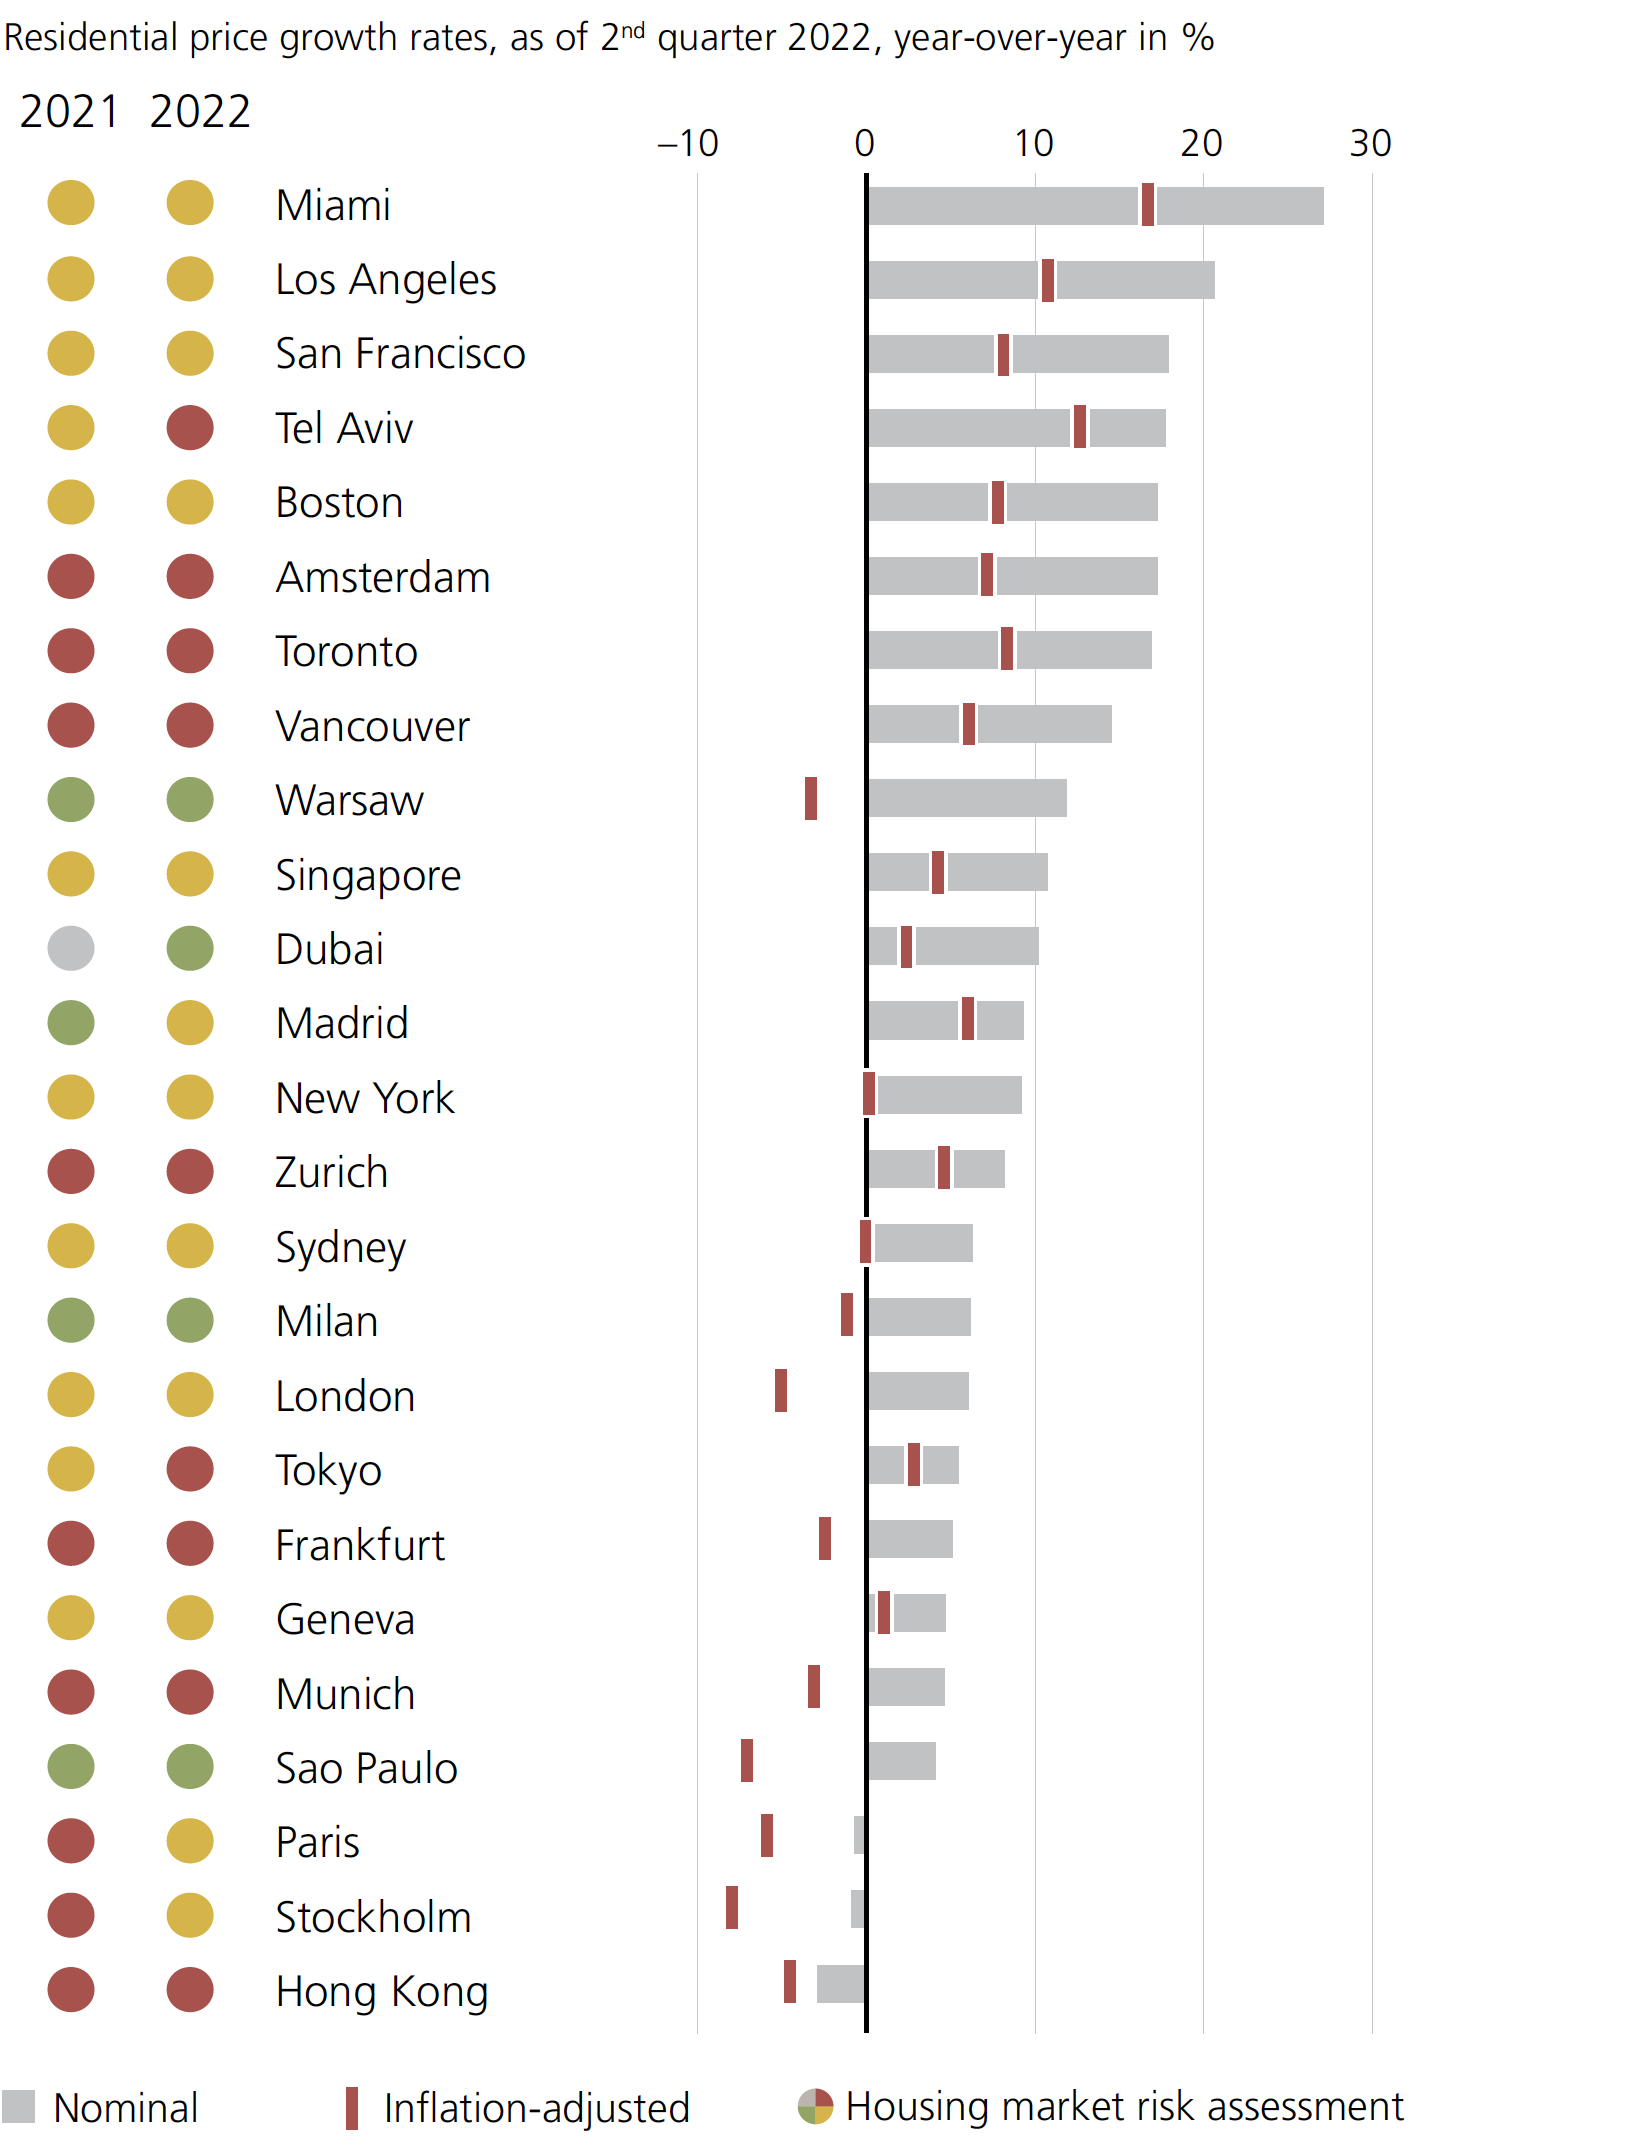
U.S. cities occupy a number of spots at the top of this chart. Miami, in particular, is seeing strong internal migration patterns, as well as renewed interest from foreign investors.
Hong Kong experienced the biggest one-year nominal drop of all the cities analyzed. The report notes that since around 2019 Hong Kong “has broadly stagnated as the lack of affordability, economic woes, and pandemic restrictions all took a major toll on demand.”
Prices can’t rise forever. According to UBS, most cities with high valuations, price corrections have already begun, or could be right around the corner.
Housing bubble in Amsterdam on the verge of bursting as prices remain high
20 October 2022, By Victoria Séveno
The most recent edition of the Global Real Estate Bubble Index has once again highlighted the excessively high prices on the housing market in the Dutch capital, warning that the current housing bubble in Amsterdam shows a real risk of bursting.
UBS Global Real Estate Bubble Index 2022
Published annually by UBS, a Swiss bank and financial services company, the Global Real Estate Bubble Index determines which cities around the world have the greatest housing bubble risk by investigating international real estate trends and prices. The study analyses house prices in 25 cities using five key sub-indices: Price-to-income ratio
Price-to-rent ratio
Change in mortgage to GDP ratio
Change in construction to GDP ratio
Relative price city-to-country indicator
These factors are then used to determine the city’s risk of a real estate bubble - when property prices rise at rapid rates to the point where they reach unsustainable levels and drop sharply.
This year once again sees nine cities ranked in the “bubble risk” category, with Toronto overtaking Frankfurt to occupy the top spot. Other European cities found to have some of the most overpriced housing markets in the world included Zurich and Munich.
While Amsterdam didn’t rank quite as highly as some of its European neighbours, it once again managed to secure a spot in the top 10, rising from ninth place in 2021 to seventh place this year. The study notes that the city shows “an elevated risk” of a housing bubble.
Amsterdam housing market one of the most overpriced in the world
“Overall, bubble risk has increased only marginally as well, with the city’s price growth roughly in line with the national average,” the UBS report reads, noting that while Amsterdam displayed some of the most significant increases in housing prices out of all the European cities included in the study, Dutch salaries and rent prices have also increased - although not at the same rate.
According to the report, a skilled service worker based in the Dutch capital needs to work an average of eight years in order to be able to buy a 60-square-metre flat near the city centre. The same flat would have to be rented out for 31 years in order for the owner to turn a profit.
While house prices in the Netherlands have been steadily rising for years, recent changes to the interest rates on mortgages, the inflation rate, and the cost of energy mean the Dutch housing market is finally slowing down, with prices in some parts of the country actually falling. These latest trends could suggest that the national housing bubble is about to burst - although the market in Amsterdam remains extremely competitive.
International housing markets with the highest bubble risk
According to the latest edition of the UBS study, the following nine cities have all been categorised as at risk of a housing bubble:Toronto
Frankfurt
Zurich
Munich
Hong Kong
Vancouver
Amsterdam
Tel Aviv
Tokyo
For more information about the report, visit the UBS website.
| Rank | Risk Category | City | Bubble Index Score |
|---|---|---|---|
| #1 | Toronto | 2.24 | |
| #2 | Frankfurt | 2.21 | |
| #3 | Zurich | 1.81 | |
| #4 | Munich | 1.80 | |
| #5 | Hong Kong | 1.71 | |
| #6 | Vancouver | 1.70 | |
| #7 | Amsterdam | 1.62 | |
| #8 | Tel Aviv | 1.59 | |
| #9 | Tokyo | 1.56 | |
| #10 | Miami | 1.39 | |
| #11 | Los Angeles | 1.31 | |
| #12 | Stockholm | 1.22 | |
| #13 | Paris | 1.21 | |
| #14 | Sydney | 1.19 | |
| #15 | Geneva | 1.14 | |
| #16 | London | 1.08 | |
| #17 | San Francisco | 0.78 | |
| #18 | Boston | 0.75 | |
| #19 | Madrid | 0.59 | |
| #20 | New York | 0.57 | |
| #21 | Singapore | 0.50 | |
| #22 | Milan | 0.34 | |
| #23 | Sao Paulo | 0.20 | |
| #24 | Dubai | 0.16 | |
| #25 | Warsaw | 0.15 |

 Toronto
 Frankfurt
 Zurich
 Hong Kong
 Amsterdam
 Tel Aviv
 Tokyo
Tokyo
 Miami
Miami Stockholm
 Paris
Paris Sydney
 London
 Madrid
 Singapore
 Milan
Milan Sao Paulo
 Dubai
Dubai Warsaw
No comments:
Post a Comment