DOOMSCROLLING
El Niño Armageddon Qiyamah Has Officially Begun – OpEd
.jpg)
June 12, 2026
By Rabbi Allen S. Maller
El Niño has officially begun, and it is forecast to intensify into a very strong or “Super” El Niño with major shifts in global weather patterns and an even hotter climate, according to a new report released Thursday morning from the National Oceanic and Atmospheric Administration. El Niño is a periodic weather pattern in the tropical Pacific Ocean that alters winds and features unusually hot waters in the central and eastern Pacific. These changes in winds and ocean temperatures have knock-on effects on weather patterns worldwide.
NOAA’s Climate Prediction Center is giving this El Niño a 63% chance of becoming a “very strong” event (known as a Super El Niño) and one of the “largest El Niño events in the historical record going back to 1950.” In a sign of the center’s certainty in the forecast, it’s giving 100% odds of El Niño continuing through the fall and extremely high odds continuing into the winter. To be considered a Super El Niño, tropical Pacific water temperatures must be more than 2 degrees above average. Some reliable computer models suggest that bar will be greatly exceeded.
For the past few months, large volumes of unusually hot water have been sloshing from the western Pacific to the eastern tropical Pacific, forced by shifting winds. This unusually hot water has traveled about 600 to 1,000 feet beneath the ocean surface and is beginning to rise to the sea surface thousands of miles to the east, closer to South America. Similar dynamics have played out during past intense El Niños. Super El Niño events are relatively rare, with the most recent ones occurring in 2015-16, 1997-98 and 1982-83.
Because El Niño involves the transfer of a large amount of heat energy from the ocean to the atmosphere, this phenomenon also has implications for the global climate. It boosts global average surface temperatures on top of the human-caused warming trend from fossil fuel pollution, virtually guaranteeing that 2027 will eclipse 2024 to set a record for the planet’s new warmest year. Studies have shown that strong El Niños can reduce countries’ economic growth through disaster losses and food supply disruptions.
There is an extra dose of uncertainty about this Super El Niño’s impacts because this event is occurring when the world is already much hotter than average due to global warming from fossil fuel pollution.
Sea levels are rising faster than at any time in 4,000 years, with China’s major coastal cities at particular risk. The rapid increase is driven by warming oceans and melting ice, while human activities like groundwater pumping make it worse.
Also a group of scientists, whose research was recently published in Science, used satellite data to determine why these severe heat waves are happening. They found that 96% of the world’s ocean surfaces experienced heat wave conditions, compared with a historical (1982–2022) average of 73.7%. They also found that the average duration of heat waves had gone up to 120 days, quadrupling the historical average.
I am a Reform Rabbi who believes our planet and our species will survive and thrive through the coming climate change catastrophes, but the longer humans delay transforming our way of life away from carbon based fuels like gas, oil and coal; the more it will cost us.
The majority of Christians, Jews, and Muslims do not believe that all of humanity is moving closer and closer to a catastrophic Judgement Day. The minority who do think that Judgement Day is coming soon share the usual negative, fear-filled views of most end-times thinkers: Christians, Jews and especially Muslims, who do believe that: “The hour (of Judgement) is near” (Qur’an 54:1); and ˹The time of˺ people’s judgment has drawn near, yet they heedlessly turn away.” (Qur’an 21:1)
According to a 2012 poll by the Pew Research Center, at least half of Muslims in nine Muslim-majority countries believe that the coming of the Mahdi is “imminent,” and could happen in their lifetime. Sadly these end-times thinkers always see pre-ordained threats of a cataclysmic world wide doom; and not just the warning of the consequences if we humans do not repent and change our behavior.
This is clearly a warning for all serious Christians, Jews and Muslims. A World Meteorological Organization forecast for the next several years also predicts a 90% chance that the world will set yet another record for the hottest year by the end of 2026; that the Atlantic will continue to brew more potentially dangerous hurricanes; meteorologists say large parts of land in the Northern Hemisphere will be 1.4 degrees warmer than recent decades, and the U.S. Southwest’s drought will continue.
It is true that human society has changed more rapidly, violently, and fundamentally in the last century of the second millennium than ever before in history. Doctors saved the lives of millions. Dictators sacrificed the lives of millions. Populations exploded and birthrates declined. Technology produced both worldwide prosperity and pollution at the same time.
Knowing all this, should we look upon the first century of the third millennium with optimistic hope or with fatalistic trepidation? Are the world and our society heading towards a wonder-filled new age, or toward a doomsday; or are both occurring concurrently because breakdown is always a prelude to breakthrough?
Many who believe in the Biblical vision of a Messianic Age use the insights of the Prophets of Israel to provide guidance in understanding the social, economic, scientific, and cultural upheavals sweeping society. Usually, it is the dramatic dangers of the pre-Messianic tribulation that are emphasized. I will focus on the positive signs developing throughout the world that accord with the Messianic vision of the Biblical Prophets.
In most non-Abrahamic religious traditions, redemption is defined only in terms of individual enlightenment or personal salvation. However, the Abrahamic Prophets said that redemption is a transformation of human society that would occur through the catalyst of the transformation of the Abrahamic religious community. This transformation, which will take place in this world at some future time, is called the Messianic Age.
The transition to the Messianic Age is called the birth pangs of the Messiah. The birth of a redeemed Messianic world may be the result of easy or difficult labor. If everyone would simply live according to the moral teachings of his or her religious tradition, we would ourselves bring about the Messianic Age. But, if we will not do it voluntarily, it will come through social and political upheavals, worldwide conflicts, and generation gaps. The Messiah refers to an agent of God who helps bring about this transformation.
The Jewish tradition teaches that this agent of God (and there will be three or four such agents) will be a human being, with great spiritual leadership qualities similar to Prophets Moses or Mohammed. For Jews, the Messianic hope helped them to survive many years of oppression and evil. For Christian and Muslims the Messianic hope will be the second coming of Jesus and the Muslim Mahdi, leading up to God’s Judgement Day-Qiyamah vindication for righteous believers; and the establishment of God’s kingdom on Earth…
The arrival of the Messianic Age is what’s really important, not the specific personality of the agents who bring it about since they are simply the instruments of God, who ultimately is the real Redeemer.
The Messianic Age is usually seen as the solution to all of humanity’s basic problems. This may be true in the long run but the vast changes the transition to the Messianic Age entails will provide challenges to society for many generations to come.
The majority of Christians, Jews, and Muslims do not believe that all of humanity is moving closer and closer to a catastrophic Judgement Day. The minority who do think that Judgement Day is coming share the usual negative, fear-filled views of most end-times thinkers: Christians, Jews and especially Muslims, who do believe that: “The hour (of Judgement) is near” (Qur’an 54:1); and ˹The time of˺ people’s judgment has drawn near, yet they heedlessly turn away.” (Qur’an 21:1)
Sadly these end-times thinkers always see pre-ordained threats of cataclysmic world wide doom; and not just as Armageddon being a warning of the consequences if we humans do not repent and change our behavior. Armageddon comes from the name in the Hebrew Bible for the hill of Megiddo, which is about 80 miles north of Jerusalem, and is today only an archaeological site. The word Armageddon does not appear in the Hebrew Bible and appears only once in the Greek New Testament, in Revelation 16:16.
Armageddon is a Greek transliteration of the Hebrew har məgiddô (הר מגידו). Har in Hebrew means “a mountain or hill”. Armageddon is usually seen as the final battle or battles between good and evil which lasts for only a short time; compared to the Messianic Peace that follows Armageddon that lasts until large carnivores eat only Plant based meat. Armageddon is a powerful challenge that can be overcome if most people will stop fighting each other and co-operate to reduce climate change.
Also in our own generation we have seen the dramatic fulfillment of Isaiah’s prophecy: “I will bring your offspring from the (Middle) East and gather you from the (European) West. To the North (Russia) I will say ‘give them up’ and to the South (Ethiopia) ‘do not hold them’. Bring my sons from far away, my daughters from the end of the earth.” (43:5-6)
Isn’t it amazing how people adjust to living in a radically new world and forget the past? Indeed, the Prophet Isaiah himself proclaimed God’s message, “Behold, I create a new Heaven and a New Earth, and former things shall not be remembered.” (65:17)
Where does the Mahdi, Prophet Jesus and the last Messiah fit in with all of this? They will still have lots to do when they arrive. Now that a large part of the Jewish people have returned to the Land of Israel, and resurrected a Jewish State, one might think that rebuilding a temple on the site where Solomon originally built one almost 3,000 years ago, would be relatively simple.
And it would, except for the fact that a Muslim Shrine called The Dome of the Rock presently occupies the Jerusalem Temple of Prophet Solomon site. Often erroneously called the Mosque of Omar, it is not a mosque and it was not built by Omar. It was built in 691 by Abd-Al-Malik and it is regarded by Muslims as the third holiest site in the world. Any attempt to replace the Dome of the Rock would provoke a Muslim Holy War of cataclysmic proportions.
There is open land on the Temple Mount, and a small 3D digital broadcast Jewish house of worship like Solomon’s Temple could be rebuilt as a virtual replica like those made by the Factum Foundation, a Madrid-based nonprofit that creates high-resolution digital replicas of the world’s cultural heritage; could be built near the Dome of the Rock provided the Muslims would cooperate.
Most observers agree that anyone who could arrange such Jewish-Muslim cooperation would really be the Messianic Ruler of Peace (Isaiah 9:5) Christian support for such a cooperative venture would also be very important, and anyone who can bring Jews, Christians, and Muslims together in mutual respect and cooperation would surely fulfill the greatest of all Messianic predictions: “They shall beat their swords into plowshares and their spears into pruning knives; nation shall not take up sword against nation, they shall never again teach war.” (Isaiah 2:4)
Indeed, such Jewish/Christian/Muslim cooperation would not be possible without great spiritual leadership in all three communities. Thus, each community could consider its leadership to be the Messiah and this would fulfill the culminating verses of Isaiah’s Messianic prophecy as enlarged upon by Micah (4:3-5),
“They shall beat their swords into plowshares and their spears into pruning knives. Nation shall not take up against nation, they shall never again teach war, but every man shall sit under his grapevine or fig tree with no one to disturb him, for it is the Lord of Hosts who spoke. Though all peoples walk each in the name of its God, we will walk in the name of the Lord our God forever and ever.”
Then, “On that day there will be a highway from Egypt to Assyria. The Assyrians will go to Egypt and the Egyptians to Assyria. The Egyptians and Assyrians will worship together. On that day Israel will join a three-party alliance with Egypt and Assyria, a blessing upon the heart. The LORD of Hosts will bless them saying, “Blessed be Egypt My people, Assyria My handiwork, and Israel My inheritance.”…(Isaiah 19:23-5)
I know that Prophets Jesus and Muhammad warned their own communities about trying to calculate a specific end-time date for Messianic events. In the New Testament when prophet Jesus was asked in private by his disciples, “What will be the sign for your coming (back) and the end of the (present) age?” (Matthew 24:3) Prophet Jesus warned his disciples about all kinds of upheavals and false Messiahs that will come; and then concludes by saying, “But about that day and hour no one knows, not even the angels in heaven, not even the son: only the Father.” (24:36) A similar statement was made by Prophet Muhammad when he was asked, “Tell me about the Hour”. He replied: “The one questioned about it knows no better than the questioner.” (Muslim book 1:1&4)
Yet we should never give up the positive Messianic hope that if each of the three Abrahamic religious communities truly follows the best of its own religious teachings; God has assured us that the Messiah will arrive, and one way or another, God’s Qiyamah-Judgement Day will arrive and God’s Kingdom of worldwide peace and prosperity will be established.
About Rabbi Allen S. Maller
Allen Maller retired in 2006 after 39 years as Rabbi of Temple Akiba in Culver City, Calif. He is the author of an introduction to Jewish mysticism. God. Sex and Kabbalah and editor of the Tikun series of High Holy Day prayerbooks.
View all posts by Rabbi Allen S. Maller →
A monster is awakening as 'super-El Niño' could devastate the planet in 2026.jpg)
June 12, 2026
By Rabbi Allen S. Maller
El Niño has officially begun, and it is forecast to intensify into a very strong or “Super” El Niño with major shifts in global weather patterns and an even hotter climate, according to a new report released Thursday morning from the National Oceanic and Atmospheric Administration. El Niño is a periodic weather pattern in the tropical Pacific Ocean that alters winds and features unusually hot waters in the central and eastern Pacific. These changes in winds and ocean temperatures have knock-on effects on weather patterns worldwide.
NOAA’s Climate Prediction Center is giving this El Niño a 63% chance of becoming a “very strong” event (known as a Super El Niño) and one of the “largest El Niño events in the historical record going back to 1950.” In a sign of the center’s certainty in the forecast, it’s giving 100% odds of El Niño continuing through the fall and extremely high odds continuing into the winter. To be considered a Super El Niño, tropical Pacific water temperatures must be more than 2 degrees above average. Some reliable computer models suggest that bar will be greatly exceeded.
For the past few months, large volumes of unusually hot water have been sloshing from the western Pacific to the eastern tropical Pacific, forced by shifting winds. This unusually hot water has traveled about 600 to 1,000 feet beneath the ocean surface and is beginning to rise to the sea surface thousands of miles to the east, closer to South America. Similar dynamics have played out during past intense El Niños. Super El Niño events are relatively rare, with the most recent ones occurring in 2015-16, 1997-98 and 1982-83.
Because El Niño involves the transfer of a large amount of heat energy from the ocean to the atmosphere, this phenomenon also has implications for the global climate. It boosts global average surface temperatures on top of the human-caused warming trend from fossil fuel pollution, virtually guaranteeing that 2027 will eclipse 2024 to set a record for the planet’s new warmest year. Studies have shown that strong El Niños can reduce countries’ economic growth through disaster losses and food supply disruptions.
There is an extra dose of uncertainty about this Super El Niño’s impacts because this event is occurring when the world is already much hotter than average due to global warming from fossil fuel pollution.
Sea levels are rising faster than at any time in 4,000 years, with China’s major coastal cities at particular risk. The rapid increase is driven by warming oceans and melting ice, while human activities like groundwater pumping make it worse.
Also a group of scientists, whose research was recently published in Science, used satellite data to determine why these severe heat waves are happening. They found that 96% of the world’s ocean surfaces experienced heat wave conditions, compared with a historical (1982–2022) average of 73.7%. They also found that the average duration of heat waves had gone up to 120 days, quadrupling the historical average.
I am a Reform Rabbi who believes our planet and our species will survive and thrive through the coming climate change catastrophes, but the longer humans delay transforming our way of life away from carbon based fuels like gas, oil and coal; the more it will cost us.
The majority of Christians, Jews, and Muslims do not believe that all of humanity is moving closer and closer to a catastrophic Judgement Day. The minority who do think that Judgement Day is coming soon share the usual negative, fear-filled views of most end-times thinkers: Christians, Jews and especially Muslims, who do believe that: “The hour (of Judgement) is near” (Qur’an 54:1); and ˹The time of˺ people’s judgment has drawn near, yet they heedlessly turn away.” (Qur’an 21:1)
According to a 2012 poll by the Pew Research Center, at least half of Muslims in nine Muslim-majority countries believe that the coming of the Mahdi is “imminent,” and could happen in their lifetime. Sadly these end-times thinkers always see pre-ordained threats of a cataclysmic world wide doom; and not just the warning of the consequences if we humans do not repent and change our behavior.
This is clearly a warning for all serious Christians, Jews and Muslims. A World Meteorological Organization forecast for the next several years also predicts a 90% chance that the world will set yet another record for the hottest year by the end of 2026; that the Atlantic will continue to brew more potentially dangerous hurricanes; meteorologists say large parts of land in the Northern Hemisphere will be 1.4 degrees warmer than recent decades, and the U.S. Southwest’s drought will continue.
It is true that human society has changed more rapidly, violently, and fundamentally in the last century of the second millennium than ever before in history. Doctors saved the lives of millions. Dictators sacrificed the lives of millions. Populations exploded and birthrates declined. Technology produced both worldwide prosperity and pollution at the same time.
Knowing all this, should we look upon the first century of the third millennium with optimistic hope or with fatalistic trepidation? Are the world and our society heading towards a wonder-filled new age, or toward a doomsday; or are both occurring concurrently because breakdown is always a prelude to breakthrough?
Many who believe in the Biblical vision of a Messianic Age use the insights of the Prophets of Israel to provide guidance in understanding the social, economic, scientific, and cultural upheavals sweeping society. Usually, it is the dramatic dangers of the pre-Messianic tribulation that are emphasized. I will focus on the positive signs developing throughout the world that accord with the Messianic vision of the Biblical Prophets.
In most non-Abrahamic religious traditions, redemption is defined only in terms of individual enlightenment or personal salvation. However, the Abrahamic Prophets said that redemption is a transformation of human society that would occur through the catalyst of the transformation of the Abrahamic religious community. This transformation, which will take place in this world at some future time, is called the Messianic Age.
The transition to the Messianic Age is called the birth pangs of the Messiah. The birth of a redeemed Messianic world may be the result of easy or difficult labor. If everyone would simply live according to the moral teachings of his or her religious tradition, we would ourselves bring about the Messianic Age. But, if we will not do it voluntarily, it will come through social and political upheavals, worldwide conflicts, and generation gaps. The Messiah refers to an agent of God who helps bring about this transformation.
The Jewish tradition teaches that this agent of God (and there will be three or four such agents) will be a human being, with great spiritual leadership qualities similar to Prophets Moses or Mohammed. For Jews, the Messianic hope helped them to survive many years of oppression and evil. For Christian and Muslims the Messianic hope will be the second coming of Jesus and the Muslim Mahdi, leading up to God’s Judgement Day-Qiyamah vindication for righteous believers; and the establishment of God’s kingdom on Earth…
The arrival of the Messianic Age is what’s really important, not the specific personality of the agents who bring it about since they are simply the instruments of God, who ultimately is the real Redeemer.
The Messianic Age is usually seen as the solution to all of humanity’s basic problems. This may be true in the long run but the vast changes the transition to the Messianic Age entails will provide challenges to society for many generations to come.
The majority of Christians, Jews, and Muslims do not believe that all of humanity is moving closer and closer to a catastrophic Judgement Day. The minority who do think that Judgement Day is coming share the usual negative, fear-filled views of most end-times thinkers: Christians, Jews and especially Muslims, who do believe that: “The hour (of Judgement) is near” (Qur’an 54:1); and ˹The time of˺ people’s judgment has drawn near, yet they heedlessly turn away.” (Qur’an 21:1)
Sadly these end-times thinkers always see pre-ordained threats of cataclysmic world wide doom; and not just as Armageddon being a warning of the consequences if we humans do not repent and change our behavior. Armageddon comes from the name in the Hebrew Bible for the hill of Megiddo, which is about 80 miles north of Jerusalem, and is today only an archaeological site. The word Armageddon does not appear in the Hebrew Bible and appears only once in the Greek New Testament, in Revelation 16:16.
Armageddon is a Greek transliteration of the Hebrew har məgiddô (הר מגידו). Har in Hebrew means “a mountain or hill”. Armageddon is usually seen as the final battle or battles between good and evil which lasts for only a short time; compared to the Messianic Peace that follows Armageddon that lasts until large carnivores eat only Plant based meat. Armageddon is a powerful challenge that can be overcome if most people will stop fighting each other and co-operate to reduce climate change.
Also in our own generation we have seen the dramatic fulfillment of Isaiah’s prophecy: “I will bring your offspring from the (Middle) East and gather you from the (European) West. To the North (Russia) I will say ‘give them up’ and to the South (Ethiopia) ‘do not hold them’. Bring my sons from far away, my daughters from the end of the earth.” (43:5-6)
Isn’t it amazing how people adjust to living in a radically new world and forget the past? Indeed, the Prophet Isaiah himself proclaimed God’s message, “Behold, I create a new Heaven and a New Earth, and former things shall not be remembered.” (65:17)
Where does the Mahdi, Prophet Jesus and the last Messiah fit in with all of this? They will still have lots to do when they arrive. Now that a large part of the Jewish people have returned to the Land of Israel, and resurrected a Jewish State, one might think that rebuilding a temple on the site where Solomon originally built one almost 3,000 years ago, would be relatively simple.
And it would, except for the fact that a Muslim Shrine called The Dome of the Rock presently occupies the Jerusalem Temple of Prophet Solomon site. Often erroneously called the Mosque of Omar, it is not a mosque and it was not built by Omar. It was built in 691 by Abd-Al-Malik and it is regarded by Muslims as the third holiest site in the world. Any attempt to replace the Dome of the Rock would provoke a Muslim Holy War of cataclysmic proportions.
There is open land on the Temple Mount, and a small 3D digital broadcast Jewish house of worship like Solomon’s Temple could be rebuilt as a virtual replica like those made by the Factum Foundation, a Madrid-based nonprofit that creates high-resolution digital replicas of the world’s cultural heritage; could be built near the Dome of the Rock provided the Muslims would cooperate.
Most observers agree that anyone who could arrange such Jewish-Muslim cooperation would really be the Messianic Ruler of Peace (Isaiah 9:5) Christian support for such a cooperative venture would also be very important, and anyone who can bring Jews, Christians, and Muslims together in mutual respect and cooperation would surely fulfill the greatest of all Messianic predictions: “They shall beat their swords into plowshares and their spears into pruning knives; nation shall not take up sword against nation, they shall never again teach war.” (Isaiah 2:4)
Indeed, such Jewish/Christian/Muslim cooperation would not be possible without great spiritual leadership in all three communities. Thus, each community could consider its leadership to be the Messiah and this would fulfill the culminating verses of Isaiah’s Messianic prophecy as enlarged upon by Micah (4:3-5),
“They shall beat their swords into plowshares and their spears into pruning knives. Nation shall not take up against nation, they shall never again teach war, but every man shall sit under his grapevine or fig tree with no one to disturb him, for it is the Lord of Hosts who spoke. Though all peoples walk each in the name of its God, we will walk in the name of the Lord our God forever and ever.”
Then, “On that day there will be a highway from Egypt to Assyria. The Assyrians will go to Egypt and the Egyptians to Assyria. The Egyptians and Assyrians will worship together. On that day Israel will join a three-party alliance with Egypt and Assyria, a blessing upon the heart. The LORD of Hosts will bless them saying, “Blessed be Egypt My people, Assyria My handiwork, and Israel My inheritance.”…(Isaiah 19:23-5)
I know that Prophets Jesus and Muhammad warned their own communities about trying to calculate a specific end-time date for Messianic events. In the New Testament when prophet Jesus was asked in private by his disciples, “What will be the sign for your coming (back) and the end of the (present) age?” (Matthew 24:3) Prophet Jesus warned his disciples about all kinds of upheavals and false Messiahs that will come; and then concludes by saying, “But about that day and hour no one knows, not even the angels in heaven, not even the son: only the Father.” (24:36) A similar statement was made by Prophet Muhammad when he was asked, “Tell me about the Hour”. He replied: “The one questioned about it knows no better than the questioner.” (Muslim book 1:1&4)
Yet we should never give up the positive Messianic hope that if each of the three Abrahamic religious communities truly follows the best of its own religious teachings; God has assured us that the Messiah will arrive, and one way or another, God’s Qiyamah-Judgement Day will arrive and God’s Kingdom of worldwide peace and prosperity will be established.
About Rabbi Allen S. Maller
Allen Maller retired in 2006 after 39 years as Rabbi of Temple Akiba in Culver City, Calif. He is the author of an introduction to Jewish mysticism. God. Sex and Kabbalah and editor of the Tikun series of High Holy Day prayerbooks.
View all posts by Rabbi Allen S. Maller →

Bathers enjoy a summer day due to the high temperatures at Agua Dulce beach in the Chorrillos district, Lima, Peru, February 25, 2024. REUTERS/Sebastian Castaneda//File Photo
June 11, 2026
El Niño is a recurring climate event with impacts across the globe. It has three phases: one cold (known as La Niña), one neutral, and one warm (El Niño).
In 2026, spring in the northern hemisphere took place in a neutral phase, which followed a relatively mild La Niña. Short-term forecast models indicate that by mid-year it is very likely that we will enter an El Niño phase. This El Niño could become very intense towards the end of the year, with talk of a “super-El Niño”. But what effects might it have? And has something similar happened in the past?
An anomalous Pacific current
This occasional anomalous warm ocean current in the Pacific was originally noted by 19th-century Peruvian fishermen. They called it El Niño – “the child” in Spanish – because it often arrived around Christmas time.
It occurred when warm waters from the equatorial Pacific replaced the usual cold waters off the coasts of Ecuador (south of the city of Guayaquil), Peru and northern Chile. These waters are normally quite cold due to the Humboldt Current – which flows from south to north along this sections of South America’s coastline – and due to the upwelling of deep cold waters.
The impact of these currents is significant. Take, for instance, the Chilean city of Antofagasta on the Pacific coast, and Rio de Janeiro on the Atlantic coast. They are at almost exactly the same latitude, the Tropic of Capricorn, but their average sea temperatures are very different: around 18°C in Antofagasta and 24°C in Rio de Janeiro.
For Peruvian fishermen, the arrival of the warmer El Niño current meant the disappearance of their most abundant and prized fish, the anchoveta, which thrives in cold, plankton-rich waters.
An ocean and atmospheric phenomenon
In the 1920s, British physicist and climatologist Gilbert Walker made a surprising discovery. While analysing vast amounts of atmospheric pressure data, he realised that when pressure increased in the South American Pacific, it decreased in northern Australia and Indonesia, and vice versa. In other words, these two regions of the planet, thousands of kilometres apart, were connected in terms of atmospheric pressure behaviour. This is what we now call a teleconnection, a long-distance meteorological link.
This coordinated oscillation in atmospheric pressure across the South Pacific was named the Southern Oscillation. But what does El Niño, an ocean current, have to do with the Southern Oscillation, an atmospheric phenomenon?
As well as having a negative impact on the Peruvian fishing industry, El Niño brings rainfall – sometimes torrential – to the arid regions of Peru and northern Chile, home to the world’s driest desert, the Atacama. In 1957-1958, a very intense El Niño caused torrential rainfall in Peru and other countries, and a severe drought in India and Southeast Asia, spurring further research into the phenomenon.
In the 1960s, Norwegian-American meteorologist Jacob Bjerknes found that the warming of the South American Pacific caused by El Niño was linked to the Southern Oscillation, thereby establishing a close connection between the ocean and the atmosphere.
When the South Pacific tropical anticyclone – with its associated trade wind pattern that blows from South America towards Australia and Indonesia – weakens, the waters of the equatorial Pacific warm and begin to shift towards Central America. There they branch off, mainly southwards, along the coasts of parts of Ecuador, Peru and Chile. This is how El Niño is generated.
Bjerknes demonstrated that the atmosphere and the ocean are closely linked, and that what happens in one part of the climate system has an impact elsewhere. Combining the names of the oceanic and atmospheric components gave rise to the El Niño’s official name: El Niño-Southern Oscillation (often abbreviated to ENSO).
The worst El Niño of the 20th century
In 1982–83, the most intense El Niño of the 20th century caused extreme weather events throughout the world, including floods in the American Pacific and in the southern United States, and droughts in north-eastern Brazil and Indonesia. It also caused a very mild winter in the mid-latitudes of Europe, Asia and North America.
From that point onward it was observed that, from time to time, temperatures in the equatorial Pacific also showed a negative anomaly, meaning they were lower than normal. At the same time, the South Pacific high-pressure system strengthened, along with the trade winds. This situation was the opposite of El Niño and was named La Niña.
In short, El Niño brings warm waters and instability, while La Niña brings colder waters than normal and greater stability to Ecuador, Chile and Peru. These phenomena form recurring cycles, though not over fixed periods of time.
The last intense El Niño of the 20th century occurred in 1997–98, causing severe flooding in California. It received widespread media coverage, as the disasters occurred in the US.
How might the next intense El Niño behave?
A super-El Niño would undoubtedly lead, if not in 2026 then certainly in 2027, to a higher global average temperature – a few tenths of a degree above what would be expected given the current rate of global warming. There would also be heavy rainfall in the aforementioned Andean countries, the Argentinian area of Mar del Plata, East Africa, and parts of the southern United States, with severe droughts in Southeast Asia, parts of Australia and northeastern Brazil.
In the Mediterranean basin, the El Niño-La Niña cycle is weaker, largely due to the region’s unique geographical characteristics. However, during a very strong El Niño event it can expect higher than normal temperatures, and perhaps a greater likelihood of extreme rainfall.
In any case, what once appeared to be a phenomenon confined to Peruvian fishing grounds is now known to be a global interaction between the atmosphere and the ocean, with repercussions that can be catastrophic in regions far removed from its source.

Javier Martín Vide, Catedrático de Geografía Física, Universitat de Barcelona
This article is republished from The Conversation under a Creative Commons license. Read the original article.
'The big one': CA braces for massive earthquake as fault stress hits 1,000-year peak
June 09, 2026
ALTERNET
California's fault lines are under the most amount of stress than they've experienced in 1,000 years, researchers revealed.
A new study published in the Journal of Geophysical Research, Solid Earth, cites concerns that a major earthquake might be on the horizon. There's no real way of knowing when it could happen, the experts warned.
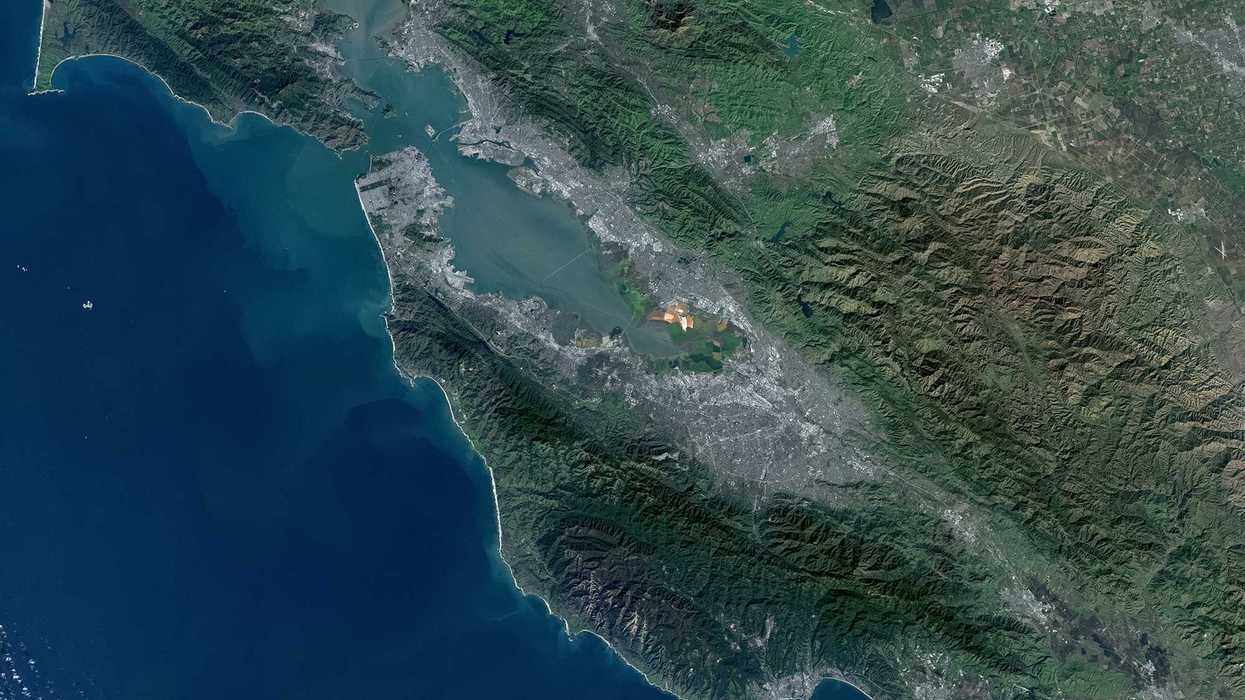
Gizmodo reported the study on Tuesday, including a visualization from the research team of the tectonic plates in California. These plates are constantly pushing, pulling or sliding. The fault lines are where fractures in the plates accumulate pressure, and stress on those faults can build up over time.
Eventually, when the stress exceeds the friction holding the rocks together, an earthquake occurs as the fault ruptures. The more often there are little earthquakes that release the pressure, the less buildup there can be. The longer it has been since the last quake, the more energy is accumulated. All of that built-up stress energy is released as waves or vibrations that travel through the Earth, moving the ground.
“The question of when and how the next major earthquake will occur in this region is one of the most pressing problems in applied geoscience,” said lead author Liliane Burkhard, a geophysicist and planetary geologist at the University of Bern in Switzerland, in a press release. “Our results provide a clearer, physics-based picture of the current stress state of the fault system, and the framework we developed is not just applicable to California, but also for other complex fault junctions worldwide."
The visualization shows the greatest stress on the fault line northeast of Los Angeles. The last major quake was a magnitude 7.9 in Fort Tejon in 1857. It remains one of the largest on record, Gizmodo recounted. Even the infamous 1994 Northridge quake didn't exceed 7.0, and it cost an estimated $49 billion, the Los Angeles Daily News reported in 2014.
Scientists are fearful that the San Andreas Fault System could move "any day now," the report said.
"Their physics-based earthquake cycle model simulates this process in three spatial dimensions over time," said Gizmodo, citing the research. The scientists put geological data of past quakes into their model, which included things like tree-ring anomalies and radiocarbon dating.
"When they ran it, the results indicated that tectonic stresses along the San Andreas and San Jacinto fault zones have reached and, in some cases, exceeded the highest levels of the last millennium," the report said.
There are two main points in the fault system where the San Andreas and San Jacinto are. Burkhard and her co-researchers called it a kind of "earthquake gate."
“The earthquake gate concept captures something important about how fault junctions work,” Burkhard said in the release. “Cajon Pass doesn’t simply block or channel earthquakes: It responds to stress conditions, and those conditions change over centuries.”
When stress builds up on both faults, it's more likely that one'll rupture at a major joint and cross both systems, the study said. That's why they fear it could be more substantial than quakes in past centuries.
California's fault lines are under the most amount of stress than they've experienced in 1,000 years, researchers revealed.
A new study published in the Journal of Geophysical Research, Solid Earth, cites concerns that a major earthquake might be on the horizon. There's no real way of knowing when it could happen, the experts warned.
Gizmodo reported the study on Tuesday, including a visualization from the research team of the tectonic plates in California. These plates are constantly pushing, pulling or sliding. The fault lines are where fractures in the plates accumulate pressure, and stress on those faults can build up over time.
Eventually, when the stress exceeds the friction holding the rocks together, an earthquake occurs as the fault ruptures. The more often there are little earthquakes that release the pressure, the less buildup there can be. The longer it has been since the last quake, the more energy is accumulated. All of that built-up stress energy is released as waves or vibrations that travel through the Earth, moving the ground.
“The question of when and how the next major earthquake will occur in this region is one of the most pressing problems in applied geoscience,” said lead author Liliane Burkhard, a geophysicist and planetary geologist at the University of Bern in Switzerland, in a press release. “Our results provide a clearer, physics-based picture of the current stress state of the fault system, and the framework we developed is not just applicable to California, but also for other complex fault junctions worldwide."
The visualization shows the greatest stress on the fault line northeast of Los Angeles. The last major quake was a magnitude 7.9 in Fort Tejon in 1857. It remains one of the largest on record, Gizmodo recounted. Even the infamous 1994 Northridge quake didn't exceed 7.0, and it cost an estimated $49 billion, the Los Angeles Daily News reported in 2014.
Scientists are fearful that the San Andreas Fault System could move "any day now," the report said.
"Their physics-based earthquake cycle model simulates this process in three spatial dimensions over time," said Gizmodo, citing the research. The scientists put geological data of past quakes into their model, which included things like tree-ring anomalies and radiocarbon dating.
"When they ran it, the results indicated that tectonic stresses along the San Andreas and San Jacinto fault zones have reached and, in some cases, exceeded the highest levels of the last millennium," the report said.
There are two main points in the fault system where the San Andreas and San Jacinto are. Burkhard and her co-researchers called it a kind of "earthquake gate."
“The earthquake gate concept captures something important about how fault junctions work,” Burkhard said in the release. “Cajon Pass doesn’t simply block or channel earthquakes: It responds to stress conditions, and those conditions change over centuries.”
When stress builds up on both faults, it's more likely that one'll rupture at a major joint and cross both systems, the study said. That's why they fear it could be more substantial than quakes in past centuries.


_54859.jpg)