Weakening Economy, Widespread Hardship Show Urgent Need for Further Relief
The economy remains in a deep hole, with unemployment and underemployment far above pre-pandemic levels.
November 15, 2020 Chad Stone, Claire Zippel, Alicia Mazzara, Catlin Nchako, Arloc Sherman CENTER FOR BUDGET AND POLICY PRIORITIES
,
Policymakers returning to work after the election must redouble their efforts to negotiate a robust relief package to address the critical health and economic challenges facing the nation. With COVID-19 still not under control — in fact, cases are spiking in many parts of the country — and the economic recovery slowing, additional well-designed relief measures are vital to relieving hardship and promoting a stronger recovery. Relief measures enacted earlier this year have mitigated hardship, but they had significant gaps; for example, the SNAP increase in the Families First Act of March left out the poorest 40 percent of SNAP households, including at least 5 million children. The relief measures are also temporary. The $600-per-week federal supplement to unemployment insurance (UI) benefits expired at the end of July and other UI measures will expire at the end of December."RELIEF MEASURES ENACTED EARLIER THIS YEAR HAVE MITIGATED HARDSHIP, BUT THEY HAD SIGNIFICANT GAPS."
Economy Still in Deep Hole
Despite economic growth and labor market improvements since the plunge in economic activity and surge in unemployment in March and April, the economy remains in a deep hole, with unemployment and underemployment far above pre-pandemic levels.
Economic Recovery Losing Momentum
The recovery in economic activity that began in May has lost momentum over the past several months. The onset of COVID-19 produced a sharp contraction in economic activity beginning in March that left real (inflation-adjusted) GDP 10.1 percent lower in the second quarter of 2020 than at the end of 2019. A partial rebound in the third quarter still left GDP 3.5 percent lower than at the end of 2019; by comparison, the deepest GDP hole in the Great Recession was in the second quarter of 2009, when real GDP was 4.0 percent below its level at the start of the recession.[1] Official GDP data are reported only on a quarterly basis, but unofficial estimates suggest that GDP has grown little after rising sharply in May.[2]
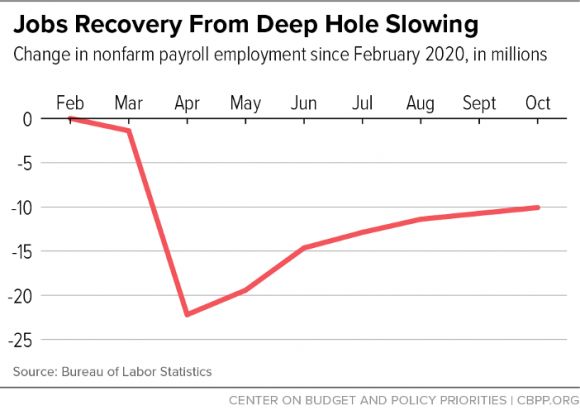
Improvements in the labor market have slowed as well. Like GDP, nonfarm payroll employment plunged in March and April; after a partial rebound in May and June, the pace of job creation has slowed for five consecutive months. Total payroll employment in October was 10.1 million jobs below its February level, with 1.3 million of that jobs gap due to state and local government job losses, many in education. (See Figure 1.) The lack of affordable and safe child care likely is also contributing to suppressing women’s labor force participation.
Figure 1
In the private sector, most job losses have occurred in industries that pay low average wages, where a disproportionate number of workers are people of color. CBPP analysis[3] dividing industries into three groups by average wages, with roughly the same number of jobs in each group as of February, finds that the low-wage group accounted for 52 percent of the jobs lost from February to October. Jobs were down almost twice as much in the low-wage industries (10.7 percent) as in medium-wage industries (5.9 percent) and almost three times as much as in high-wage industries (3.6 percent). The shares of Black, Latino, and immigrant workers in the lowest-wage group of industries exceed their shares of the overall population.
As growth has slowed and the job market has flagged, unemployment spells have lengthened. In the last three months, the number of people who have been looking for work for 27 weeks or longer has grown from 1.5 million to 3.6 million, and increasing numbers of people will exhaust their eligibility for unemployment insurance in coming months. The loss of the $600-a-week federal unemployment benefit supplement has taken purchasing power out of the economy, and people exhausting their benefits will take out more.
The official unemployment rate, which spiked to 14.7 percent in April, has come down to 6.9 percent in October. Although Black and Latino[4] unemployment rates had fallen to historic lows before the crisis — due largely to the longest (128-month) economic expansion in U.S. history — they exceeded the white rate even then. All rates rose sharply in the recession and remained high in October, but the increase since February has been larger for Black and Latino workers (5.0 and 4.4 percentage points, respectively) than for white workers (2.9 percentage points). Black and Latino workers also continued to have a much higher unemployment rate in October than white workers.
These patterns have endured in recessions and recoveries alike and are rooted in this nation’s history of structural racism, which curtails job opportunities for Black people through policies and practices such as unequal school funding, mass incarceration, and hiring discrimination. Black workers tend to be “the last hired and first fired.” High unemployment rates for Latino people, which also consistently exceed the white rate, reflect many of the same barriers to opportunity.
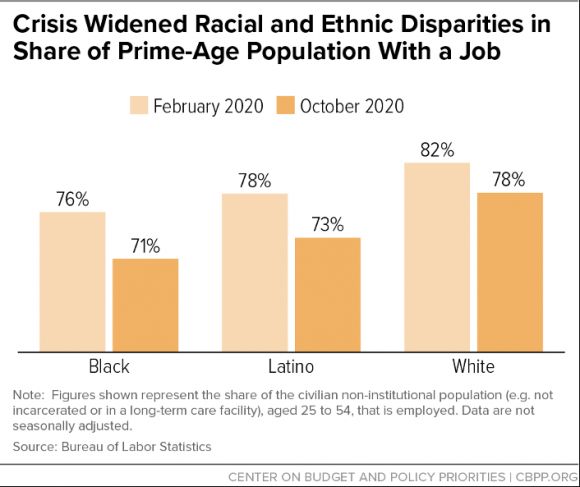
The unemployment rate is an incomplete measure of joblessness because it only includes people who are actively looking for work (or have been laid off but are subject to recall to their former jobs). It doesn’t include people who want a job but haven’t been looking due to the lack of job opportunities. The prime-age employment-to-population ratio — which measures the share of the population aged 25-54 with a job — doesn’t have that shortcoming, and it tells a similar story of large, continuing racial disparities. The employment-to-population ratio was lower for Black and Latino workers than for white workers when the recession started and has fallen more for them since then: by 5.3 percentage points for Black workers and 5.0 percentage points for Latino workers, versus 3.4 percentage points for white workers. (See Figure 2.)
Figure 2
Poverty Rising as Relief Ends
With the end of the CARES Act’s major relief provisions (the one-time stimulus payments of $1,200 per adult and $500 per child and the $600-a-week unemployment insurance supplement that expired on July 31), more families are falling below the poverty line, a number of studies suggest.
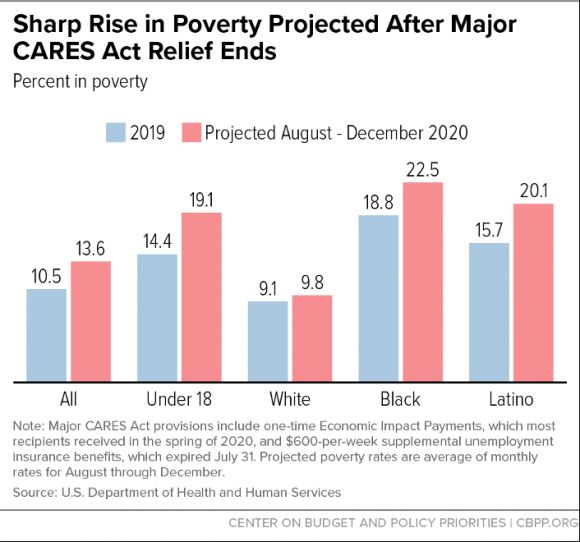
A recent Department of Health and Human Services (HHS) report projects that the crisis will push 10 million people, including nearly 4 million children, below the monthly poverty line in late 2020.[5] This will drive the poverty rate — which was 10.5 percent in 2019 — up to an estimated 13.6 percent. Poverty is rising for all races, the study says, but Black and Latino poverty rates started higher than the white rate in 2019 and are rising faster. (See Figure 3.)
Two other research teams, one from Columbia University[6] and one based in part at the University of Chicago,[7] both found that poverty rose by about 4 million people from June to August after the expiration of the supplemental unemployment benefits. Like the HHS study, both of these studies also found that the economic crisis has widened racial gaps in poverty.
Figure 3
After Great Recession, Prematurely Ending Relief Slowed Recovery
The slowing of the economy and rise in poverty highlight one of the most important lessons from the Great Recession a decade ago: policymakers must not end stimulus and relief measures prematurely. While the Great Recession measures were substantial and prevented an even more severe recession, they ended too soon and were insufficient to promote a recovery that was both rapid and robust. The protracted period of high unemployment and underemployment after the economy began growing again in June 2009 continued to impose hardship and hurt long-term growth.[8] The unemployment rate did not drop below 5.5 percent until 2015, six years into the recovery. Similarly, the measures taken so far to combat the economic fallout from the coronavirus have been substantial and kept things from being even worse, but more is needed to give the recovery added momentum.
Substantial Hardship Amidst COVID-19 Recession and Uneven Recovery
With the economy severely weakened by the sharp rise in unemployment during the pandemic, millions of adults report that their household doesn’t get enough to eat, isn’t caught up on rent, or is having trouble paying for usual household expenses. We can track the extent of this hardship thanks to the Household Pulse Survey, which the Census Bureau launched in April to provide nearly real-time data on how the unprecedented health and economic crisis is affecting the nation.
Households with children face especially high rates of hardship, which research has shown can have serious effects on children’s long-term health and financial security."HARDSHIPS HAVE FALLEN HARDEST ON BLACK AND LATINO ADULTS, WHO SUFFERED THE WORST JOB LOSSES IN THE PANDEMIC AND ENTERED THE PANDEMIC WITH THE MOST DAUNTING ECONOMIC BARRIERS."
Although the nation has a large stake in helping to ensure that all people can meet their basic needs — whether they are struggling to quarantine safely, employed at essential jobs, supporting the economy as consumers, or looking out for their neighbors — the burden of the economic crisis has not been shared equally. Hardships have fallen hardest on Black and Latino adults, who suffered the worst job losses in the pandemic and entered the pandemic with the most daunting economic barriers. These disproportionate impacts reflect harsh, longstanding inequities — often stemming from structural racism — in education, employment, housing, and health care that the current crisis is exacerbating.
Hardship Is Widespread
Nearly 24 million adults — 10.9 percent — reported that their household sometimes or often didn’t have enough to eat in the last seven days, according to Pulse data collected October 14-26. This was far above rates reported before the pandemic: 3.7 percent of adults reported that their household had “not enough to eat” at some point over the full 12 months of 2019, according to earlier survey data.[9]
Millions of Americans are having difficulty paying rent. At least 11.5 million adults living in rental housing — nearly 1 in 6 adult renters — weren’t caught up on rent in late October, we estimate from Pulse data adjusted for the number of adults who didn’t respond to this question in the survey.[10]
Nearly 80 million adults — 1 in 3 — reported it was somewhat or very difficult for their household to cover usual expenses such as food, rent or mortgage, car payments, medical expenses, or student loans in the past seven days, according to data collected in late October. While we don’t have comparable data from before the pandemic, the data noted above on rising levels of food hardship over pre-pandemic rates indicate that economic insecurity has increased.
Hardship Especially Severe Among People of Color
The pandemic and economic fallout have inflicted widespread hardship, especially among Black and Latino adults. Due to inequities driven by racism and discrimination, workers in these communities disproportionately work in low-paid jobs that have been heavily affected by the crisis, and they tend to have fewer assets to fall back on in hard times. Hardship rates are also high for American Indians and Alaska Natives, Pacific Islanders (including Native Hawaiians), and people who identify with more than one race (unfortunately, Pulse shows these groups only in combination, not separately). According to the latest Pulse survey:
Black and Latino adults were more than twice as likely as white adults to report that their household didn’t get enough to eat: 19 percent and 18 percent, respectively, compared to 8 percent of white adults. (Among Asian adults, 6 percent report their household didn’t get enough to eat.)
Renters of color were more likely to report that their household wasn’t caught up on rent: 26 percent of Black renters, 18 percent of Asian renters, and 18 percent of Latino renters said they weren’t caught up on rent, compared to 10 percent of white renters.
Half of Black adults (50 percent) and nearly half of Latino adults (47 percent) reported difficulty paying for usual household expenses, compared to 27 percent of Asian adults and 26 percent of white adults.
Households With Children Face Even Higher Hardship Rates
Households with children face especially high hardship rates. Fourteen percent of parents and other adults living with children reported that the household didn’t get enough to eat, compared to 9 percent of adults in households without children. (See Figure 4.) And 8 to 14 percent[11] of adults living with children reported that the children didn’t get enough to eat because they couldn’t afford it. Children who don’t get enough to eat are at risk of worse developmental, health, and even economic outcomes down the road. [12]
Similarly, renters who live with children were twice as likely to report they weren’t caught up on rent: 22 percent, compared to 11 percent for renters without children. Households unable to pay rent could face housing instability, homelessness, and eviction in the coming months. The forced moves that result from evictions are particularly harmful for children and can disrupt their social, physical, and academic development.[13]
Figure 4
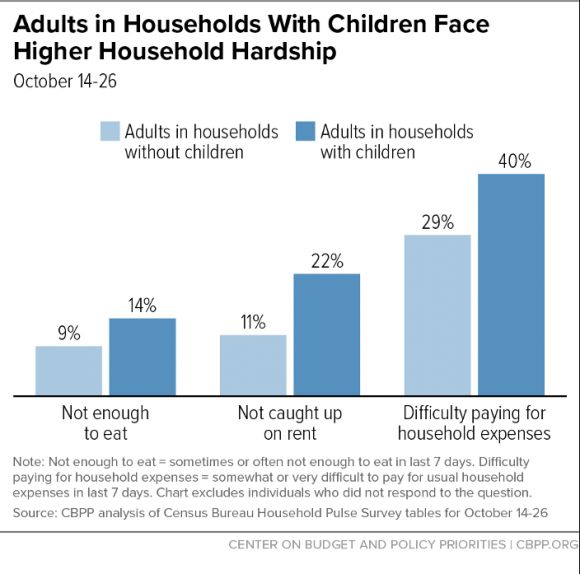
In addition, adults in households with children were more likely to report difficulty paying for usual expenses: 40 percent, compared to 29 percent for households without children. Financial hardship can have serious effects on children’s long-term health and education, research shows.[14]
More detailed data from the Pulse survey collected September 30-October 12 allow a closer look at hardship among children. (These figures are approximations; the Pulse Survey was designed to provide data on adult well-being, not precise counts of children.)
Between 7 and 11 million children live in a household where children didn’t eat enough because the household couldn’t afford it.
Children in renter households face high rates of food hardship. Among children living in rental housing, 1 in 4 live in a household that didn’t have enough to eat and 4 in 10 live in a household that either didn’t get enough to eat or wasn’t caught up on rent.
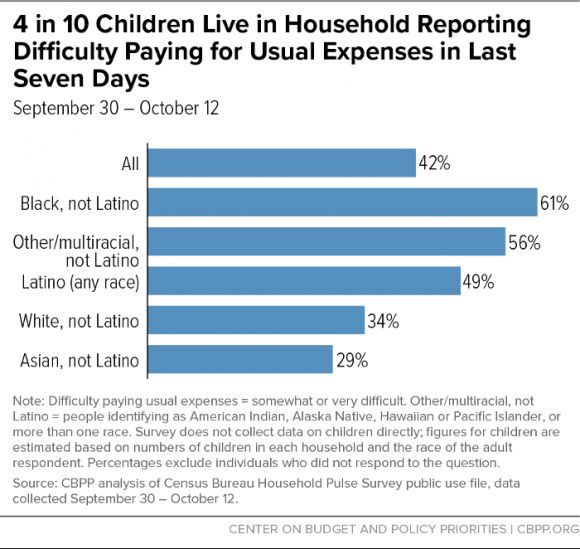
An estimated 42 percent of children live in households that have trouble covering usual expenses. They include 61 percent of children in Black households and 49 percent of children in Latino households, as well as 34 percent of children in white households. (The survey asks the race of the adult respondent, not the children.) (See Figure 5.)
Figure 5
End Notes
[1] GDP growth rates for a given quarter are normally reported at an annualized rate, i.e., the compounded growth rate if the same quarterly rate were sustained for four quarters. Real GDP fell at an annualized rate of 5.0 percent in the first quarter of 2020 and 31.4 percent in the second quarter, before rising at a 33.1 percent annualized rate in the third quarter. But because GDP was so much lower in the second quarter than at the end of 2019, the third-quarter growth was much smaller in dollar terms than the second-quarter drop, leaving GDP in the third quarter 3.5 percent lower than at the end of 2019.
[2] For example, see Jason Furman, https://twitter.com/jasonfurman/status/1321903462875975680.
[3] The analysis, which was first done when the April jobs data came out, is described more fully in https://www.cbpp.org/blog/people-already-facing-opportunity-barriers-hit-hardest-by-massive-april-job-losses.
[4] Federal surveys generally ask respondents whether they are “of Hispanic, Latino, or Spanish origin.” This report uses the term “Latino.”
[5] Suzanne Macartney et al., “Projections of Poverty and Program Eligibility during the COVID-19 Pandemic,” Department of Health and Human Services, October 2020, https://aspe.hhs.gov/system/files/pdf/264151/poverty-program-eligibility-covid.pdf.
[6] Zachary Parolin et al., “Monthly Poverty Rates in the United States during the COVID-19 Pandemic,” October 15, 2020, https://static1.squarespace.com/static/5743308460b5e922a25a6dc7/t/5f87c59e4cd0011fabd38973/1602733471158/COVID-Projecting-Poverty-Monthly-CPSP-2020.pdf.
[7] Jeehoon Han, Bruce D. Meyer, and James X. Sullivan, “Real-time Poverty Estimates During the COVID-19 Pandemic,” October 18, 2020, http://povertymeasurement.org/wp-content/uploads/2020/10/Real-time-Poverty-Estimates-through-September-2020-1.pdf.
[8] Chad Stone, “Fiscal Stimulus Need to Fight Recessions: Lessons from the Great Recession,” CBPP, April 16, 2020, https://www.cbpp.org/research/economy/fiscal-stimulus-needed-to-fight-recessions.
[9] The pre-pandemic figures are from other surveys that are not precisely comparable to Pulse, but the increase appears much too large to simply reflect methodological differences between surveys. See Brynne Keith-Jennings, “Food Need Very High Compared to Pre-Pandemic Levels, Making Relief Imperative,” CBPP, September 10, 2020, https://www.cbpp.org/blog/food-need-very-high-compared-to-pre-pandemic-levels-making-relief-imperative.
[10] The latest Pulse survey estimates that 8.4 million adults live in households not caught up on rent. To adjust for non-response in the survey, we apply the share of responding renters in Pulse not caught up on rent (15.7 percent) to the total number of adult renters in the March 2020 Current Population Survey (73 million) to calculate an adjusted estimate. These figures likely understate the percentage and number of people struggling to pay rent; a large share of survey respondents did not answer the housing questions in the Pulse survey, and this “non-response” was more frequent among groups that struggle to afford rent. For details, see “Tracking the COVID-19 Recession’s Effects on Food, Housing, and Employment Hardships,” CBPP, updated November 9, 2020, https://www.cbpp.org/research/poverty-and-inequality/tracking-the-covid-19-recessions-effects-on-food-housing-and.
[11] The 8-14 percent range reflects the different ways to measure food hardship in the Household Pulse Survey.
[12] Brynne Keith-Jennings, “Boosting SNAP: Benefit Increase Would Help Children in Short and Long Term,” CBPP, July 30, 2020, https://www.cbpp.org/blog/boosting-snap-benefit-increase-would-help-children-in-short-and-long-term.
[13] Sonya Acosta, Anna Bailey, and Peggy Bailey, “Extend CARES Act Eviction Moratorium, Combine With Rental Assistance to Promote Housing Stability,” CBPP, July 27, 2020, https://www.cbpp.org/research/housing/extend-cares-act-eviction-moratorium-combine-with-rental-assistance-to-promote.
[14] Ajay Chaudry and Christopher Wimer, “Poverty is Not Just an Indicator: The Relationship Between Income, Poverty, and Child Well-Being,” Academic Pediatrics, Vol. 16, Issue 3, April 1, 2016, https://www.academicpedsjnl.net/article/S1876-2859(15)00383-6/fulltext.
Chad Stone
Areas of Expertise:
Federal Budget
Economy
Climate Change
Immigration
Recent Work:
Weakening Economy, Widespread Hardship Show Urgent...
Jobs Report: Improvements Slowing, Jobs Hole Remains...
6 Signs That the Labor Market Remains in Deep Trouble
Claire Zippel
Recent Work:
Weakening Economy, Widespread Hardship Show Urgent...
Latest Data: 1 in 3 Adults Having Trouble Paying...
New Data: Millions Struggling to Eat and Pay Rent
Alicia Mazzara
Areas of Expertise:
Housing
Funding
Housing Vouchers
Renters' Credit
Recent Work:
Weakening Economy, Widespread Hardship Show Urgent...
New Data: Millions Struggling to Eat and Pay Rent
More Relief Needed to Alleviate Hardship
Catlin Nchako
Recent Work:
Weakening Economy, Widespread Hardship Show Urgent...
New Data: Millions Struggling to Eat and Pay Rent
House Farm Bill Would Increase Food Insecurity and...
Arloc Sherman
Areas of Expertise:
Poverty and Inequality
Family Income Support
Recent Work:
Weakening Economy, Widespread Hardship Show Urgent...
4 in 10 Children Live in a Household Struggling to...
New Data: Millions Struggling to Eat and Pay Rent
Click HERE to Support the Center on Budget and Policy Priorities
No comments:
Post a Comment