Arctic Sea Ice extent is declining on its way to the September annual minimum
By: Author Renato R. Colucci
Published: 23/07/2022
Categories Global weather
Between 15 and 17 July, Greenland’s north-western ice sheet lost 6 million tons of water per day. This exceptional melting was caused by exceptionally high temperatures which particularly affected the northernmost area of Greenland. Meanwhile, the Arctic sea ice extent continues to decline at moderate rates with slightly higher values than in recent years.
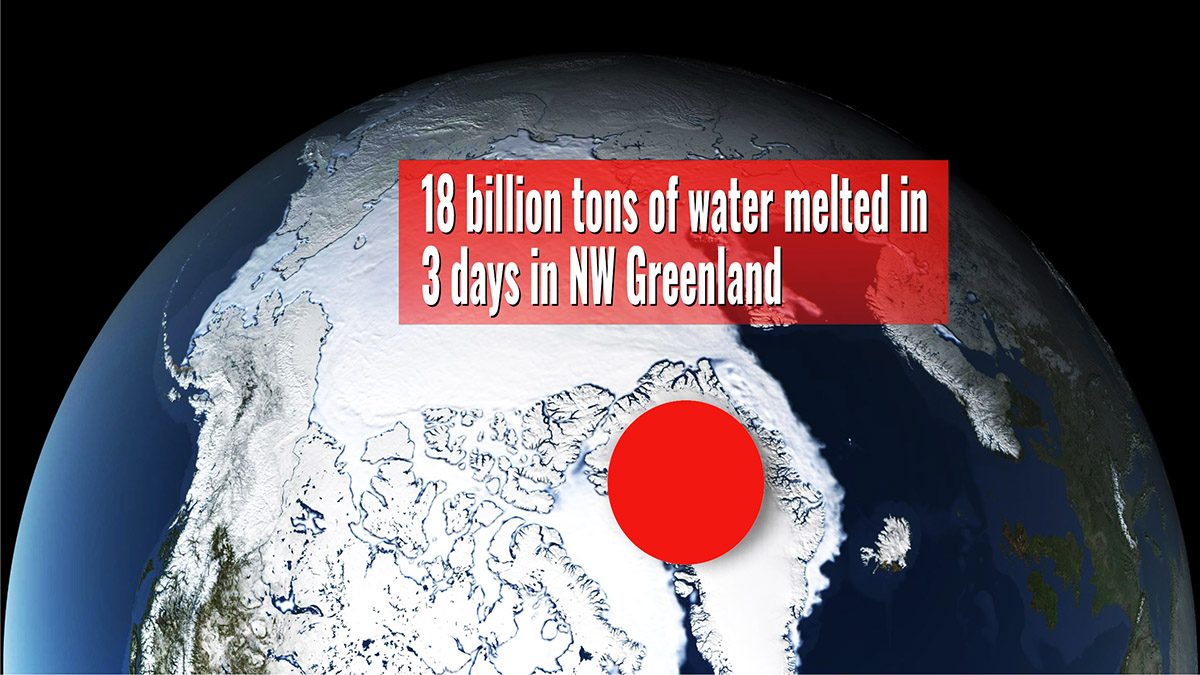
Off the coast of northwest Greenland, the water is perfectly still but puddling on icebergs indicates a transformation is on the way. Rapid melting triggered by unusually warm temperatures affected a large part of NorthWest Greenland in the last few days. In northern Greenland the temperature top nearly ten degrees higher than normal forcing 45% of Greenland’s ice sheet surface to melt.

Katalin Savlan, Research Scientist at the University of Texas-Austin says “it definitely worries me, we are at 67 latitudes and we can hang around in t-shirts”. At a research site in northeast Greenland near melt, conditions occurred at an elevation of nearly 9000 feet.
Aslak Grinbsted reported as they had their mini heatwave at Egrip field station INTERACT in the middle of the Greenland ice sheet with -1.6°C reported. Their planned planes have been postponed because their skiway is not safe when it is this warm.
The National Snow and Ice Data Center in Colorado Boulder tell from July 15th through July 17th alone a melt surge in northern Greenland caused ice sheet runoff of about 6,000,000,000 (billions) tons of water per day. That’s about the volume of 2,400,000 (millions) Olympic-sized swimming pools. Put in another way enough water to flood the entire state of West Virginia in the U.S. with one foot of water in three days.

By: Author Renato R. Colucci
Published: 23/07/2022
Categories Global weather
Between 15 and 17 July, Greenland’s north-western ice sheet lost 6 million tons of water per day. This exceptional melting was caused by exceptionally high temperatures which particularly affected the northernmost area of Greenland. Meanwhile, the Arctic sea ice extent continues to decline at moderate rates with slightly higher values than in recent years.
Off the coast of northwest Greenland, the water is perfectly still but puddling on icebergs indicates a transformation is on the way. Rapid melting triggered by unusually warm temperatures affected a large part of NorthWest Greenland in the last few days. In northern Greenland the temperature top nearly ten degrees higher than normal forcing 45% of Greenland’s ice sheet surface to melt.
Katalin Savlan, Research Scientist at the University of Texas-Austin says “it definitely worries me, we are at 67 latitudes and we can hang around in t-shirts”. At a research site in northeast Greenland near melt, conditions occurred at an elevation of nearly 9000 feet.
Aslak Grinbsted reported as they had their mini heatwave at Egrip field station INTERACT in the middle of the Greenland ice sheet with -1.6°C reported. Their planned planes have been postponed because their skiway is not safe when it is this warm.
The National Snow and Ice Data Center in Colorado Boulder tell from July 15th through July 17th alone a melt surge in northern Greenland caused ice sheet runoff of about 6,000,000,000 (billions) tons of water per day. That’s about the volume of 2,400,000 (millions) Olympic-sized swimming pools. Put in another way enough water to flood the entire state of West Virginia in the U.S. with one foot of water in three days.
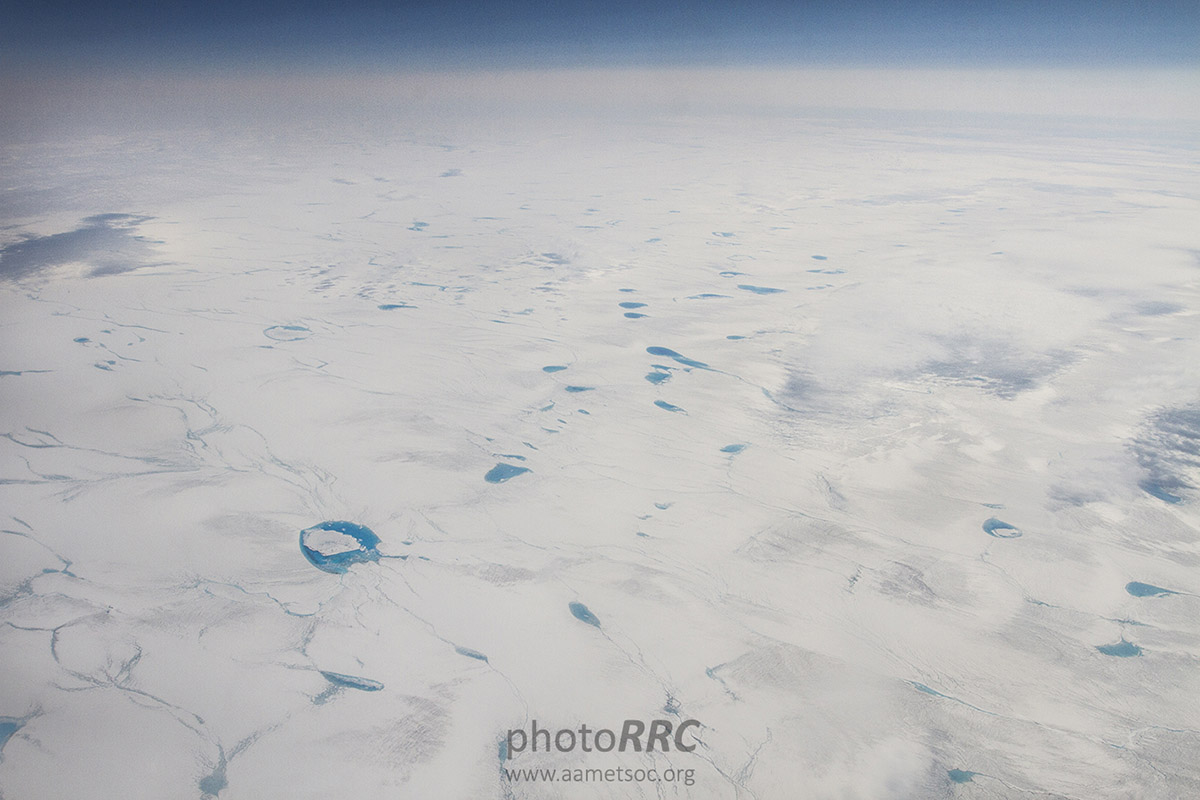
Photo Renato R. Colucci
This extensive melt in north Greenland this past week is quite unusual and will contribute to global sea level raise which impacts coastal communities half a world away.
Soaring temperatures during the summer of 2019 caused the island to lose more than 530 billion tons from its ice sheet, which was the largest loss in a year since record-keeping began in 1948. This caused the global sea levels to rise 1.5 millimeters. And since the late 1990s, a combination of Greenland and Antarctic ice loss has raised sea levels by 1.8 centimeters (0.7 inches).
ARCTIC SEA ICE MID-SUMMER 2022
The Arctic sea ice extent on July 18, 2022, continued its summer decline and was 8.42 million square kilometers (3.25 million square miles) according to the National Snow and Ice Data Center. The decline rate of the extent through the first half of July was near the 1981 to 2010 average.
Although this extent is the highest in the last 13 years in the satellite record according to the Arctic Data archive System NIPR, roughly 0.2 million square kilometers above the 2010s average, and very close to that one of 2018, it is actually more than 2.0 million square kilometers (0.16 million square miles) below the 1980s average and 1.5 million square kilometers (0.16 million square miles) below the 1990s average. the 16th lowest extent ever recorded on this day of the year.
The most notable area of ice loss so far is in the Laptev Sea. This is similar to the pattern of the last two years, but much less extreme than detected in 2020 and 2021 when the Laptev Sea ice extent was at or near record low levels in June and July. Extent continues to be below average in the Barents Sea.

WHAT IS SEA ICE
Sea ice means all sorts of ice that form when seawater freezes. Sea ice that is not fast ice refers to drift ice, and, if the concentration exceeds 70%, it is called pack ice. When sea ice concentration is lower than 15% this is considered as open water, and the boundary between open water and ice is called the ice edge.
Sea ice cover in the Arctic grows throughout the winter and peaks in March. In September the sea ice extension reaches its minimum, which is generally only around one-third of its winter maximum. In order to get a proper picture of the sea ice state, there is a need of determining both extents and volumes. Such numbers primarily include the ice thickness, generally linked to the age of the ice. In the image below, Arctic sea ice climatology from 1981-2010 by the Snow and Ice Data Center, University of Colorado, Boulder.
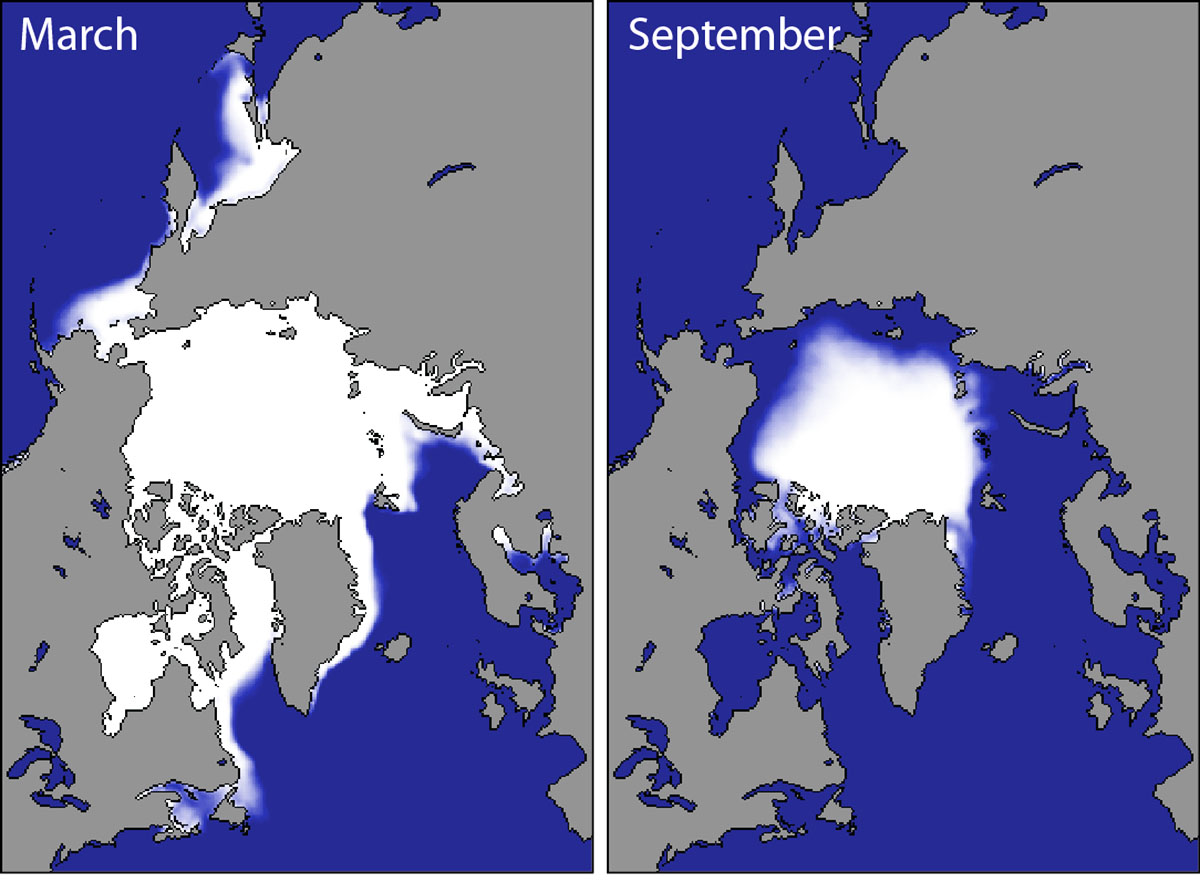
Winter ice extent is generally a weaker indicator of what the ice extent will look like in September when we will face the annual minimum. The seasonal cycle of Arctic sea ice is characterized by the maximum annual extent in March, decreasing through spring and summer to an annual minimum extent in September.
Since 1979 it has been possible to monitor sea ice by satellite. At present, We have 44 years of reliable information on the extent of the sea ice cover. The sea ice had continuously diminished and particularly since the end of the 1990s. Nevertheless, the winter trend is different from the summer trend.
In the image below the Arctic sea ice extent develops at the end of the winter season (March maximum) and by the end of the summer (September minimum)

HOW WAS THE FIRST PART OF THE SUMMER IN THE ARCTIC
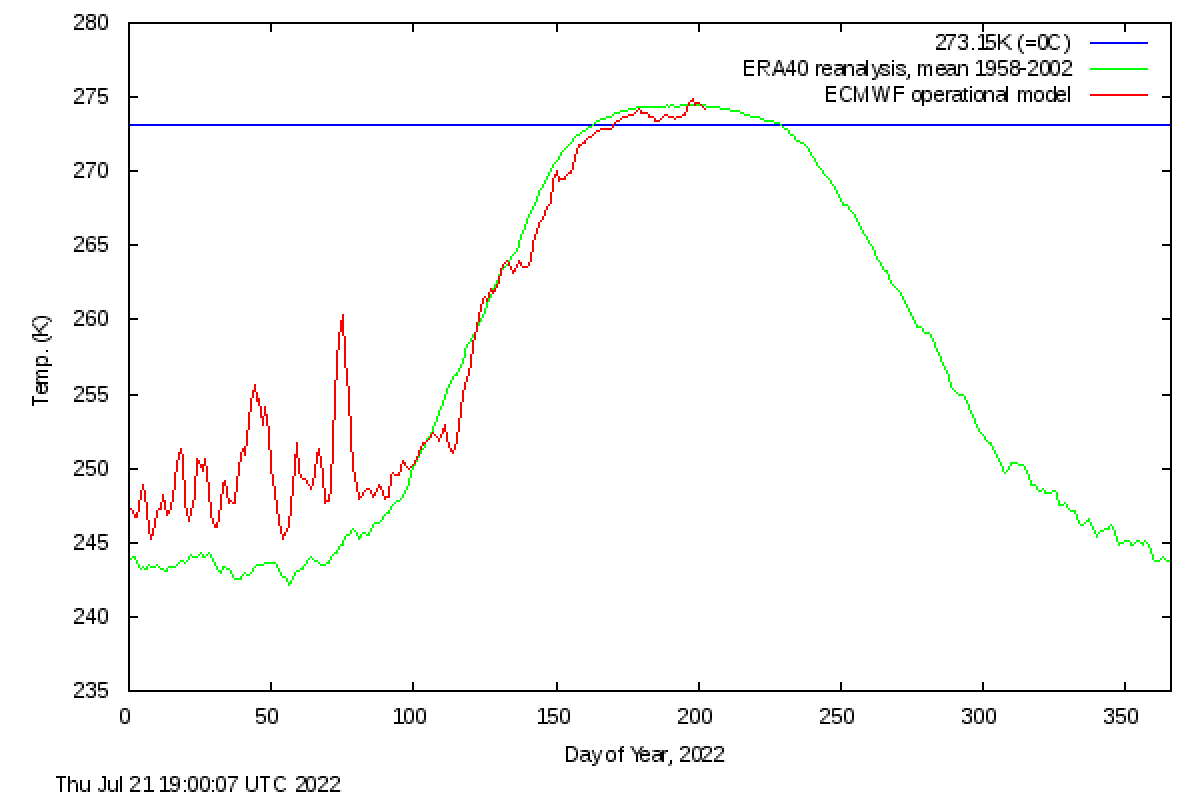
The daily mean temperature of the Arctic area north of the 80th northern parallel is estimated from the average of the 00z and 12z analysis for all model grid points inside that area. The ERA40 reanalysis data set from ECMWF has been applied to calculate daily mean temperatures for the period from 1958 to 2002. From 2002 to the present the operational model (at all times) from The ECMWF is used for mean temperature calculations.
The ERA40 reanalysis data, has been applied to calculate daily climate values that are plotted along with the daily analysis values in all plots. The data used to determine climate values is the full ERA40 data set, from 1958 to 2002. From the plot below is pretty evident as summer temperatures in the Arctic are following the average without any important deviation from mean values.
The first half of July 2022 saw high thermal regional contrasts. On the Eurasian side of the Arctic, particularly in the Laptev and Barents Seas, spreading toward the North Pole, air temperatures at the 925 mbar level (about 2,500 feet about the surface) were three to six degrees Celsius (5 to 11 degrees Fahrenheit) below average.
On the North American side of the Arctic, air temperatures were as much as eight degrees Celsius (14 degrees Fahrenheit) above average, remarkably in the western Canadian Arctic Archipelago and the southeast Beaufort Sea. The synoptic pattern was controlled by low pressure over the Laptev Sea sector, centered near the North Pole.

Enhanced melt pond formation and evolution were mainly triggered by Warm conditions in the Canadian Arctic Archipelago. A region of low concentration ice appeared near the North Pole in the Laptev and Kara Seas sector. Low pressure over this region in early July, often results in the departure of the ice cover and likely helped form the low sea ice concentration area.
925 hPa Air temperature in June over the Arctic was close to the long-term average. Most of the high-latitude Arctic Ocean was within a degree of the 1981 to 2010 average temperature. Temperatures in Scandinavia, Svalbard, and northern European Russia were instead definitely warmer and generally two to three degrees Celsius (4 to 5 degrees Fahrenheit) above average.
The Hudson Bay reported temperatures of four to five degrees Celsius (7 to 9 degrees Fahrenheit) above average. Temperatures over central Greenland, the northern Yukon and North Slope, and easternmost Siberia were on the contrary much colder, generally two to four degrees Celsius (4 to 7 degrees Fahrenheit) below average.
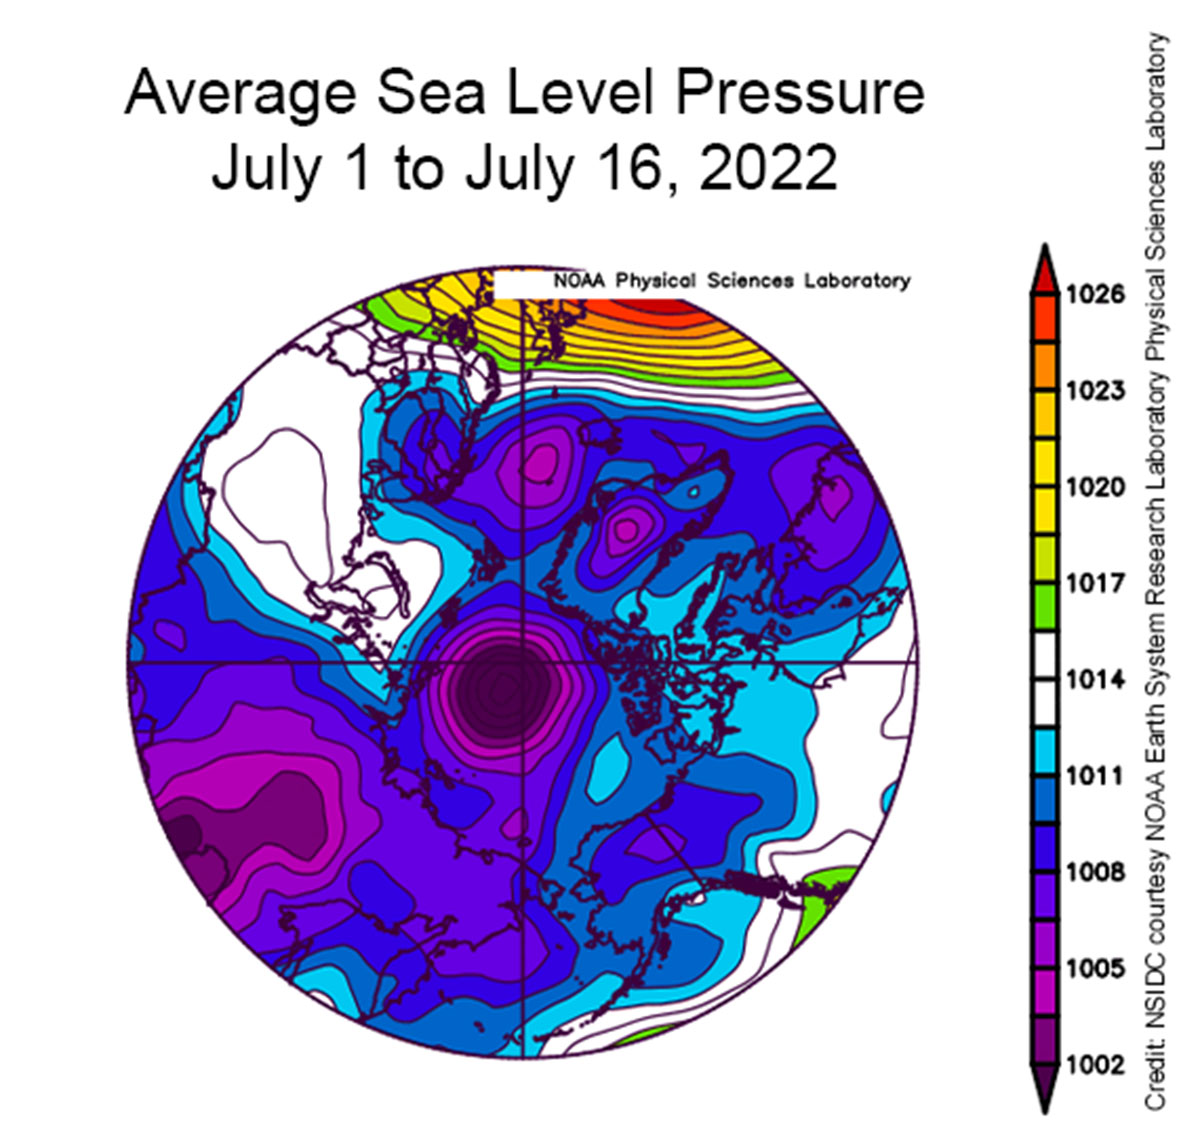
The synoptic pattern in June at the sea level was characterized by robust high pressure over the Beaufort Sea and a large low-pressure area near Iceland. This pattern is consistent with the warmth over Scandinavia and relatively colder conditions over the Baffin Bay.

A broad area of low pressure also controlled northwestern Eurasia. The strong high pressure over the Beaufort Sea, and generally high pressures over much of the Arctic Ocean, is consistent with a dominance of sunny weather.
Since June is the month with the highest sun elevation, clear skies allow more solar energy to reach the ice surface, leading to increased and intense surface melting. Particularly, a large area of the Beaufort Sea started to show the development of extensive melt ponds between June 20 and 26.

Melting Ponds over northwestern Greenland Ice Sheet on July 15th.
Photo Renato R. Colucci
In response to such a weather situation, the mean Arctic sea ice extent for June 2022 was 10.86 million square kilometers (4.19 million square miles), ranking tenth lowest in the satellite record. Total ice loss for June was 2.50 million square kilometers (965,000 square miles).
The 2022 June extent was 900,000 square kilometers (347,000 square miles) below the 1981 to 2010 average. The ice edge in the Barents Sea was far north of its usual location for this time of year and the area was nearly ice-free. The Hudson Bay also lost ice unusually early. Sea ice extent in the Chukchi, East Siberian, and Kara Seas was somewhat below the long-term average.

The opening of a large polynya in the Laptev Sea near the New Siberian Islands represented the most remarkable feature along the Russian coast. The Baffin Bay had a close-to-average sea ice extent, and at the beginning of June, the North Water Polynya opened.
In response to such a weather situation, the mean Arctic sea ice extent for June 2022 was 10.86 million square kilometers (4.19 million square miles), ranking tenth lowest in the satellite record. Total ice loss for June was 2.50 million square kilometers (965,000 square miles).
The 2022 June extent was 900,000 square kilometers (347,000 square miles) below the 1981 to 2010 average. The ice edge in the Barents Sea was far north of its usual location for this time of year and the area was nearly ice-free. The Hudson Bay also lost ice unusually early. Sea ice extent in the Chukchi, East Siberian, and Kara Seas was somewhat below the long-term average.
The opening of a large polynya in the Laptev Sea near the New Siberian Islands represented the most remarkable feature along the Russian coast. The Baffin Bay had a close-to-average sea ice extent, and at the beginning of June, the North Water Polynya opened.
WHAT IS A POLYNYA
Polynya is a geographical name describing an area of unfrozen seawater within the otherwise contiguous pack ice or fast ice. The word derives from the Russian language and refers to a natural ice hole. It was first adopted in the 19th century by polar explorers to describe navigable portions of the sea. We were talking extensively about Polynya also here

Polynyas occur within sea ice stretches even though the air temperature is below freezing. Such gaps in the thick ice pack provide direct interaction between the ocean and the atmosphere, which is important for wildlife. There are two main types of polynyas: coastal polynyas, and mid-sea or open-ocean polynyas.
Although coastal Polynyas are mainly created by strong winds pushing the ice away from the coast, they are subdivided into two different types: Sensible-heat polynyas, and Latent-heat polynyas.
In 2020 a Polynya formed in the last thick sea ice area (below) In the image below the evolution of the Polynya observed in May 2020
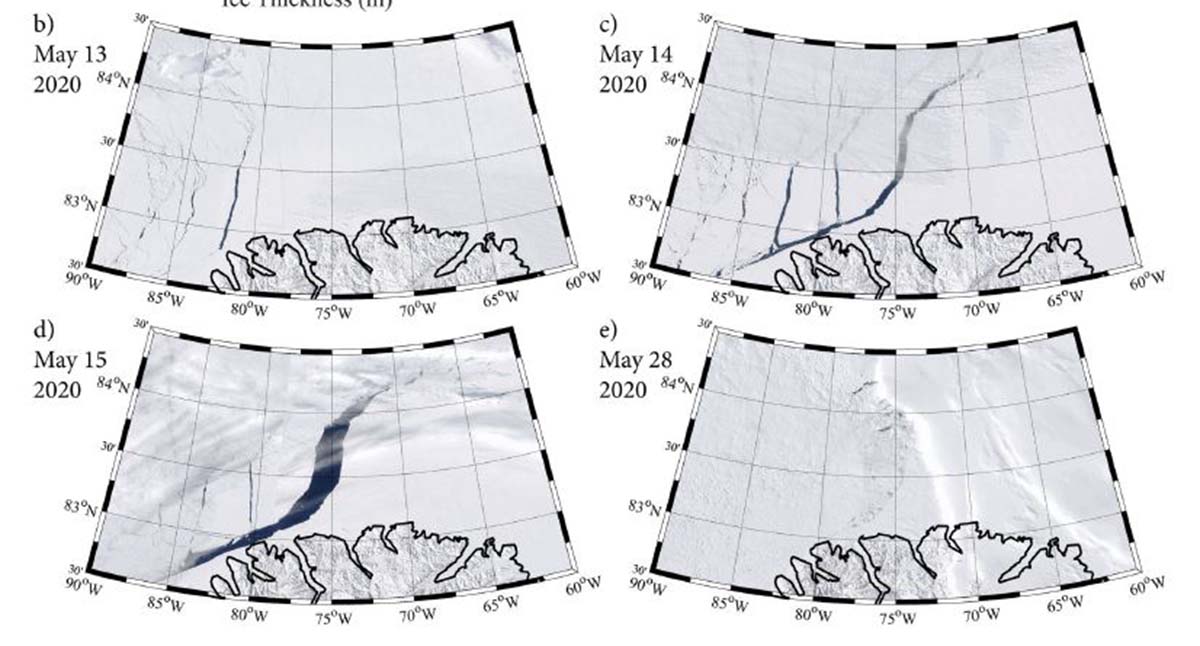
A sensible heat polynya is thermodynamically driven and usually occurs when warm water upwelling keeps the surface water temperature at or above the freezing point. This cuts ice production and may stop it altogether.
A latent heat polynya forms through the action of strong katabatic winds. Winds act driving ice away from a fixed edge such as a coastline, fast ice, or an ice bridge. The polynya forms primarily when first-year (young) sea ice is driven away from the coast. This leaves an area of open water within. The new ice is then piled up downwind toward the first-year pack ice.

WHAT IS HAPPENING IN ANTARCTICA
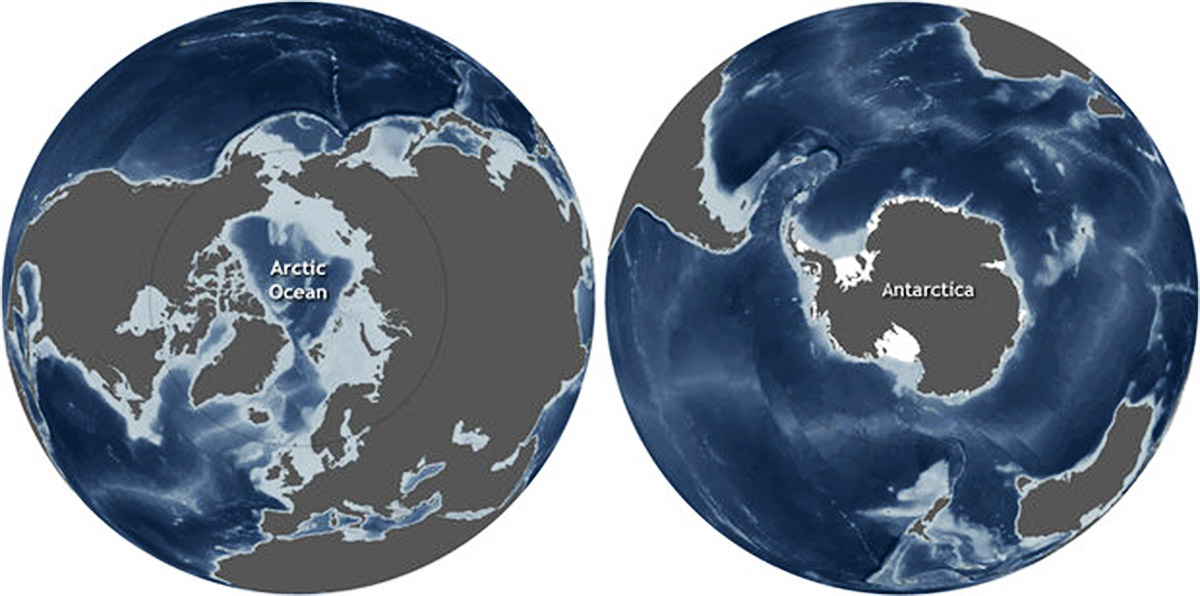
The Arctic and Antarctic are geographic opposites, and not just because they stand on opposite ends of the Earth’s globe. They also have opposite land-sea arrangements. In the Arctic, continents surround an ocean, while in Antarctica the continent is surrounded by oceans.
These differences in the arrangement of land and water contribute to differences in each polar region’s climate, oceanic and atmospheric circulation patterns, and sea ice.
Antarctic sea ice normally peaks in September or October and reaches a minimum in February. In some places, sea ice melts completely in the summer. In the NASA Earth Observatory maps below by Joshua Stevens, using AMSR2 data supplied by GCOM-W1/JAXA, sea ice extent in Antarctica in the season 2015-2016
The cold waters around Antarctica allow rapid sea ice formation in winter. At its maximum extent in September, sea ice cover is around 16 million square kilometers or 6.2 million square miles, shrinking to about 2 million square kilometers or 0.77 million square miles in February. This is a much larger fluctuation than in the Arctic, where the configuration of the continents encourages the retention of ice for longer periods.

Antarctic sea ice extent was 14.80 million square kilometers (5.71 million square miles) on July 17, 2022, roughly 240,000 square kilometers (92,700 square miles) below the previous record daily low set in 2017 and 1.14 million square kilometers (440,000 square miles) below 1981 to 2010 average extent for this day.
Nearly all regions of coastal Antarctica are below the average extent for mid-July, with the Amundsen and Bellingshausen Seas showing the largest gaps. Ice extent along the northern edge of the Weddell and Dronning Maud sectors, and the region near the Amery Ice Shelf, are also well below average. A few areas of the Ross Sea and Wilkes Land have near or slightly above average extent in the satellite record.
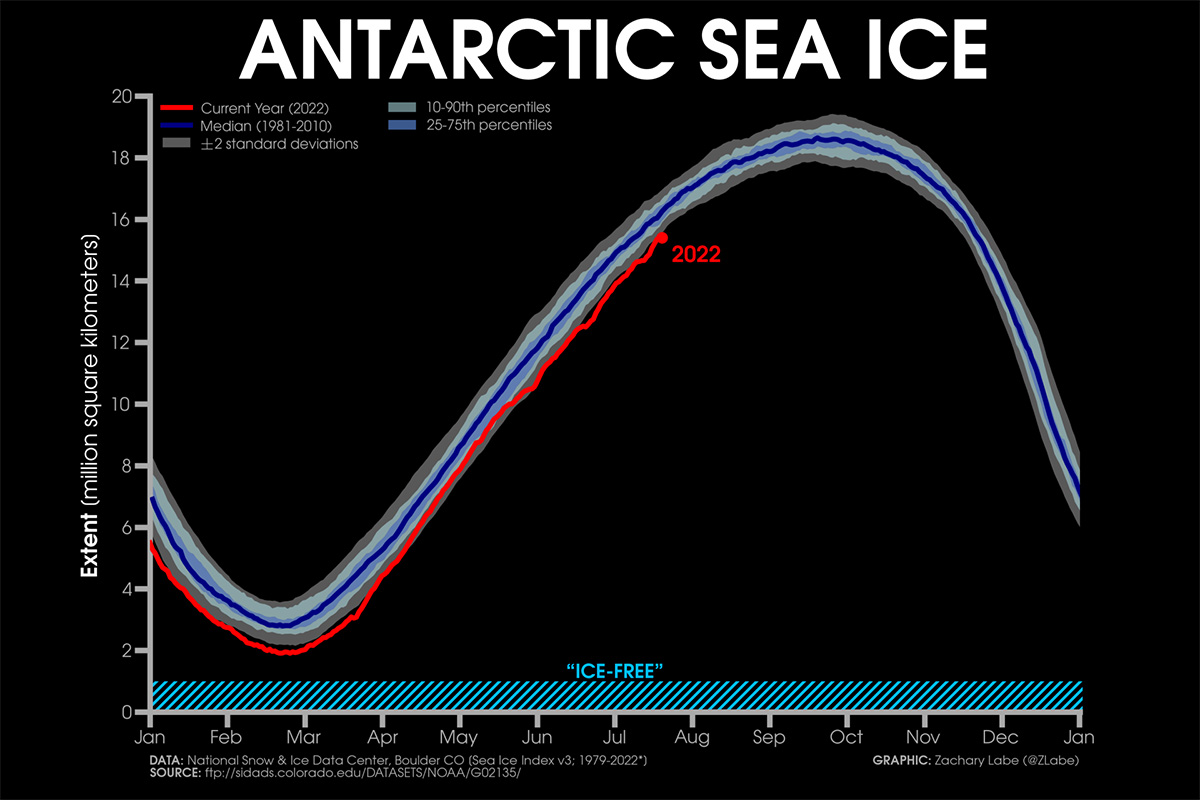
Antarctic sea ice evolution so far in 2022 edited by Zachary Labe
Temperatures at the 925 hectopascal level are three to six degrees Celsius (5 to 11 degrees Fahrenheit) above average for a large part of the Antarctic Peninsula and West Antarctic coast, and the Weddell Sea ice edge region is two to three degrees Celsius (4 to 5 degrees Fahrenheit) above average. The remaining coast is near- or slightly below average.

Both the Arctic and Antarctic Seas Ice extent push the global anomaly to –2,071 million square kilometers. In the image above the current sea ice extent anomalies for the Arctic and Antarctic, source NSIDC, DMSP SSM/I-SSMIS F-18 edited by Zachary Labe. Anomaly is based on 1981-2010 climatology.
We will keep you updated on this and much more, so make sure to bookmark our page. Also, if you have seen this article in the Google App (Discover) feed or on social media, click the like button (♥) to see more of our forecasts and our latest articles on weather and nature in general.
No comments:
Post a Comment