Precarious Jobs, Low Earnings, and Unpaid Work Haunt India’s Economy
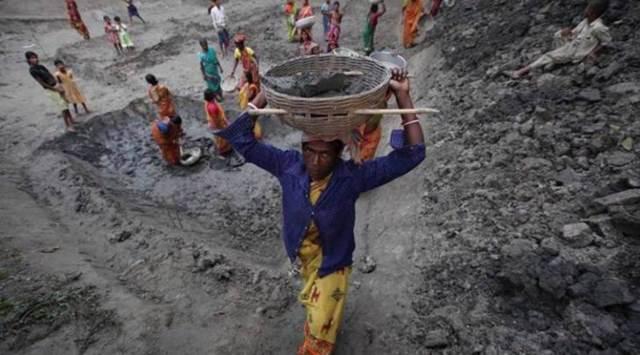
Credit: The Indian Express
A recently released government report on the jobs situation in India indicated that two key employment indicators - labour force participation rate and worker population ratio – have both shown improvement, while the unemployment rate has declined. The report, called the Periodic Labour Force Survey (PLFS) for 2022-23, is based on an annual survey of about 1 lakh households representing about 4.2 lakh persons.
The jobs crisis has been dogging the Indian economy for long and had taken a turn for the worse since the slowdown in 2019. It deepened during the pandemic due to large periods of economic lockdowns and since then has been stuttering along. So the new data received much celebratory comments from the government and its supporters. With important Assembly elections due in about a month’s time and the General Elections looming early next year, some easing of the dire jobs situation was imagined to be helpful to the ruling dispensation.
The details of the data in the PLFS report, however, reveal that this optimism is misplaced. The report is capturing a reality where unpaid labour, especially of women, has increased significantly, informal work has increased, agriculture is increasingly the mainstay of work and low-paying self-employment dominates the world of work.
Since 2020 to 2022 were years affected by the pandemic and employment opportunities were greatly disturbed, it is instructive to compare the current report (2022-23) with the PLFS report of 2018-19, the last report from a pre-pandemic year. This will also give a sense of how the jobs scenario has changed in the past five years. The labour force participation rate (LFPR), which is the share of the population working and also those seeking work, has increased from about 50% to 58% in this period. Worker population ratio (WPR), which is the share of actually working persons in the labour force has also increased from 35% to 41%. Notably, the current PLFS report says that female LFPR increased from about 25% to 37% while female WPR increased from 18% to 27%. This is a significant jump. Let us now look at the fine print.
Increased Self-Employment
In 2018-19, self-employed persons made up 52% of all employed, those earning a regular wage or salary were 24% and casual labour were 24%. By 2022-23, the share of self-employed had increased to 57% while the shares of both regular wage earners and casual labour had declined. (See chart below)
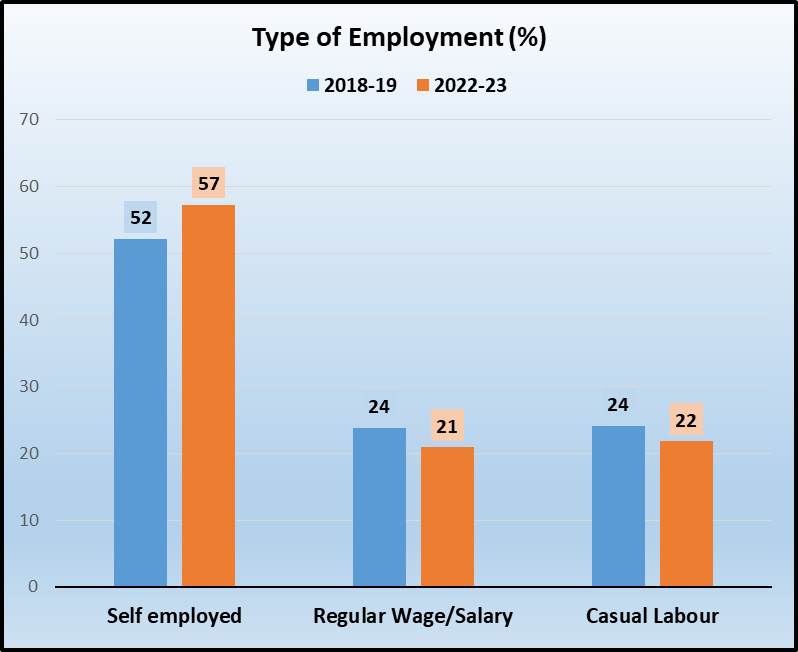
Self-employed persons are those who are working in a mind-boggling diversity of jobs from agriculture to petty shop keepers, rickshaw pullers, repair workers, and service providers of various kinds, with very low job security, practically no social security and meagre incomes. So this is the first sign that the increased employment is simply a reflection of desperate people doing any kind of work to survive.
More Unpaid Work for Women
A more worrying trend emerges from looking at the kind of work male and female workers are getting. The most striking thing is that the share of women in self-employment has jumped up notably, from 53% in 2018-19 to 65% in 2022-23. This was accompanied by the decline of women in regular wage employment from about 22% to 16% and from 25% to 19% in casual labour, over the same period.
The survey report gives a breakup of persons working in self-employment – those who are own account workers or employers and those who are “helpers in household enterprises”. This latter category are unpaid workers, helping in family’s collective labour. Among self-employed women, the share of own account workers and employers increased from 23% in 2018-19 to 28% in 2022-23 while the share of unpaid helpers increased from 31% to 38%, in the same period. (See chart below)
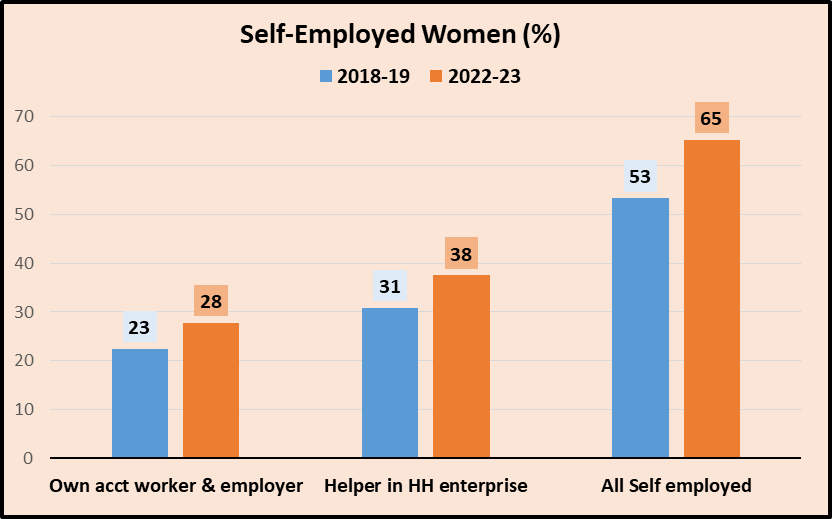
It is in this that the explanation for the much-lauded jump in participation of women in work lies. It looks likely that given the miserable earning levels, eroded as it is by inflation, and with the prevailing scarcity of jobs, women have been forced to do whatever extra bit of work to supplement the earnings of other members of the family. Piece by piece, families are collecting together the means for survival. Note that it is mainly women who are shouldering this “self-employed” work in the main. As far as men are concerned, the share of self-employed moved up from 52% to 54%. Within that, own account worker/owner inched up from 44% to 44.3% while unpaid helper share went from 7.6% to 9.3%, over the same period.
Farm Work Absorbs More, as does Non-Farm Informal Sector
More light is thrown on the nature of work that people are depending upon by looking at the sectors showing increased employment. Employment in agriculture has increased from 41% to 43% in the last five years. Another sector showing a slight increase is construction where employment has risen from 12% to 13%. Both these sectors are marked by low wages, seasonality of work availability, lack of social security and onerous working conditions. All the other major sectors – manufacturing, trade & hotels, transport and communication, and even “other services” which includes administrative and personal services, education, health etc. – have shown declines in employment. This speaks volumes about the state of the economy itself.
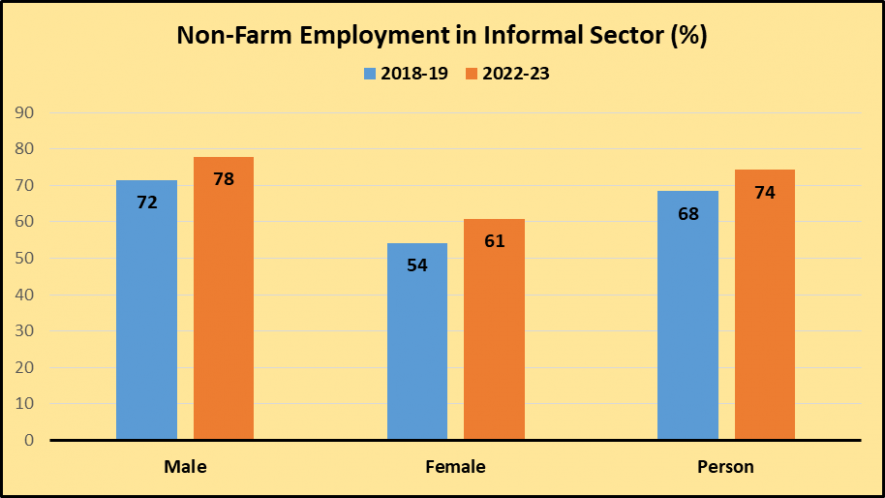
Of particular note is the fact that in the non-farm sector – once touted as the panacea to India’s employment blues – it is the informal sector that is drawing most employment seekers. As shown in the chart below, men’s share in this type of work increased from 72% to 78% while women’s share increased from 54% to 61%. Seen together with the rise in self-employment, this paints a picture of the predominance of precarious work in the country.
Low Earnings
The PLFS 2022-23 report has sobering information on the average earnings from different types of work. Data was collected in four rounds spread over a year (July 2022 to June 2023) to account for agricultural seasonality. Averaging out the data one can see the meagre earnings levels, as also differences between men and women, and rural and urban areas.
The average daily wage of a casual worker is just Rs. 403 which would translate to Rs. 12,075 per month if he or she gets work for all 30 days. Male casual workers earn Rs. 12,990 while female workers get only Rs. 8,385 per month. In the self-employed category, the average earning is Rs. 13,131 per month, with men getting an average of Rs.15,197 while self-employed women earn just Rs. 5,516. Regular wage or salary earners get Rs. 9,492 per month on average, with men earning Rs. 20,666 and women Rs. 15,722. These abysmal income levels are averages and there are many who earn much less. Clearly, the nature of jobs available – as described above – is not paying enough.
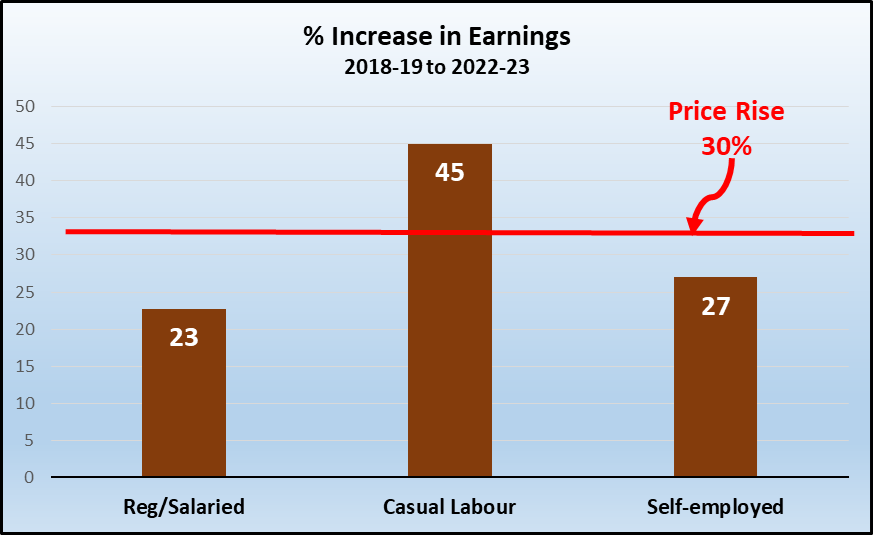
A comparison with income levels from five years ago (2018-19) reveals another dimension of economic distress. For both self-employed and regular wage/salary workers increase in wages/earnings is less than the price rise in the same period. (See chart below) Casual workers have seen a better increase in their wages, probably because their wage levels were so pathetically low to begin with. Price rise has been calculated using the combined Consumer Price Index data released by the Ministry of Statistics and Programme Implementation.
In sum, the jobs situation continues to be grim and daunting with earnings very insufficient to ensure a life of dignity, despite onerous conditions of work. People are surviving by undertaking whatever work they get, at whatever earnings they get in return. This harsh reality is something that policymakers need to address urgently and with wisdom.
No comments:
Post a Comment