It’s possible that I shall make an ass of myself. But in that case one can always get out of it with a little dialectic. I have, of course, so worded my proposition as to be right either way (K.Marx, Letter to F.Engels on the Indian Mutiny)
A 178-year-old mystery surrounding one of the earliest recorded examples of space weather affecting technology has been solved by an international research team
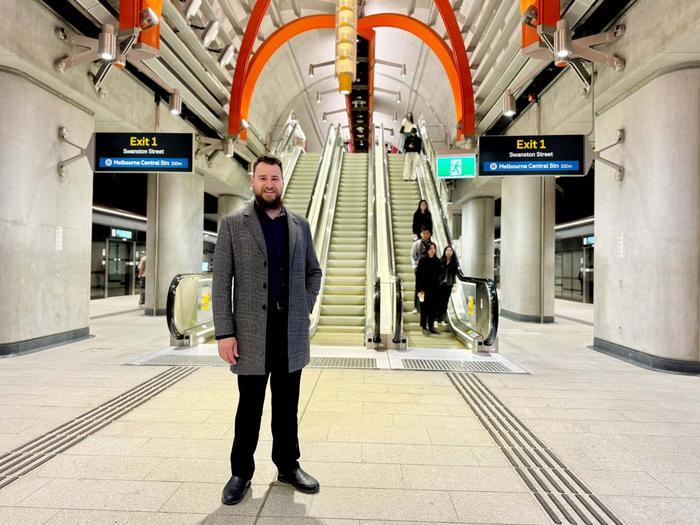
RMIT University space weather expert, Associate Professor Brett Carter, at Melbourne Central Station. Half a world and nearly two centuries away from the orgininal event he helped uncover the truth of by invesitgating the archives.
A 178-year-old mystery surrounding one of the earliest recorded examples of space weather affecting technology has been solved by an international research team.
As some of the first electric telegraph networks were built in the 1840s, telegraph operators began to experience unexplained electrical effects caused by disturbances in the earth’s magnetic field.
Now archival investigations led by Lancaster University with scientists from RMIT University, the British Geological Survey, Natural Resources Canada, Baylor University and the UK's national space laboratory, RAL Space, have re-examined accounts of a train delayed almost two centuries ago in Exeter, England, when the sun’s energy disrupted the railway’s telegraph system.
What they found sheds new light on the earliest examples of space weather disrupting electric technology.
A brief history of solar weather disturbance ‘firsts’
A massive solar flare and coronal mass ejection in 1859, known as the Carrington Event, is one of the most famous early space weather events to affect technology.
It caused aurora borealis ‘northern lights’ as far south as Hawaii and Central America so bright that people could read newspapers by their light and gold miners mistook the glow for morning and began cooking breakfast shortly after midnight.
Telegraph systems worldwide failed, sparking lines gave electrical shocks to operators and even caught fire, and some systems even operated without batteries using only the geomagnetic current induced in the wires.
Years later, in the 1870s, an anonymous author writing in Nature published a study about "very intense magnetic disturbance" on 18 October 1841, interfering with train signals and delaying the 10:05pm departure from Exeter by 16 minutes. The timing of this account places it as the earliest known example of space weather affecting human technology.
However, the timing of this event has now been debunked by the team’s study, just published in the American Geophysical Union journal Space Weather.
A ghost train and the truth uncovered
RMIT University space weather expert, Associate Professor Brett Carter, who investigated the archives to help the team uncover the truth, said they found one critical problem – the railway line referenced in the account did not open until 1846, almost five years after the alleged 1841 incident.
"In this study, we effectively investigated what had to be a typo in a Nature paper from 1871. We know it was a typo because the Exeter-to-Starcross train line mentioned in that paper didn't exist until 1846, which is 5 years afterwards,” he said.
To uncover what really happened, the team combined evidence from railway timetables, historical newspapers, solar observations, auroral reports and digitised geomagnetic records.
Their investigation shows that the incident most likely took place on 18 October 1848, rather than 18 October 1841.
Carter says understanding the details of this period matters because it marked a crossing over point of no return in the inter-relationship between electronic technology and space weather.
"Understanding this historical event is important because the 1840s mark the intersection between the rise of our technological age and space weather, which has always been around,” Carter says.
“Since this line was crossed, humans have not looked back.”
The findings show that while the Exeter incident remains one of the earliest documented examples of space weather disrupting technology, it was not the first. The earliest credible report currently known is interference with telegraph systems on the Midland Railway in March 1847.
Space weather as a long-standing natural hazard
Study lead author, Professor Jim Wild from Lancaster University, said the study challenged notions that space weather is a modern challenge.
“What this research highlights is that space weather is not a new threat but a long-standing natural hazard. Society has been experiencing the effects of space weather on technology for almost as long as electrical technologies have existed,” Wild said.
"The Exeter train delay is a fascinating story because it sits right at the point where emerging technologies first began to encounter the realities of the space environment. By combining historical archives with scientific observations, we've been able to show that the event almost certainly happened in 1848 rather than 1841.
"Although this means it is not the earliest recorded space weather impact, it remains one of the first clear examples of solar activity disrupting critical infrastructure,” he said.
“It also demonstrates the value of combining scientific records with contemporary newspaper reports and archival documents when reconstructing historic space weather events.”
Dr Mike Hapgood, Visiting Scientist and space weather expert at the UK's national space laboratory, RAL Space, said the study had felt like a detective story.
“It highlights the importance of preserving these older records, which give us the evidence base we need to interpret past events and strengthen future predictions,” he said.
Nearly two centuries later, railways and other critical infrastructure remain vulnerable to space weather, although through very different technologies including power systems, signalling equipment, satellite navigation and communications networks.
Hapgood said while today’s space weather capabilities are far more advanced than anything available in the 1800s, the modern technologies we depend on are also much more vulnerable to solar storms.
“Deepening our understanding of these events is essential for preparing for, and mitigating, the impacts of space weather – especially as we look forward to a decade of exciting space developments that will face the challenge of a new solar cycle in the 2030s,” he said.
A 178-year-old mystery surrounding one of the earliest recorded examples of space weather affecting technology has been solved by an international team led by Lancaster University.
The first practical electric telegraph networks were deployed during the 1840s, and as solar activity increased during the following years, Victorian telegraph operators began to experience unexplained electrical effects caused by geomagnetic disturbances.
Professor Jim Wild from Lancaster University with scientists from the British Geological Survey, Natural Resources Canada, Baylor University, RMIT University, and STFC RAL Space, re-examined a widely cited account of a train delay in Exeter that was reportedly caused by geomagnetic disturbance from the sun interfering with railway’s telegraph systems.
The event has previously been cited as potentially the earliest recorded example of space weather affecting human technology but the team’s research published in the American Geophysical Union journal Space Weather contradicts this assumption.
The original account described how the 10:05pm train departing Exeter in Devon was delayed by 16 minutes when a "very intense magnetic disturbance" interfered with electric signalling telegraph equipment used to determine whether the railway line ahead was clear.
However, the researchers found a critical problem - the railway line referenced in the account did not open until 1846, almost five years after the alleged 1841 incident. Their investigation shows that the incident most likely took place on 18 October 1848, rather than 18 October 1841 as stated in an influential article published in Nature in 1871.
To uncover what really happened, the team combined evidence from railway timetables, historical newspapers, solar observations, auroral reports and digitised geomagnetic records. Their investigation identified a strong geomagnetic disturbance on 18 October 1848, alongside reports of sunspots and aurora seen across the UK and Europe, providing compelling evidence that the date in the original account was a typographical error.
The findings show that while the Exeter incident remains one of the earliest documented examples of space weather disrupting technology, it was not the first. The earliest credible report currently known is interference with telegraph systems on the Midland Railway in March 1847.
Professor Jim Wild, from Lancaster University's School of Physics and Astronomy and lead author of the study, said: "Space weather is often discussed as a modern challenge because of our dependence on technologies such as satellites, communications systems and electricity networks. What this study shows is that society has been experiencing the effects of space weather on technology for almost as long as electrical technologies have existed.
"The Exeter train delay is a fascinating story because it sits right at the point where emerging technologies first began to encounter the realities of the space environment. By combining historical archives with scientific observations, we've been able to show that the event almost certainly happened in 1848 rather than 1841.
"Although this means it is not the earliest recorded space weather impact, it remains one of the first clear examples of solar activity disrupting critical infrastructure. It also demonstrates the value of combining scientific records with contemporary newspaper reports and archival documents when reconstructing historic space weather events.”
Dr Mike Hapgood, Visiting Scientist and Space Weather Expert at STFC’s RAL Space, said: “Our research has a hint of a detective story – piecing together a wide range of archived records to better understand a historically severe space weather event. It highlights the importance of preserving these older records, which give us the evidence base we need to interpret past events and strengthen future predictions.”
Nearly two centuries later, railways and other critical infrastructure remain vulnerable to space weather, although through very different technologies including power systems, signalling equipment, satellite navigation and communications networks.
Professor Wild said: “What this research highlights is that space weather is not a new threat but a long-standing natural hazard. The technologies affected have evolved from railway telegraphs to satellites, communications networks and power systems, but the challenge remains the same: understanding the risk and ensuring society is resilient to its impacts."
Dr Hapgood said: “While today’s space weather capabilities are far more advanced than anything available in the 1800s, the modern technologies we depend on are also much more vulnerable to solar storms. Deepening our understanding of these events is essential for preparing for, and mitigating, the impacts of space weather – especially as we look forward to a decade of exciting space developments that will face the challenge of a new solar cycle in the 2030s.”
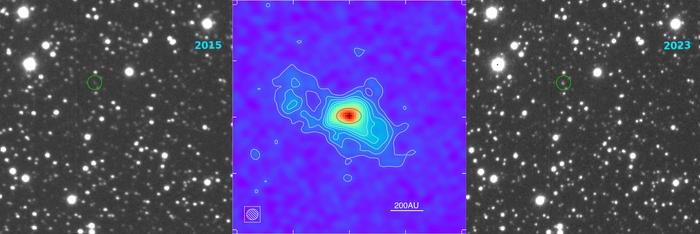
The rapid brightening of Sakurai's object (green circle) allows astronomers to study the final phases of the stellar evolution in only a few decades. The left and right panels show the brightening. The middle panel is an image obtained with the radio telescope ALMA, showing the material ejected after the star re-ignited. The material currently extends over a size similar to our entire solar system. Credit: Stefan Kimeswenger, University of Innsbruck; Peter van Hoof, Royal Observatory Belgium
Credit: Credit: Stefan Kimeswenger, University of Innsbruck; Peter van Hoof, Royal Observatory Belgium
Astronomers have confirmed that one of the fastest-changing stars ever observed has entered a new stage of its evolution, offering a rare opportunity to watch a star's life unfold on human timescales.
Using the European Southern Observatory's Very Large Telescope (VLT) in Chile, researchers, involving scientists from The University of Manchester and The Valongo Observatory, studied Sakurai's Object, a rare ‘born-again’ star that unexpectedly burst back to life in 1996 after reaching the final stages of its evolution.
Their findings, published today in Monthly Notices of the Royal Astronomical Society, show that the star has entered a new phase of its evolution, developing the powerful stellar wind characteristic of Wolf-Rayet stars.
The research provides new insight into the final stages of stellar evolution and helps astronomers test theories that would otherwise take thousands or millions of years to verify.
Professor Albert Zijlstra from Jodrell Bank Centre for Astrophysics at The University of Manchester, said: "Most stars evolve so slowly that major changes take place over timescales far longer than a human lifetime. As a result, we usually have to piece together snapshots of stellar evolution by comparing different stars at different stages of their lives.
"Sakurai's Object offers something far rarer. It is one of the very few stars known to have changed dramatically within just a few decades, giving us the opportunity to watch stellar evolution unfold in real time.
“With our observations, we can test theories of how stars evolve and gain new insights into one of the shortest and least understood phases in the life of a dying star."
The scientists believe the star was similar to our Sun, but had already ended nuclear burning and begun its journey towards becoming a white dwarf - the hot, dense core left behind after an ordinary star dies. It underwent a rare event known as a "very late thermal pulse", when a layer of helium deep inside the dead star suddenly reignites.
The event caused the star to rapidly expand, cool and eject large amounts of material into space, temporarily returning to an earlier stage of its life, leading astronomers to describe it as a "born-again" star.
Only two stars have ever been directly observed undergoing this type of dramatic rebirth: Sakurai's Object and V605 Aquilae.
Following its outburst, Sakurai's Object became hidden behind thick clouds of gas and dust released during the eruption, making it difficult to study directly.
To investigate its current state, the team analysed light collected by the Very Large Telescope and compared it with sophisticated computer models that simulate the atmospheres and powerful winds of Wolf-Rayet stars.
The observations revealed distinctive signatures of carbon and helium, allowing the researchers to find its temperature, chemical composition and the characteristics of its stellar wind.
Their analysis suggests the star's surface temperature is currently between around 27,000 and 36,000 degrees Kelvin, showing that it is reheating following its dramatic eruption nearly three decades ago.
Prof Zijlstra added: "One of the key questions is how quickly Sakurai's Object should recover after its dramatic eruption.
"Our measurements show that the star is reheating more gradually than some earlier models predicted. That gives us an important way of testing which theories best describe what happens when a dying star briefly springs back to life.
"As we continue to monitor the star over the coming years, we expect to learn much more about this remarkable phase of stellar evolution."
The findings also suggest that Sakurai's Object is at an earlier stage of its evolution than V605 Aquilae, which experienced a similar event around 80 years ago.
The team will continue observing Sakurai's Object as it continues reheating and resumes its journey towards becoming a white dwarf, learning more about one of the most rapid and unusual phases of stellar evolution ever observed.
The findings have been published in Monthly Notices of the Royal Astronomical Society
The nebula that was ejected when the star died for the first time. This is an ancient planetary nebula. In this image, the star itself is not visible as it was before the brightening started. Credit: ESO
A static image of the final frame of the animation. Credit: Peter van Hoof.
With the increasingly urgent demand for non-toxic, high-specific-impulse propellants in space propulsion systems, ammonium dinitramide (ADN)-based liquid propellants have attracted extensive attention as a new-generation green alternative to hydrazine-based fuels. However, existing ADN-based thrusters all adopt the catalytic ignition technology route, which suffers from inherent drawbacks: the catalyst cannot withstand temperatures exceeding 1500 K, long preheating times are required prior to startup (in the Prisma mission, in-flight preheating lasted 600–720 s with a single-event energy consumption of 25 kJ), and insufficient preheating may lead to "hard start" or even explosion—these issues severely constrain the rapid response capability and operational safety of the thrusters. Although active ignition methods such as resistive ignition and laser ignition have been validated at the single-droplet level, how to achieve catalyst-free electric ignition at the thruster system level and systematically evaluate its combustion characteristics remains a critical engineering problem urgently to be addressed in the field of green space propulsion.
In a recent study published in Space: Science & Technology, a research team from Beijing Jiaotong University proposed an ADN-based thruster employing a combined scheme of resistive ignition and arc-assisted combustion, verifying for the first time the feasibility of electric ignition technology at the thruster system level. The study innovatively designed a multi-layer honeycomb decomposition electrode structure to enlarge the contact area between the propellant and the electrodes, and conducted systematic hot-fire tests under the conditions of 5 N thrust and a propellant mass flow rate of 2.5 g/s. The effects of ignition voltage, arc loading time, electrode gap, and electrode orifice diameter on thruster performance were investigated. The results show that under the operating conditions of 80 V ignition voltage, 3 mm electrode gap, and 0.8 mm electrode orifice diameter, the thruster achieved cold-start ignition and stable combustion at room temperature, with an average combustion chamber pressure of 0.93 MPa, an ignition delay time of 0.64 s, a pressure establishment time of 1.02 s, a characteristic velocity of 1168.7 m/s, and an average power of approximately 263 W in the decomposition zone circuit. Increasing the ignition voltage can shorten the ignition delay time (from 0.93 s to 0.47 s when increased from 60 V to 100 V), with 80 V identified as the optimal voltage overall. Although the arc has no significant effect on ignition response, it can effectively suppress low-frequency pressure oscillations. Reducing the electrode gap or optimizing the electrode orifice diameter to 0.8 mm can significantly improve ignition response characteristics. The study also reveals that the pressure oscillation frequency (<10 Hz) closely matches the current oscillation frequency, demonstrating that unstable propellant decomposition is the root cause of combustion instability. This research provides critical experimental evidence for the engineering design of catalyst-free ADN-based thrusters and offers important technical reference value for advancing the development of green high-performance space propulsion systems.
First, this paper focuses on the urgent demand for green space propulsion technologies and the inherent deficiencies of existing catalytic ignition approaches, and innovatively proposes an electrically ignited ADN-based thruster based on a combined scheme of resistive ignition and arc-assisted combustion. With the deepening concept of space sustainability, ADN-based liquid propellants, owing to their non-toxicity, high specific impulse, and favorable stability, have become the most promising green propellant alternative to hydrazine-based fuels. However, all ADN-based thrusters currently employed in engineering applications adopt the catalytic ignition technology route, which relies on highly active catalysts to achieve propellant decomposition and combustion, yet suffers from severe drawbacks: the catalyst cannot withstand temperatures exceeding 1500 K, the catalytic bed must be preheated to above 623 K prior to thruster startup, and insufficient preheating may lead to a "hard start" or even explosion. To overcome the technical bottleneck of catalytic ignition, this study for the first time designs an electric ignition experimental system as shown in Fig. 1, which mainly comprises the thruster, propellant supply system, ignition system, data acquisition system, and control system. The thruster adopts the structural design illustrated in Fig. 2, primarily consisting of a swirl injector, decomposition zone, combustion chamber, honeycomb multi-layer decomposition electrodes, arc electrodes, and a Laval nozzle, wherein the honeycomb electrode structure can enlarge the contact area between the propellant and the electrodes while suppressing secondary droplet splashing caused by micro-explosions. This electric ignition scheme requires neither catalyst nor preheating, and is expected to enable rapid cold-start of the thruster while avoiding the risk of hard start.
Second, the paper validates the feasibility of the electrically ignited thruster through systematic hot-fire tests, and investigates the effects of ignition voltage, arc loading time, electrode gap, and electrode orifice diameter on the ignition response and combustion characteristics of the thruster. Fig. 3 illustrates the thermal decomposition and combustion reaction pathways of the propellant during the hot-fire process. Under resistive heating, the propellant undergoes methanol dehydrogenation, water evaporation, and thermal decomposition of ammonium dinitramide, generating strongly oxidizing intermediates that subsequently undergo violent oxidation reactions with methanol and its dehydrogenation products in the combustion chamber, releasing substantial heat. Fig. 4 presents photographs of the thruster at four stages: pre-ignition, arc loading, ignition operation, and the end of the hot-fire test. It can be observed that during arc loading, the combustion chamber window exhibits a bright orange glow, and the light intensity further increases during the ignition operation stage, indicating that the propellant decomposition products are successfully ignited by the arc and achieve stable combustion. Under the operating conditions of 80 V ignition voltage, 3 mm electrode gap, and 0.8 mm electrode orifice diameter, the thruster achieves cold-start ignition at room temperature. The results of the 30-second hot-fire test, as shown in Fig. 5, demonstrate that the combustion chamber pressure is rapidly established after ignition, with an average pressure of 0.93 MPa, an ignition delay time of 0.64 s, a pressure establishment time of 1.02 s, and a characteristic velocity of 1168.7 m/s, which exceeds the design value of hydrogen peroxide thrusters of comparable thrust level. The voltage and current curves shown in Fig. 6 reveal that the average current in the decomposition zone circuit is 3.3 A, with an average power of approximately 263 W, and the resistance gradually increases and stabilizes as the propellant decomposition proceeds. The experiments also reveal periodic oscillations in the combustion chamber pressure, indicating the existence of combustion instability in the thruster.
Finally, the paper systematically analyzes the intrinsic correlations among ignition voltage, arc loading, electrode structure, and combustion instability, providing critical guidance for the optimal design of the thruster. The combustion chamber pressure curves and corresponding key performance parameters under different ignition voltages, arc loading times, electrode gaps, and electrode orifice diameters are respectively examined. The results indicate that increasing the ignition voltage can shorten the ignition delay time, with 80 V identified as the optimal voltage overall; although the arc is not a necessary condition for propellant ignition and combustion, it can significantly suppress pressure oscillations and improve combustion stability, while exerting no significant effect on ignition response characteristics; reducing the electrode gap can shorten both the ignition delay time and the pressure establishment time; when the electrode orifice diameter is increased from 0.3 mm to 0.8 mm, the average chamber pressure rises from 0.70 to 0.94 MPa and the ignition delay time decreases from 1.70 to 0.59 s, but further increasing it to 1.2 mm leads to performance degradation, as the excessively short residence time inhibits the decomposition reactions. As shown in Figs. 7 and 8, fast Fourier transform analysis reveals that the pressure oscillation frequencies are predominantly concentrated below 10 Hz, characteristic of low-frequency combustion instability, and the current oscillation frequency closely matches the pressure oscillation frequency with an opposite phase, confirming that unstable propellant decomposition is the root cause of combustion instability. Spray atomization characteristics analysis shows that the dominant frequency of droplet size fluctuations is above 50 Hz, indicating no direct coupling with pressure oscillations and only an indirect effect on the decomposition process. This electrically ignited thruster successfully overcomes the bottlenecks of catalyst activity degradation and explosion risk due to insufficient preheating inherent in catalytic ignition, offering advantages of extended lifespan and rapid startup. However, the energy consumption of approximately 263 W imposes higher demands on the spacecraft power system. This study provides critical experimental evidence and optimization directions for the engineering design of ADN-based thrusters.
Preliminary Hot-Fire Test of Ammonium Dinitramide-Based Thrusters Based on Electrical Ignition
Fig. 2. (A) The demonstration of the ammonium dinitramide (ADN)-based thruster and (B) schematic diagram of the ADN-based thruster.
Fig. 3. (A) The hot-fire test diagram of the thruster and (B) the thermal decomposition and combustion processes of the ammonium dinitramide (ADN)-based propellant within the thruster.
Fig. 4. The images of the (A) preignition state, (B) arc loading, (C) ignition running, and (D) hot-fire ending of the thruster.
IncResUnet: A model for automatic ionospheric plasma bubble detection
Plasma bubbles in the ionosphere over equatorial and low-latitude regions are a common nighttime plasma density depletion structure that can cause severe scintillation interference on high-frequency communications, making them an important target of space weather monitoring. Traditional detection methods rely on statistical thresholds derived from temporal fluctuations in ion density; however, plasma bubbles exhibit significant variability in spatiotemporal scales (ranging from kilometers to hundreds of kilometers), and their occurrence frequency is strongly modulated by solar activity and seasonal factors. Consequently, fixed-threshold methods struggle to accommodate this diversity, with miss rates reaching up to 40% during periods of low solar activity. Although deep learning has demonstrated powerful capabilities in automatically extracting and recognizing complex waveform features in fields such as medical image segmentation and signal peak detection, its systematic application to ionospheric plasma bubble detection—and thus addressing the adaptability deficiencies of traditional threshold methods—remains underexplored.
In a recent study published in Space: Science & Technology, a research team from Huazhong Agricultural University proposed an automatic plasma bubble detection model based on deep learning, termed IncResUnet. Using ion density data from the FORMOSAT-1 satellite spanning 1999 to 2004, combined with expert annotations, the study established a dataset containing 13,675 plasma bubble events and defined a new identification criterion: density deviation from background trends exceeding twice the standard deviation, amplitude ≥ 0.2, duration ≥ 5 seconds, and transverse scale ≤ 500 km. Built upon the U-Net architecture, the model incorporates Inception-residual modules, which employ parallel multi-scale convolution kernels to capture density variation features across different temporal spans, while residual connections alleviate the gradient vanishing problem. Experimental results demonstrate that IncResUnet achieves an F1-score of 0.914, recall of 0.958, and precision of 0.874 on the FORMOSAT-1 test set, significantly outperforming the traditional threshold method as well as various U-Net variants such as U-Net++ and Attention U-Net. When the model trained on FORMOSAT-1 data was directly applied to C/NOFS satellite data, it achieved an F1-score of 0.804, which was further improved to 0.859 after a small amount of incremental training, with a recall rate as high as 98.8%. Applied to COSMIC-2 data, the model successfully detected all 36 events. This study represents the first systematic application of deep learning methods to automatic plasma bubble detection, validating the feasibility of learning density depletion waveform features from time-series data, and provides an efficient automated detection tool for space weather monitoring and ionospheric physics research.
First, this paper focuses on the engineering requirements for ionospheric plasma bubble detection and the limitations of traditional methods. Plasma bubbles are a common nighttime plasma density depletion structure over equatorial and low-latitude regions, capable of causing severe scintillation interference on high-frequency communications, and thus represent an important target of space weather monitoring. The ion trap sensor aboard the FORMOSAT-1 satellite provides high-resolution ion density data. Traditional detection methods apply linear detrending to 10-second data segments and compute density fluctuation values, identifying a plasma bubble event when the fluctuation exceeds a fixed threshold. However, plasma bubbles exhibit significant variability in spatiotemporal scales, ranging from kilometers to hundreds of kilometers, and their occurrence frequency is strongly modulated by solar activity, season, and local time. The fixed-threshold approach suffers from a miss rate of up to 40% during periods of low solar activity. As illustrated in Fig. 1, plasma bubbles manifest as sudden density drop features in ion density time series, which bear similarities to signal peak detection problems, thereby providing a rationale for introducing deep learning methods.
Second, the paper presents a complete technical pipeline for automatic plasma bubble detection. Fig. 2 illustrates the full workflow, ranging from data annotation to model output and post-processing. The research team first established a dataset containing 13,675 plasma bubble events, based on ion density data from the FORMOSAT-1 satellite spanning 1999 to 2004, in conjunction with detection results from traditional methods and expert manual annotations. As shown in Fig. 3, the proposed IncResUnet model incorporates Inception-residual modules into the U-Net architecture. The encoder comprises five groups of convolutional modules and Inception-residual modules, progressively extracting multi-scale features through four max-pooling operations; the decoder restores the original resolution through four upsampling operations. The Inception-residual modules employ parallel one-dimensional convolution kernels of multiple sizes to capture density variation features across different temporal spans, and residual connections concatenate the processed features with the original input, effectively alleviating the vanishing gradient problem. Training adopts a time-split strategy, with data from 2001 to 2003 used for training, 1999 for validation, and 2000 and 2004 for testing, while random undersampling is applied to balance the positive and negative sample ratios. After model output, a dual-threshold refinement strategy is applied, in which events with duration shorter than 5 seconds are filtered out as noise, and adjacent events separated by less than 1 minute are automatically merged into complete large-scale plasma bubble structures.
Finally, the paper comprehensively validates the effectiveness of the IncResUnet model through a series of experiments. Table 1 compares the detection performance of the traditional method, ResNet-18, LSTM, U-Net, and various U-Net variants. On the 2000 test set, IncResUnet achieves an F1-score of 0.914, a recall of 0.958, and a precision of 0.874; on the 2004 test set, it attains an F1-score of 0.914, a recall of 0.924, and a precision of 0.905, outperforming all comparison models in terms of recall. Fig. 4 presents four typical detection examples, where blue and orange denote the detection results of the proposed method and the baseline method, respectively. It can be observed that the traditional method suffers from missed detections and false alarms, whereas IncResUnet accurately identifies the onset and offset boundaries of plasma bubbles. In the robustness experiments summarized in Table 2, IncResUnet achieves the highest F1-scores (92.5% and 89.0%) across different data partitions. In the cross-satellite generalization validation, Table 3 shows that the model trained on FORMOSAT-1 data, when directly applied to C/NOFS data, yields an F1-score of 0.804, which can be improved to 0.859 after incremental training, with a recall rate as high as 98.8%; when applied to COSMIC-2 data, all 36 events are successfully detected, achieving a recall of 100%. The study further reveals that the generalization performance discrepancy across different satellite datasets primarily stems from the degree of data distribution shift. This work represents the first systematic application of deep learning methods to ionospheric plasma bubble detection, demonstrating the feasibility of learning density depletion waveform features from time-series data, and provides an efficient automated detection tool for ionospheric physics research and space weather monitoring.
IncResUnet: A Model for Automatic Ionospheric Plasma Bubble Detection
Fig. 3. The architecture of the proposed IncResUnet. (The blue block and light green block represent the 1D convolution module and the Inception-residual block, respectively. In the Inception-residual block, the input features undergo convolution operations of 4 different sizes, followed by batch normalization and LeakyReLU activation function processing. Finally, the processed features are concatenated with the original input.)
Table 1. Comparison of detection results with different models. The bold content in the table indicates the highest quality values.
Table 2. Experiments oln robustness performance. The bold content in the table indicates the highest quality values.
Table 3. Experiments on generalization performance. The bold content in the table indicates the highest quality values.