Researchers calculate decades of 'scary' Greenland ice melting
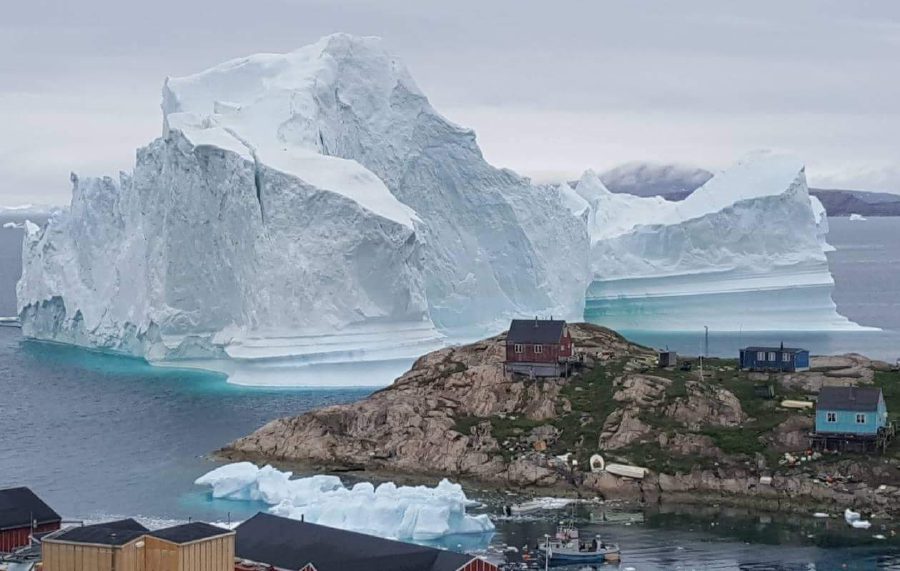
(File pix) Researchers have recalculated the amount of ice lost in Greenland since 1972, the year the first Landsat satellites entered orbit to regularly photograph the Danish territory. AFP/Getty Photo
By AFP - April 23, 2019 @ 2:00pm
WASHINGTON: Measuring melting ice is a fairly precise business in 2019 – thanks to satellites, weather stations and sophisticated climate models.
By the 1990s and 2000s, scientists were able to make pretty good estimates, although work from previous decades was unreliable due to less advanced technology.
Now, researchers have recalculated the amount of ice lost in Greenland since 1972, the year the first Landsat satellites entered orbit to regularly photograph the Danish territory.
“When you look at several decades, it is best to sit back in your chair before looking at the results, because it is a bit scary to see how fast it is changing,” said French glaciologist Eric Rignot, of the University of California at Irvine.
Rignot co-authored the study, published in the Proceedings of the National Academy of Sciences of the United States of America (PNAS),with colleagues in California, Grenoble, Utrecht and Copenhagen.
“It’s also something that affects the four corners of Greenland, not just the warmer parts in the south,” he said.
Glaciologists use three methods to measure ice melting.
Firstly, satellites measure altitude with a laser: if a glacier melts, the satellite picks up its reduced height.
A second technique involves measuring variations in gravity, as ice loss can be detected through a decrease in gravitational pull. This method has been available since 2002 using NASA satellites.
Thirdly, scientists have developed so-called mass balance models, which compare mass accumulated (rain and snow) with mass lost (ice river discharges) to calculate what is left.
These models, confirmed with field measurements, have become very reliable since the 2000s, according to Rignot – boasting a five to seven percent margin of error, compared to 100 percent a few decades ago.
The research team used these models to “go back in time” and reconstruct Greenland’s ice levels in the 1970s and 1980s.
The limited data available for this period – medium-quality satellite photos, aerial photos, ice cores and other observations – helped refine them.
“We added a little bit of history that did not exist,” said Rignot.
The results: during the 1970s, Greenland accumulated 47 gigatonnes of ice per year, on average. Then, it lost an equivalent volume in the 1980s.
The melting continued at that rate in the 1990s, before a sharp acceleration in the 2000s (187 Gt/year) and even more since 2010 (286 Gt/year).
Ice is melting six times faster than in the 1980s, researchers estimate – and Greenland’s glaciers alone have contributed to a 13.7 millimeter rise in sea levels since 1972, they believe.
“This is an excellent piece of work by a well-established research group using novel methods to extract more information from the available data“, said Colin Summerhayes, of the Scott Polar Research Institute in Cambridge.
As with a similar study carried out by the same team on Antarctica, the new study affords a longer term view of the rapid ice melt being observed in Greenland in recent years.
“This new data better enables us to put recent, dramatic, changes to Greenland’s contribution to global sea level rise into a longer-term context – the ice loss we’ve seen in the last eight years is as much as was lost in the preceding four decades,” said Amber Leeson, a lecturer in Environmental Data Science at Lancaster University. -- AFP
SCIENCE
Greenland Is Falling Apart
Since 1972, the giant island’s ice sheet has lost 11 quadrillion pounds of water.
APR 23, 2019
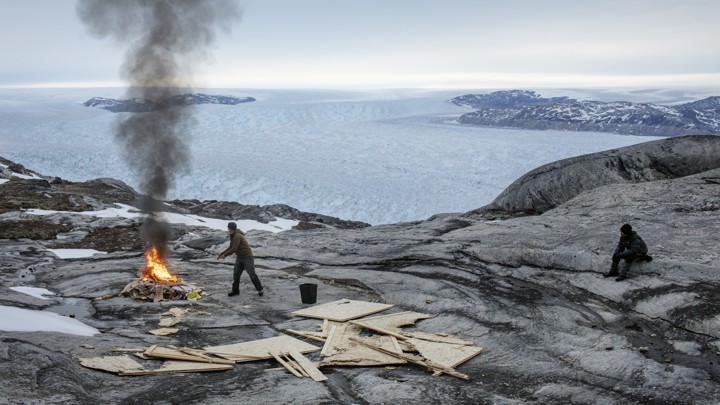
NASA researchers burn leftover wood on the Helheim Glacier,
which is one of the fastest-moving ice floes in Greenland.
LUCAS JACKSON / REUTERS
The Greenland Ice Sheet is the world’s second-largest reservoir of fresh water sitting on the world’s largest island. It is almost mind-bogglingly huge.
If Greenland were suddenly transported to the central United States, it would be a very bad day for about 65 million people, who would be crushed instantly. But for the sake of science journalism, imagine that Greenland’s southernmost tip displaced Brownsville, Texas—the state’s southernmost city—so that its icy glaciers kissed mainland Mexico and the Gulf thereof. Even then, Greenland would stretch all the way north, clear across the United States, its northern tenth crossing the Canadian border into Ontario and Manitoba. Kansas City, Oklahoma City, and Iowa City would all be goners. So too would San Antonio, Memphis, and Minneapolis. Its easternmost peaks would slam St. Louis and play in Peoria; its northwestern glaciers would rout Rapid City, South Dakota, and meander into Montana. At its center point, near Des Moines, roughly two miles of ice would rise from the surface.
Suffice it to say: The Greenland Ice Sheet, which contains enough water to refill the Great Lakes 115 times over, is very large. And it is also falling apart.
A new study finds that the Greenland Ice Sheet added a quarter inch of water to global sea levels in just the past eight years. The research, published Monday in the journal Proceedings of the National Academy of Sciences, covers nearly 20 years previously not included in our detailed understanding of the troubled Greenland Ice Sheet. It finds that climate change has already bled trillions of tons of ice from the island reservoir, with more loss than expected coming from its unstable northern half.
“The glaciers are still being pushed out of balance,” Eric Rignot, a senior scientist at NASA and an author of the paper, told me. “Even though the ice sheet has [sometimes] been extremely cold and had low surface melt in the last year, the glaciers are still speeding up, and the ice sheet is still losing mass.”
The paper casts the transformation of the Greenland Ice Sheet as one of the profound geological shifts of our time. Scientists measure the mass of ice sheets in “gigatons”—each unit equal to 1 billion metric tons, or roughly the same amount of water that New York or Los Angeles uses in a year. Greenland, according to the study, has lost 4,976 gigatons of water since 1972. That’s enough water to fill 16 trillion bathtubs or 1.3 quadrillion gallon jugs. That much water weighs about 11 quadrillion pounds. (A quadrillion is 1 with 15 zeros after it.)
More worryingly, the paper finds that Greenland lost about half of that ice—roughly 2,200 gigatons—in the years between 2010 and 2018. The ice sheet has also failed to gain mass in any year since 1998.
This melting isn’t happening at a steady pace, in other words. Greenland’s demise seems to be accelerating. Think of Greenland as a huge inland ice sea, surrounded by faster-moving ice rivers (which are glaciers) that empty the sea and carry ice to the ocean. The paper finds that those rivers are speeding up, carrying ice out of the island’s core nearly twice as fast now as they did in the 1990s or 2000s.
Read: Ancient Rome’s collapse is written into Arctic ice
That’s an alarming result, because it means glaciers might now be shrinking Greenland from the bottom faster than hot weather can melt it from the top. And researchers believe that bottom-melting glaciers are less stable and more prone to rapid collapse. “If there’s a risk of rapid sea-level rise in the future, it will be associated with glaciers speeding up, and not anything happening at the surface,” Rignot said.
The paper’s findings are stirring in part because they go much further back in time. “A lot of the publications [about Greenland’s mass] start in 2000 or 2002, some go back to 1992, but this is the first time we go back another 20 years,” Rignot said. Historically, most studies of Greenland combine data from radar flybys, GPS beacons, and laser or gravity-sensing satellites. But there’s not enough data from before 1992 to be useful, so that’s when estimates usually stop.
Rignot and his colleagues helped hit upon a new resource. The U.S. Geological Survey’s Landsat satellites have circled the planet nonstop since 1972, imaging every speck of land on Earth every 16 days. This archive—which is a kind of Earth-science version of taking a photo of yourself every day for years—includes hundreds of images of Greenland. Rignot and his team taught a computer how to read those pictures of its icy surface, zooming in especially on the dozens of glaciers that connect the interior ice sheet to the sea.
“It’s looking at two different pictures of a glacier, before and after. [In each frame,] the rocks don’t move but the glacier moves, so it can compare and cross-correlate image points,” Rignot said. “Then the algorithm searches around the window for where the pixel might have gone.”
Read: Studying Greenland’s ice to understand climate change
The team ultimately used this technique to calculate the speed of Greenland’s glaciers from 1972 to 1992. Then they combined that data with modern observations of the ice sheet to estimate its historical mass. (They used a similar method to estimate Antarctica’s ice loss in a paper published earlier this year.)
Rignot and his colleagues relied on another new resource too: OMG!
As in, literally, the project is named OMG, short for Oceans Melting Greenland. OMG is a five-year NASA mission, started in 2016, to study how warmer oceans are eroding Greenland’s waterfront glaciers. Rignot helps lead it. “Thanks to OMG, we’ve been able to construct a [bedrock] model of Greenland that is pretty good under the ice, and is very, very good underneath the ocean,” he said.
Brad Lipovsky, a glaciologist at Harvard who was not connected to the research, said in an email that the results “seem plausible at first glance,” but that scientists would need to carefully check some of the team’s methodology. The overall story of Greenland, he said, is that the ice sheet’s flow is slowly accelerating. This “makes sense,” he said, “because it takes the slowly flowing ice sheet a lot longer to respond than the rapidly evolving atmosphere.”
Rignot believes that the new study should make glaciologists look anew at the speed with which Greenland could collapse. The ice sheet’s bleeding-out could eventually raise global sea levels by as much as 25 feet. So the key question, Rignot said, is “How fast can you make these entities fall apart?” The answer will matter to all of us. The surface of Greenland doesn’t have to move through magic to other parts of the world—already, today, its deluge is on its way.
Greenland Ice Sheet Losing Ice at Alarming Rate
Miami Provides a Preview of Our Climate Future
NASA researchers burn leftover wood on the Helheim Glacier,
which is one of the fastest-moving ice floes in Greenland.
LUCAS JACKSON / REUTERS
The Greenland Ice Sheet is the world’s second-largest reservoir of fresh water sitting on the world’s largest island. It is almost mind-bogglingly huge.
If Greenland were suddenly transported to the central United States, it would be a very bad day for about 65 million people, who would be crushed instantly. But for the sake of science journalism, imagine that Greenland’s southernmost tip displaced Brownsville, Texas—the state’s southernmost city—so that its icy glaciers kissed mainland Mexico and the Gulf thereof. Even then, Greenland would stretch all the way north, clear across the United States, its northern tenth crossing the Canadian border into Ontario and Manitoba. Kansas City, Oklahoma City, and Iowa City would all be goners. So too would San Antonio, Memphis, and Minneapolis. Its easternmost peaks would slam St. Louis and play in Peoria; its northwestern glaciers would rout Rapid City, South Dakota, and meander into Montana. At its center point, near Des Moines, roughly two miles of ice would rise from the surface.
Suffice it to say: The Greenland Ice Sheet, which contains enough water to refill the Great Lakes 115 times over, is very large. And it is also falling apart.
A new study finds that the Greenland Ice Sheet added a quarter inch of water to global sea levels in just the past eight years. The research, published Monday in the journal Proceedings of the National Academy of Sciences, covers nearly 20 years previously not included in our detailed understanding of the troubled Greenland Ice Sheet. It finds that climate change has already bled trillions of tons of ice from the island reservoir, with more loss than expected coming from its unstable northern half.
“The glaciers are still being pushed out of balance,” Eric Rignot, a senior scientist at NASA and an author of the paper, told me. “Even though the ice sheet has [sometimes] been extremely cold and had low surface melt in the last year, the glaciers are still speeding up, and the ice sheet is still losing mass.”
The paper casts the transformation of the Greenland Ice Sheet as one of the profound geological shifts of our time. Scientists measure the mass of ice sheets in “gigatons”—each unit equal to 1 billion metric tons, or roughly the same amount of water that New York or Los Angeles uses in a year. Greenland, according to the study, has lost 4,976 gigatons of water since 1972. That’s enough water to fill 16 trillion bathtubs or 1.3 quadrillion gallon jugs. That much water weighs about 11 quadrillion pounds. (A quadrillion is 1 with 15 zeros after it.)
More worryingly, the paper finds that Greenland lost about half of that ice—roughly 2,200 gigatons—in the years between 2010 and 2018. The ice sheet has also failed to gain mass in any year since 1998.
This melting isn’t happening at a steady pace, in other words. Greenland’s demise seems to be accelerating. Think of Greenland as a huge inland ice sea, surrounded by faster-moving ice rivers (which are glaciers) that empty the sea and carry ice to the ocean. The paper finds that those rivers are speeding up, carrying ice out of the island’s core nearly twice as fast now as they did in the 1990s or 2000s.
Read: Ancient Rome’s collapse is written into Arctic ice
That’s an alarming result, because it means glaciers might now be shrinking Greenland from the bottom faster than hot weather can melt it from the top. And researchers believe that bottom-melting glaciers are less stable and more prone to rapid collapse. “If there’s a risk of rapid sea-level rise in the future, it will be associated with glaciers speeding up, and not anything happening at the surface,” Rignot said.
The paper’s findings are stirring in part because they go much further back in time. “A lot of the publications [about Greenland’s mass] start in 2000 or 2002, some go back to 1992, but this is the first time we go back another 20 years,” Rignot said. Historically, most studies of Greenland combine data from radar flybys, GPS beacons, and laser or gravity-sensing satellites. But there’s not enough data from before 1992 to be useful, so that’s when estimates usually stop.
Rignot and his colleagues helped hit upon a new resource. The U.S. Geological Survey’s Landsat satellites have circled the planet nonstop since 1972, imaging every speck of land on Earth every 16 days. This archive—which is a kind of Earth-science version of taking a photo of yourself every day for years—includes hundreds of images of Greenland. Rignot and his team taught a computer how to read those pictures of its icy surface, zooming in especially on the dozens of glaciers that connect the interior ice sheet to the sea.
“It’s looking at two different pictures of a glacier, before and after. [In each frame,] the rocks don’t move but the glacier moves, so it can compare and cross-correlate image points,” Rignot said. “Then the algorithm searches around the window for where the pixel might have gone.”
Read: Studying Greenland’s ice to understand climate change
The team ultimately used this technique to calculate the speed of Greenland’s glaciers from 1972 to 1992. Then they combined that data with modern observations of the ice sheet to estimate its historical mass. (They used a similar method to estimate Antarctica’s ice loss in a paper published earlier this year.)
Rignot and his colleagues relied on another new resource too: OMG!
As in, literally, the project is named OMG, short for Oceans Melting Greenland. OMG is a five-year NASA mission, started in 2016, to study how warmer oceans are eroding Greenland’s waterfront glaciers. Rignot helps lead it. “Thanks to OMG, we’ve been able to construct a [bedrock] model of Greenland that is pretty good under the ice, and is very, very good underneath the ocean,” he said.
Brad Lipovsky, a glaciologist at Harvard who was not connected to the research, said in an email that the results “seem plausible at first glance,” but that scientists would need to carefully check some of the team’s methodology. The overall story of Greenland, he said, is that the ice sheet’s flow is slowly accelerating. This “makes sense,” he said, “because it takes the slowly flowing ice sheet a lot longer to respond than the rapidly evolving atmosphere.”
Rignot believes that the new study should make glaciologists look anew at the speed with which Greenland could collapse. The ice sheet’s bleeding-out could eventually raise global sea levels by as much as 25 feet. So the key question, Rignot said, is “How fast can you make these entities fall apart?” The answer will matter to all of us. The surface of Greenland doesn’t have to move through magic to other parts of the world—already, today, its deluge is on its way.

No comments:
Post a Comment