

Photograph Source: The White House – Public Domain
President Trump and his administration have repeatedly sought to contrast the economy since the start of his term with what they claim was a disastrous Biden administration. As Trump put it on March 4, 2025 in his address to Congress, “We inherited from the last administration an economic catastrophe and an inflation nightmare.” To hear them tell it, any lagging economic indicators are attributable to Biden; nonetheless, on their watch things have never been better. As Trump explained during his 2026 State of the Union, “The roaring economy is roaring like never before.”
In fact, by most economic measures the economy’s performance was outstanding during President Biden’s term in office. A year into the Trump administration, there are signs of concern.
This paper goes over some key measures. It compares the averages for the four years of the Biden administration, as well as giving the 2024 data, alongside the data for the first year of the Trump administration.
First, some context. When Biden took office at the start of 2021, the economy was still far from having recovered from the pandemic recession. COVID-19 was still widespread, and the vaccines were just beginning to be rolled out. Many analysts had expected the economic impact of the pandemic to quickly diminish as most of the population got the vaccine. As it turned out, the vaccines were far less effective against two subsequent COVID strains that developed over the course of the next year. This further delayed the return to normal; tens of millions of people were still not reverting back to normal consumption of services, like going to restaurants or traveling.
While these waves did not prevent employment from bouncing back quickly, it meant that the shift to goods consumption continued much longer than expected, leading to worldwide supply chain problems. This in turn caused a burst of worldwide inflation.
By the second half of 2024, inflation was coming down close to the Fed’s 2.0 percent target, with unemployment hovering near 4.0 percent, a level generally considered full employment. This was the economy that was handed to Donald Trump in 2025.
Now, let’s see how things compare between the two administrations.
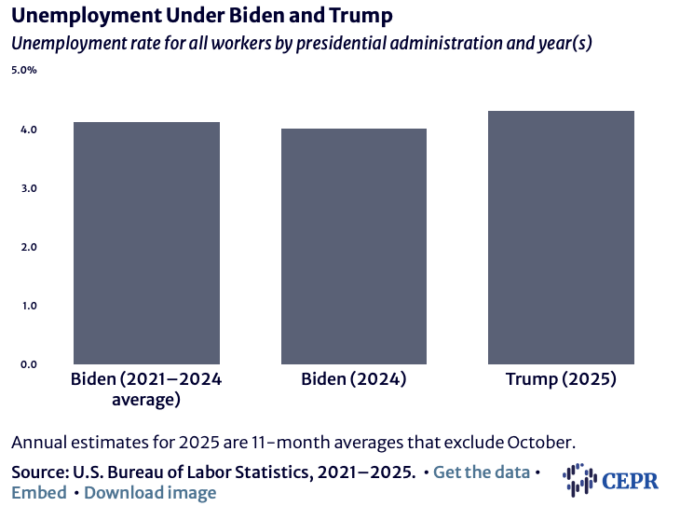
Under Biden, The Longest Stretch of Low Unemployment in 70 Years
Shortly after taking office, President Biden pushed through his recovery package. The unemployment rate quickly fell from 6.6 percent in January of 2021 to 3.9 percent by the end of the year. It didn’t rise above 4.0 percent until June of 2024. The longest period where the unemployment rate has been at or below 4.0 percent since the early 1950s.
Even when it crossed 4.0 percent, it peaked at just 4.2 percent and was back to 4.0 percent at the end of Biden’s term in January. For the full term; the unemployment rate averaged 4.1 percent. It also averaged 4.1 percent in Biden’s last year.
Meanwhile, in the first full year of the Trump presidency the unemployment rate has averaged 4.3 percent.
Unemployment matters not only to the relatively small portion of the workforce that is unemployed at a point in time. Roughly 6 million workers lose or leave their jobs every month. That comes to more than 70 million over the course of a year, although many change jobs more than once. If the labor market is strong, these workers will be able to quickly find a new job with decent pay and working conditions. In a weak labor market, their prospects for finding a good job will be far worse. The number of people quitting their jobs has fallen sharply in the last year, although the decline began in 2024.
Job Growth Soared with Recovery Act, Then Slowed with Curbs on Immigration
When Biden took office in January 2021, the immediate bounce back in jobs from the ending of the shutdown was over. Job growth averaged just 150,000 a month in the last three months of the first Trump administration. At that rate of growth, it would have taken more than five years to get back the jobs lost in the pandemic.
The Recovery Act greatly accelerated job creation, restoring lost jobs by June 2022. The economy continued to create jobs at a healthy pace throughout the Biden years. The total gain was 14,240,000 jobs, just under 300,000 a month.
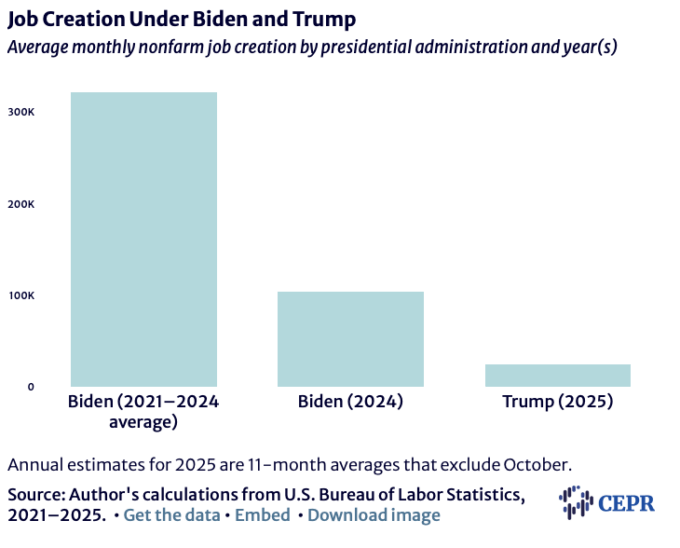
In the last year of the Biden presidency, the economy created just over 1.2 million jobs, an average of over 100,000 a month. In the year from January 2025 to January of 2026 (the survey for the January jobs report is done before the 20th and therefore the month is attributed to Biden), the economy created 290,000 jobs, or an average of 24,000 a month.
The slowing, or even reversal, of immigration is a major factor in slower job growth. The domestic labor force is growing slowly as the baby boom cohorts are retiring in large numbers.
Real Wage Growth Soared and Then Slumped
Despite the spurt of pandemic inflation, wages substantially outpaced prices over the course of the Biden administration. Measuring wage growth with the pandemic is somewhat tricky, since the loss of tens of millions of mostly low-paid jobs (e.g., hotel and restaurant workers) skewed the average upward.
The average hourly wage jumped 5.3 percent from February 2020 to April 2020, as tens of millions of workers were laid off due to the pandemic. When these workers got their jobs back, it lowered the average wage. Measuring wage growth starting in February of 2020, the last month before the shutdown, removes this problem, even though it means the period does not align perfectly with the Biden presidency.
Using February 2020 as the start point, the average hourly wage grew at an annual rate of 0.4 percent under Biden. That is hardly spectacular, but given the disruptions created by the pandemic and the war in Ukraine, it is worth noting that it was still positive. Real wages did not keep pace with inflation over the pandemic and recovery in most other wealthy countries.
The lowest paid workers did considerably better, which is a predictable result of the tight labor market in the years following the reopening. The Economic Policy Institute found that workers at the 10th decile of the wage distribution had a real pay increase of 15 percent between 2019 and 2024, the fastest pace of wage growth for low-paid workers in more than half a century.
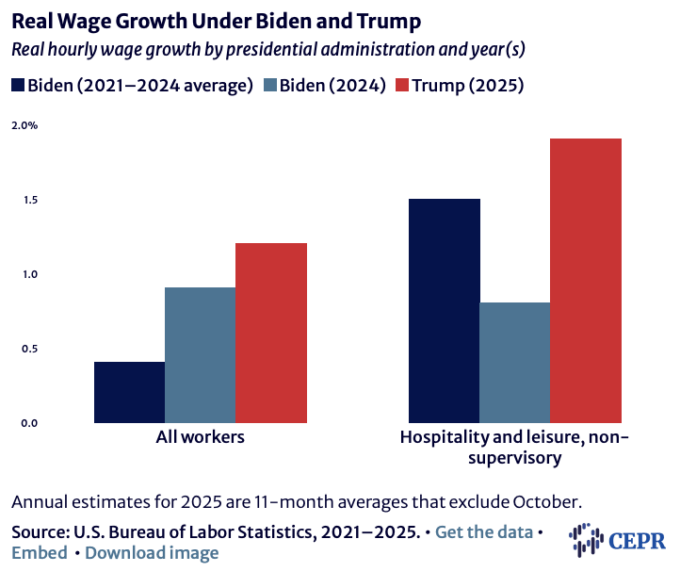
The pay for production and non-supervisory workers in the leisure and hospitality sector can be used as a proxy for low-paid workers. The real wage for these workers grew at an average rate of 1.5 percent from February 2020 to January 2025.
In the last year of the Biden administration, real wages for all workers rose by 0.9 percent. For production and non-supervisory workers in the leisure and hospitality sector it rose by 0.8 percent. The slower growth in the latter can be explained by the weakening of the labor market as the unemployment rate rose above 4.0 percent.
In 2025, the real wage for all workers grew 1.2 percent. For production and non-supervisory workers in the leisure and hospitality sector it grew 1.9 percent. The faster rate of growth for workers in this low-paid sector is somewhat surprising since it goes along with many indications of labor market weakness, like falling quit rates and a sharp rise in unemployment for young and Black workers.
Unemployment for Black Workers Fell Under Biden, But Jumped Under Trump
One often overlooked benefit of full employment is that it creates opportunities for workers who are otherwise disadvantaged in the labor markets. This is most evident when comparing the unemployment rate for Black workers with the rate for white workers. While this ratio averages near 2 — meaning the Black unemployment rate tends to be twice as high as White unemployment — it fell to 1.6 during the pandemic recovery, as the unemployment rate for Black workers hit a record low of 4.8 percent in April of 2023.
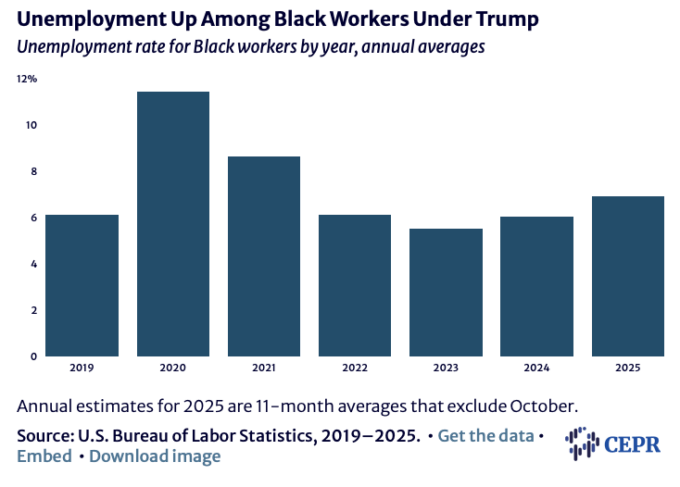
As the labor market weakened some in 2024, the unemployment rate for Black workers rose. It averaged 6.0 percent for the last year of the Biden administration, compared to an average of 6.5 percent over the full four years. The unemployment for Black workers has risen rapidly in 2025, hitting 8.3 percent in November. It has averaged 6.9 percent in the year from January 2025 to January 2026.
Unemployment for Native-Born Workers Fell Under Biden, but Rose Under Trump
While the number of foreign-born workers has stopped growing — and quite possibly shrank — under Trump, this has not in any obvious way benefited native-born workers.* While the employment numbers for native-born workers are not meaningful, the unemployment rate is meaningful, since it is the percentage of people answering the survey who say they are unemployed.
The unemployment rate soared in 2020 with the pandemic shutdown. (Only annual data are shown, since the monthly data are not seasonally adjusted.) It jumped from 3.8 percent in 2019 to 7.8 percent in 2020. It fell back quickly over the next two years, averaging 5.3 percent in 2021 and just 3.7 percent in 2022. It rose back to 4.0 percent in 2024. For 2025, it averaged 4.3 percent.
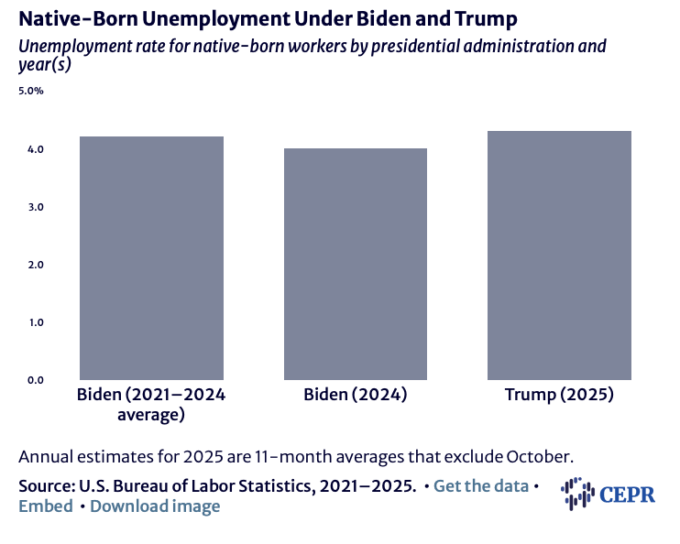
There is research indicating that immigrants improve demand for native-born workers by providing labor that is complementary to the labor of native-born workers. It’s too early to say definitively that the reduced supply of immigrants has hurt the native-born labor force, but the rise in unemployment does not make it appear that it has helped.
GDP Growth Boomed and Then Normalized Under Biden, Remains Healthy Under Trump
The recovery package led the economy to soar in the second quarter of 2021, when its impact was first being felt. It slowed in 2022 but maintained a solid pace of growth through the Biden presidency. For the four years, growth averaged 3.2 percent. In 2024, the economy grew 2.4 percent.
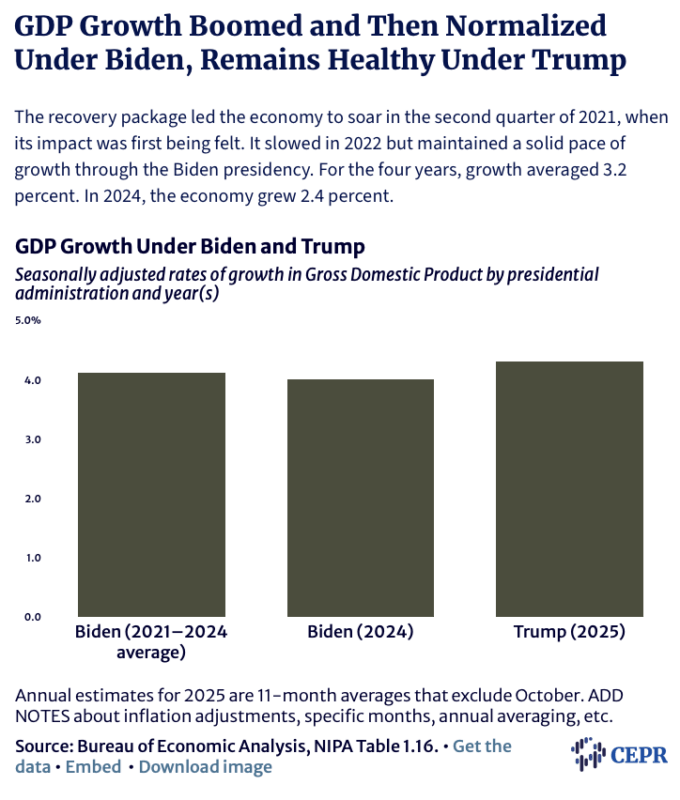
Growth has been erratic since Trump took office, with the economy actually contracting in the first quarter of 2025. It grew rapidly in the next two quarters but fell back to just a 0.7 percent rate in the fourth quarter. For the full year, it grew 2.0 percent.
Inflation Soared with the Reopening, Then Settled Down Quickly
Inflation fell sharply with the pandemic recession in 2020. It was still low at the end of the year, but as the economy recovered it accelerated rapidly. This was due not only to increased demand, but also the fact that supply was constrained by the pandemic. The pandemic shutdowns — not only in the United States but around the world — disrupted production well into 2022.
The disruptions continued long past the initial wave and the introduction of vaccines, since the virus mutated into new and more resistant strains. Also, the persistence of the pandemic discouraged people from spending on services like restaurants and travel. Instead, they spent more on goods, like cars and appliances, further straining supply chains.
This sent prices soaring in 2021, with inflation peaking in early 2022. It began to slow in the second half of the year and continued to slow through 2023 and 2024. By the time of the election the year-over-year (YOY) inflation rate was approaching the Fed’s 2.0 percent target, which it was generally expected to hit in 2025.
Instead, inflation picked up due to the Trump administration’s tariffs. These began to affect inflation even before he took office. The price index for core goods, which excludes food and energy products, had been falling all through 2024. By October it was down 1.2 percent YOY. However, prices in this category turned around and began rising after the election. The annualized rate of inflation in this component in the last three months of 2024 was 0.8 percent.
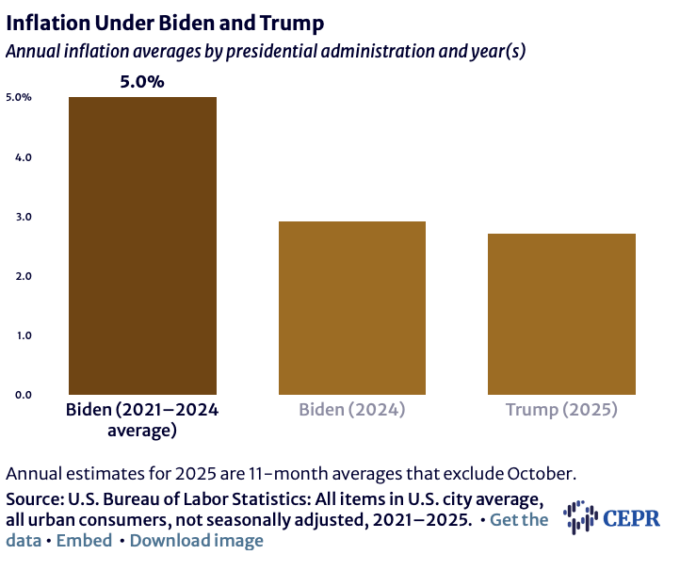
The annualized inflation rate from January 2025 to January 2026 was 2.7 percent, almost exactly the same as the 3.0 percent rate for the last year of the Biden administration. This compares to an average rate of 5.0 percent over Biden’s four-year term.
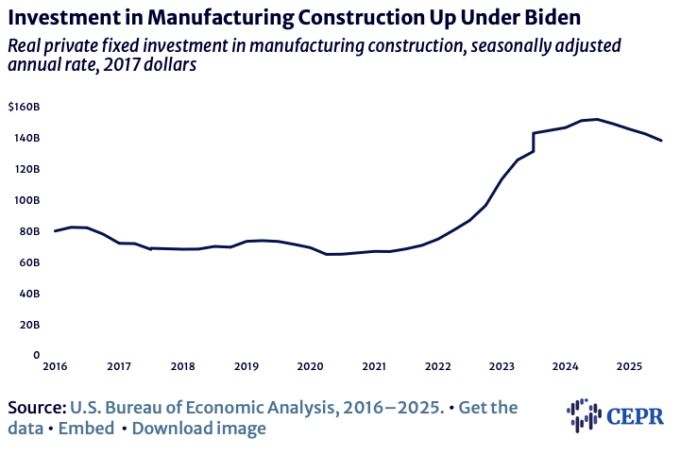
Factory Construction Soared Due to Biden Measures, But Trailed Off in 2025
The Biden administration pushed through three major bills in 2022 that provided a major boost to factory construction: a bipartisan infrastructure bill, the CHIPS Act to promote the reshoring of manufacturing of advanced computer chips, and the Inflation Reduction Act, which provided large incentives for clean energy and electric vehicles.
These measures led to an unprecedented boom in factory construction. After falling sharply in the pandemic, real investment in factories rose in 2021 and then jumped past the pre-pandemic level in the first quarter of 2022. It continued to rise rapidly, and by the second quarter of 2024 it was more than twice the pre-pandemic level. It began to slow in the fourth quarter of 2024. By the fourth quarter of 2025, factory construction was down almost 16.0 percent from its 2024 peak.
Biden Handed Trump the Strongest Economy in Half a Century. Tariffs, Mass Deportations, and Corruption May Derail It
By pretty much every standard measure, the economy was quite strong at the end of 2024. Inflation was somewhat above the Fed’s 2.0 percent target, but it had been headed downward for the prior two years and nearly all projections showed inflation continuing to decline. The Fed was lowering interest rates, and these rate cuts would almost certainly have continued into the winter, if the election of Donald Trump had not raised the prospect of sharply higher tariffs and inflation. Lower rates would have helped to lower mortgage rates and boost construction, which would hasten the decline in house prices.
It is far too soon to pronounce a verdict on the Trump administration’s policies, but the impact to date has been the opposite of what has been claimed. Higher tariffs have boosted inflation, even if by somewhat less than many had predicted. Job creation has slowed and the unemployment rate has risen. And there is no evidence of a manufacturing boom, as both manufacturing employment and factory construction have fallen.
* There has been serious confusion about the number of employed native-born workers, in large part due to claims by the Trump administration. The BLS does publish a monthly figure for employed native-born workers, but this likely bears little relationship to reality.
BLS calculates this number based on its population controls, which it puts in place at the start of the year based on Census data and projected growth. The controls are fixed, independently of what actually happens in the world. If half the population dies due to a pandemic, the controls would still show the same number of people for a given month.
BLS then uses the Current Population Survey to get the number of foreign-born. The native-born number is then taken as a residual: the total population projected from the population controls, minus the number who answer they are foreign-born on the survey. If fewer people answer they are foreign-born — either because immigrants have left the country, they lie on the survey, or they refuse to answer at all — then the BLS data would show an increase in the native-born population.
This is the basis for the Trump administration’s claim of a huge increase in the number of native-born people who are employed. This claim derives from a misunderstanding of the data, not something that is happening in the real world.
This first appeared on Dean Baker’s Beat the Press blog.
No comments:
Post a Comment