
Anthropic calls for ‘brake pedal’ before AI develops itself without human oversight
 Copyright AP Photo/Patrick Sison, File
Anthropic co-founder Jack Clark said AI agents might soon be able to build and train models themselves and, if that happens, humans could lose control over AI systems.
Anthropic co-founder Jack Clark wants the AI industry to pump the brakes before the technology starts further developing itself without human input.
Speaking to the BBC, Clark said 80% of Anthropic’s coding work is already being done by its AI Claude, and that it could go up to 100% in a couple of years. However, he said “it’s a choice” whether AI companies let it get that far without stopping it.
“We think this is a topic that the world should be talking more about,” Clark said. “The AI industry right now has a gas pedal, but it doesn’t have a brake pedal in the car, and we want to do some of the work to build that pedal.”
This process is called “recursive self-improvement,” where an AI is able to improve itself without human input, according to Anthropic in a related blog post from Thursday night.
In a recursive model, AI agents, the autonomous workers built by a chatbot, could “become capable enough to build and train models themselves,” so Claude “could be continuously improved by Claude,” Anthropic said.
While recursive AI could bring some good to the fields of science and healthcare, Anthropic warns that it might mean increasing “the risks of humans losing control over AI systems.”
“If systems are capable of fully building their own successors, the ways we secure them, monitor them and shape their behaviour all grow much more important,” the blog post reads.
There is evidence within Anthropic’s own model that recursion is coming sooner rather than later. It points to the fact that code correction rates by their staff have been falling steadily for the last year, which means there are fewer errors in what Claude is producing.
Claude is also able to run its own research experiments when given an open-ended question, such as “Can a weaker model supervise a stronger one?” and come up with its own solutions without human input.
“The evidence suggests that the human role is narrowing at each step in the AI development process,” the blog reads.
Anthropic said its institute will conduct research to build a system to check whether developers have actually stopped or slowed down the move towards recursive AI, it said.
However, a real slowdown would require “multiple well-resourced labs at or near the frontier, in multiple countries, agreeing to stop under the same conditions.”
'Human role narrowing': Anthropic calls for global AI slowdown as systems could escape control
The developer of the Claude chatbot says a pause in the AI race would "likely be a good thing" and warns that cutting-edge models are beginning to show signs they could become increasingly difficult for humans to control.
Issued on: 05/06/2026 -
By: FRANCE 24
 The Anthropic logo is seen in this illustration taken May 20, 2024. © Dado Ruvic, Reuters
Artificial intelligence company Anthropic suggested Thursday a global pause on building the most powerful AI systems as the latest models are beginning to show signs they could escape human control.
The San Francisco-based company, which makes the Claude family of AI models, said in a report that a worldwide slowdown in cutting-edge AI development would "likely be a good thing" – but warned that if only one company stopped, rivals would simply race ahead.
"We believe it would be good for the world to have the option to slow or temporarily pause frontier AI development to enable societal structures and alignment research to keep up with the advance of the technology," it said.
Getting a real pause to work would mean multiple major AI companies in multiple countries – most notably the US and China – all agreeing to stop at the same time, under rules everyone could actually verify, Anthropic said.
"Without a global coordination mechanism, companies and governments will have to make difficult decisions about safety while under competitive and geopolitical pressures," it said.
The company has faced pushback from others in the industry – and officials in the White House – who say its focus on worst-case scenarios overstates the risks and amounts to a strategy for slowing rivals under the cover of safety concerns.
Still, the White House has acknowledged the power of the company's Mythos model, which has not been made available to the general public due to its cybersecurity capabilities and is currently deployed only to a small number of vetted organisations.
The proposal would face an uphill battle in Washington and Silicon Valley, where US officials and tech executives have repeatedly argued that any slowdown in AI development risks handing China a decisive strategic edge in what many see as the defining technology race of the century.
US President Donald Trump, however, said he discussed the possibility of cooperating with China on AI safety issues during his recent visit to Beijing.
Trump also signed an executive order this week that allows the government 30 days to conduct a preliminary review of the most powerful US AI models before their release.
'Human role narrowing'
Anthropic compared the problem to nuclear arms control treaties – but said it would be even harder to get a handle on, since AI training is far easier to hide than a missile silo, and the temptation to quietly keep going would be enormous.
The company said it plans to bring together government officials, scientists, advocacy groups and competing AI firms in coming months to figure out how such a system could work.
The call for coordination comes alongside internal data showing that AI is already dramatically speeding up the development of AI itself, Anthropic said.
That acceleration creates a feedback loop that Anthropic warned could eventually lead to what researchers call "recursive self-improvement."
That's the idea of an AI system that becomes capable of essentially teaching itself to get smarter, without much human help.
"We are not there yet, and recursive self-improvement is not inevitable," the report said, while adding that it could arrive sooner than most governments and institutions are ready for.
"The evidence suggests that the human role is narrowing at each step in the AI development process," the company said.
(FRANCE 24 with AFP)
Anthropic co-founder Jack Clark wants the AI industry to pump the brakes before the technology starts further developing itself without human input.
Speaking to the BBC, Clark said 80% of Anthropic’s coding work is already being done by its AI Claude, and that it could go up to 100% in a couple of years. However, he said “it’s a choice” whether AI companies let it get that far without stopping it.
“We think this is a topic that the world should be talking more about,” Clark said. “The AI industry right now has a gas pedal, but it doesn’t have a brake pedal in the car, and we want to do some of the work to build that pedal.”
This process is called “recursive self-improvement,” where an AI is able to improve itself without human input, according to Anthropic in a related blog post from Thursday night.
In a recursive model, AI agents, the autonomous workers built by a chatbot, could “become capable enough to build and train models themselves,” so Claude “could be continuously improved by Claude,” Anthropic said.
While recursive AI could bring some good to the fields of science and healthcare, Anthropic warns that it might mean increasing “the risks of humans losing control over AI systems.”
“If systems are capable of fully building their own successors, the ways we secure them, monitor them and shape their behaviour all grow much more important,” the blog post reads.
There is evidence within Anthropic’s own model that recursion is coming sooner rather than later. It points to the fact that code correction rates by their staff have been falling steadily for the last year, which means there are fewer errors in what Claude is producing.
Claude is also able to run its own research experiments when given an open-ended question, such as “Can a weaker model supervise a stronger one?” and come up with its own solutions without human input.
“The evidence suggests that the human role is narrowing at each step in the AI development process,” the blog reads.
Anthropic said its institute will conduct research to build a system to check whether developers have actually stopped or slowed down the move towards recursive AI, it said.
However, a real slowdown would require “multiple well-resourced labs at or near the frontier, in multiple countries, agreeing to stop under the same conditions.”
'Human role narrowing': Anthropic calls for global AI slowdown as systems could escape control
The developer of the Claude chatbot says a pause in the AI race would "likely be a good thing" and warns that cutting-edge models are beginning to show signs they could become increasingly difficult for humans to control.
Issued on: 05/06/2026 -
By: FRANCE 24
Artificial intelligence company Anthropic suggested Thursday a global pause on building the most powerful AI systems as the latest models are beginning to show signs they could escape human control.
The San Francisco-based company, which makes the Claude family of AI models, said in a report that a worldwide slowdown in cutting-edge AI development would "likely be a good thing" – but warned that if only one company stopped, rivals would simply race ahead.
"We believe it would be good for the world to have the option to slow or temporarily pause frontier AI development to enable societal structures and alignment research to keep up with the advance of the technology," it said.
Getting a real pause to work would mean multiple major AI companies in multiple countries – most notably the US and China – all agreeing to stop at the same time, under rules everyone could actually verify, Anthropic said.
"Without a global coordination mechanism, companies and governments will have to make difficult decisions about safety while under competitive and geopolitical pressures," it said.
The company has faced pushback from others in the industry – and officials in the White House – who say its focus on worst-case scenarios overstates the risks and amounts to a strategy for slowing rivals under the cover of safety concerns.
Still, the White House has acknowledged the power of the company's Mythos model, which has not been made available to the general public due to its cybersecurity capabilities and is currently deployed only to a small number of vetted organisations.
The proposal would face an uphill battle in Washington and Silicon Valley, where US officials and tech executives have repeatedly argued that any slowdown in AI development risks handing China a decisive strategic edge in what many see as the defining technology race of the century.
US President Donald Trump, however, said he discussed the possibility of cooperating with China on AI safety issues during his recent visit to Beijing.
Trump also signed an executive order this week that allows the government 30 days to conduct a preliminary review of the most powerful US AI models before their release.
'Human role narrowing'
Anthropic compared the problem to nuclear arms control treaties – but said it would be even harder to get a handle on, since AI training is far easier to hide than a missile silo, and the temptation to quietly keep going would be enormous.
The company said it plans to bring together government officials, scientists, advocacy groups and competing AI firms in coming months to figure out how such a system could work.
The call for coordination comes alongside internal data showing that AI is already dramatically speeding up the development of AI itself, Anthropic said.
That acceleration creates a feedback loop that Anthropic warned could eventually lead to what researchers call "recursive self-improvement."
That's the idea of an AI system that becomes capable of essentially teaching itself to get smarter, without much human help.
"We are not there yet, and recursive self-improvement is not inevitable," the report said, while adding that it could arrive sooner than most governments and institutions are ready for.
"The evidence suggests that the human role is narrowing at each step in the AI development process," the company said.
(FRANCE 24 with AFP)
Tech giants warn AI safety gaps could hand bioweapons to bad actors
 Copyright Cleared/Canva
Synthetic DNA can be used for vaccines, but it can also create bioweapons. Tech giants and biotechnology experts are asking for stronger regulation.
The CEOs of some of the biggest artificial intelligence (AI) companies, including OpenAI, Anthropic, Microsoft AI and Google DeepMind have teamed up with biotechnology experts to urge the United States to pass laws requiring safety screenings of synthetic DNA purchases.
Synthetic DNA refers to artificially manufactured genetic material, which can be custom-made by companies and ordered online, and delivered like any other laboratory supply.
The letter is directed at the US Congress, but the issue has global implications as the material can be ordered and shipped worldwide.
“The ability to order synthetic DNA online has accelerated vaccine development, powered basic research, and made it possible for small teams to access capabilities that used to be confined to major institutions,” the signatories wrote.
But it also creates a risk, as, in theory, a bad actor could order DNA sequences designed to recreate dangerous pathogens.
Synthesized DNA has a wide range of uses. It helps create life-saving medicines, engineer microorganisms and store vast amounts of digital data.
Some companies already check orders and customers voluntarily, but there is no current legal requirement to do so.
The letter noted that screening “is also one of the best understood and least disruptive biosecurity measures available”.
The signatories also ask for mandatory record-keeping in case there is a need to track suspicious activity, and not only after the fact, but because awareness of traceability deters misuse, according to the letter.
“So that any threat that might evade initial screening can be traced back to its source — including when individual sequences would not raise concern in isolation,” the letter read.
The authors noted that while this issue is not new, the pace of progress in artificial intelligence is and AI systems can now outperform PhD-level virologists on questions about highly technical laboratory procedures.
As systems rapidly improve, experts warn that the knowledge barriers that have historically prevented bad actors from obtaining biological weapons will “meaningfully erode”.
Earlier this year, researchers worldwide also warned that unrestricted access to certain biological datasets could enable AI systems to help design or enhance dangerous viruses, calling for stronger safeguards to prevent misuse.
In an open letter published in February, researchers from leading institutions, including Johns Hopkins University, the University of Oxford and Stanford University, argue that while open-access scientific data has accelerated discovery, a small subset of new biological data poses biosecurity risks if misused
To guarantee safe access, the letter called for specific technical tools that would enable data providers to verify legitimate users and track misuse, such as watermarking and audit logs.
What is the situation in Europe?
The European Commission published the EU Biotech Act in 2025, a proposal to regulate the EU’s biotechnology and biomanufacturing sectors, where it warns that “biotechnology introduces new biosecurity risks as the wider accessibility of these technologies increases their potential for misuse, posing significant health threats”.
There is currently no European law to regulate the purchases of these materials, and the Commission noted that divergent or absent national rules fail to offer a level playing field to competitors and weaken prevention.
The Act identifies synthetic nucleic acid sequences (DNA and RNA) as “biotechnology products of concern,” and proposes a new EU-wide framework.
The Commission’s proposal introduces some of the same ideas as the US letter, including customer verification and reporting of suspicious orders.
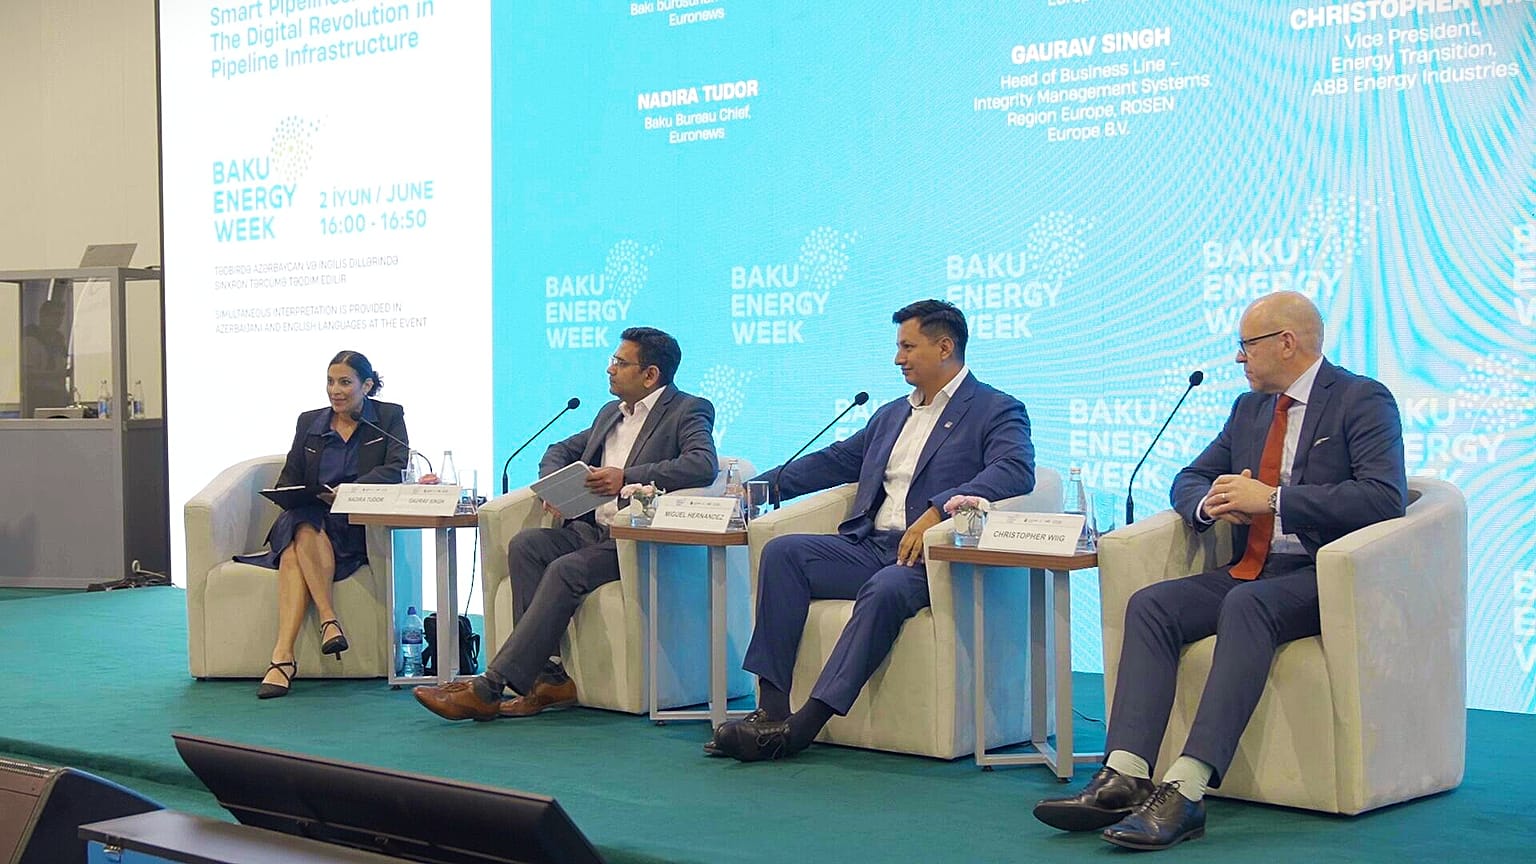
Smart pipelines: Can AI protect the world’s energy lifelines?
 Copyright euronews
As ageing pipelines face growing risks, the energy industry is increasingly turning to AI and smart monitoring systems to improve their safety and efficiency.
Around 500,000 kilometres of oil and gas pipelines worldwide need to be renovated, rebuilt or upgraded, while leaks, ruptures and incidents already cost the sector more than $7 billion (€6bn) a year — and roughly 40% of failures go undetected in the first 24 hours, according to industry experts speaking at the Baku Energy Forum.
The scale of the problem is driving rapid adoption of sensors, machine-learning and real-time monitoring systems designed to shift pipeline management from responding to failures to anticipating them.
At the Euronews-led panel, experts described this shift as one of the most significant technological transformations facing the energy sector.
They insist that modern, smart pipelines can provide real-time awareness, predictive maintenance, leak detection, and operational optimisation, creating what industry leaders describe as an intelligent infrastructure ecosystem.
However, speakers at the forum also warned that the industry faces a deeper challenge alongside the ageing infrastructure: the people who know how to manage it are leaving.
"We believe there is a silver tsunami happening in our industry," said Gaurav Singh, Head of Integrity Management Systems for Europe at ROSEN.
Experienced engineers and specialists are retiring, while fewer young professionals are entering the sector. So, there is a concern that decades of practical knowledge built through field experience will be lost.
"If we don't utilise that knowledge, we're losing 80 years of experience that has been built over time," Singh told Euronews.
For Singh, digitalisation is about preserving the accumulated expertise on which technology depends.
AI relies on historical data and accumulated knowledge to recognise patterns and generate accurate predictions. Without that knowledge base, machine-learning systems become significantly less effective.
"Knowledge is data," Singh explained. "It feeds into the system and helps create the efficiency around these new digital solutions."
Companies such as ROSEN are already building vast data warehouses containing information from more than 26,000 inspection runs, billions of recorded anomalies and millions of kilometres of inspected pipelines.
That information can then be used to train predictive models capable of identifying corrosion risks, estimating the condition of uninspected pipelines and supporting future decision-making.
Security, resilience and trust
The growing dependence on digital systems raises its own questions.
As experienced workers retire and their expertise is encoded into software, operators risk becoming dependent on tools they no longer fully understand — a development debated across aviation, healthcare, defence and manufacturing.
Christopher Wiig, Vice President of Energy Transition at ABB Energy Industries, believes the answer lies in balance.
"The fear that machines will take over has existed since the Industrial Revolution," he told Euronews.
Rather than replacing people, he argued, digital systems should support them. "We actually need more people to do more jobs than we currently have the capability to do," Wiig said.
The conversation around smart pipelines extends far beyond maintenance to include security, resilience and trust.
"I think there are three aspects mainly to look into," said Wiig. "Personnel security, physical security and cyber security."
"In the end, it's about financial benefits," he said.
Major energy corridors such as the Baku-Tbilisi-Ceyhan pipeline and the Southern Gas Corridor are critical components of international energy security, carrying oil and gas across thousands of kilometres to global markets.
Industry forecasts suggest that smart pipeline investment across the region could reach $2.4 billion (€2bn) by 2030, while predictive analytics may reduce operating costs by up to 30%.
MIT researchers teach AI models to interpret charts
The new ChartNet training dataset could improve the accuracy of vision-language models that help analyze business trends or interpret scientific figures
image:
“We developed ChartNet to be a one-stop shop for chart understanding, covering basically anything that an AI model and a practitioner who is training that model might need,” says Jovana Kondic, an MIT electrical engineering and computer science (EECS) graduate student and lead author of a paper on ChartNet.
view more
Credit: Courtesy of Jovana Kondic
To accelerate and refine decision-making in a fast-paced, global marketplace, enterprises may deploy generative artificial intelligence models to help summarize and interpret the charts that often fill market summaries and financial reports.
But even the latest vision-language models sometimes struggle with this task, since it requires a model to integrate visual, numerical, and linguistic understanding. A company that invests in a state-of-the-art model might still receive inaccurate or incomplete information.
To fill this performance gap, researchers from MIT and the MIT-IBM Computing Research Lab developed a multifaceted resource for AI users that is specifically designed to teach vision-language models (VLMs) how to effectively interpret charts.
They used a novel data generation method to build a state-of-the-art dataset that includes more than a million varied charts. The dataset also encodes many visual, linguistic, and numerical components of each chart image, which enable models to robustly reason about the information in a chart.
The researchers used this dataset, called ChartNet, to train a series of open-source VLMs. Many of these smaller models significantly outperformed orders of magnitude larger, commercial models on tasks like data extraction and chart summarization.
By enabling open-source models to outperform their commercial counterparts, ChartNet could allow small firms with limited budgets to more readily utilize AI. The open-source dataset can be used to improve the capabilities of AI models for tasks like business trend analysis and scientific figure interpretation.
“We developed ChartNet to be a one-stop shop for chart understanding, covering basically anything that an AI model and a practitioner who is training that model might need. We hope our work motivates researchers to achieve state-of-the-art performance with smaller models that don’t require infinite amounts of computation,” says Jovana Kondic, an MIT electrical engineering and computer science (EECS) graduate student and lead author of a paper on ChartNet.
She is joined on the paper by many co-authors from MIT, the MIT-IBM Computing Research Lab, and IBM Research, including Pengyuan Li, a research staff member at IBM Research; Dhiraj Joshi, a senior scientist at IBM Research; Isaac Sanchez, a software engineer at IBM Research; Aude Oliva, director of strategic industry engagement at the MIT Schwarzman College of Computing, MIT director of the MIT-IBM Computing Research Lab, and a senior research scientist in the Computer Science and Artificial Intelligence Laboratory (CSAIL); and Rogerio Feris, a principal scientist and manager at the MIT-IBM Computing Research Lab. The research will be presented at IEEE Computer Vision and Pattern Recognition Conference.
A dataset bottleneck
Researchers have made great strides developing generative AI models that excel at natural language processing and reasoning about natural images. But less work has focused on interpreting complex multimodal data contained within charts, Kondic says.
Yet for large and small businesses in nearly every industry, chart understanding is a critical task.
“The finance industry thrives on charts. If vision-language models can extract information out of charts, like descriptions of trends, that facilitates a lot of workflows that happen downstream,” Joshi says.
The lack of high-quality training data is a major bottleneck holding back the development of VLMs that can accurately interpret charts. Many datasets contain limited chart images pulled from the internet and often lack the necessary scale and additional information to help a model interpret the underlying data.
“A vision-language model, unlike our brains, may need to see thousands of examples during training to reliably recognize something as a line chart,” Kondic says.
The researchers sought to overcome those shortcomings by generating synthetic data. Synthetic data are artificially generated by algorithms to mimic the statistical properties of actual data.
The ChartNet dataset holds more a million high-quality chart images, along with the corresponding code used to generate each chart, a textual description, and a table that contains its numerical information. In addition, each datapoint includes question-and-answer pairs to teach the model how to correctly answer questions about the chart image.
“These additional modes of data guide the model to connect and align the different pieces of information that the chart image encodes,” Kondic says.
Data generation
To build ChartNet, the researchers created a two-step, synthetic data generation pipeline.
First, their automated system translates any pre-existing set of chart images into code. Then the system iteratively augments that code to change different aspects of each chart, such as chart type, data values, topic, colors, etc.
“We can start from a single chart that we use as a seed and come up with hundreds of augmentations of it. This is how we were able to build a dataset with more than a million diverse images,” Kondic explains.
They also incorporated an automated quality check process to ensure the synthetic data are high quality. This process verifies that the code is executable and rendered chart images are accurate and clean.
“We don’t want to just be generating diverse samples. We also want the information to be presented in a meaningful way,” she says.
ChartNet also includes a selection of chart datapoints annotated by human experts. This provides access to additional types of charts and supporting data that carry validity guarantees.
A practitioner could use the annotated data to fine-tune an existing VLM, further boosting performance for a specific application, Joshi adds.
The researchers tested ChartNet by training IBM’s Granite Vision series of models as well as several other open-source models of various sizes and evaluating them on various chart interpretation tasks. The dataset improved the accuracy of all models in chart reconstruction, chart data extraction, chart summarization, and chart question answering.
With ChartNet, small open-source models consistently outperformed much larger commercial models.
“A lot of prior training datasets only focused on answering simple questions about a chart. We tried to go beyond that with ChartNet by generating data that support all aspects of robust chart understanding,” Kondic says.
In the future, the researchers plan to continue expanding ChartNet by incorporating data with added levels of complexity. They also want to draw on feedback from the research community.
This research was funded, in part, by the MIT-IBM Computing Research Lab.
###
Written by Adam Zewe, MIT News
Paper: "ChartNet: A Million-Scale, High-Quality Multimodal Dataset for Robust Chart Understanding"
https://arxiv.org/pdf/2603.27064
Article Title
"ChartNet: A Million-Scale, High-Quality Multimodal Dataset for Robust Chart Understanding"

Russia has presented a domestically developed neuromorphic processor called “Altai”, a brain-inspired chip designed to perform artificial intelligence tasks with significantly lower power consumption than conventional processors, according to information released by the project’s developers.
The processor, developed by Novosibirsk-based Motive NT with cybersecurity group Kaspersky as a strategic investor, was previously presented to Russian Prime Minister Mikhail Mishustin and is being positioned as a potential platform for autonomous systems, machine vision and electronic warfare applications.
As IntelliNews has reported, Russia has been forced to up its innovation efforts by the extreme sanction’s regime imposed by the West following its invasion of Ukraine in 2022. And it has been doing so with some success. However, semiconductors and microchips remains one of the sectors where Russian technology lags far behind that of the West, making the development of the Altai chip doubly significant, according to the Kaspersky Labs, one of the chip’s investors.
According to the developers, Altai uses spiking neural networks that generate signals only when required, mimicking aspects of biological neural activity. They claim the architecture delivers more than “1000X better energy efficiency than traditional chips” while operating at roughly 20 watts.
The company also says the processor can handle video streams at up to 2,200 frames per second while consuming less than 0.5 watts in a compact 9mm by 9mm package. The comparison was made against systems based on NVIDIA (NASDAQ: NVDA) Jetson modules, which are widely used in edge AI and robotics applications and typically consume substantially more power depending on configuration and workload.
Altai reportedly contains 256 asynchronous computing cores capable of simulating 131,072 artificial neurons and approximately 67mn synaptic connections. Neuromorphic computing has attracted growing interest globally as researchers seek alternatives to power-hungry AI accelerators used for training and inference.
Russian developers say the chip could be deployed in low-cost drones, distributed sensor networks and radio-electronic warfare equipment, enabling longer operating times on limited battery capacity. Such applications have become increasingly important as militaries seek to push AI processing closer to the battlefield rather than relying on remote data centres.
The processor remains a prototype manufactured on a 28-nanometre process and has not yet entered large-scale production. Future manufacturing could depend on access to overseas fabrication facilities, including in China, or on adaptation to older domestic production nodes, according to people familiar with Russia’s semiconductor sector.
The unveiling comes as Russia continues efforts to develop indigenous computing technologies following extensive Western export controls on advanced semiconductor equipment and chips introduced since 2022. Altai’s developers describe the processor as a step towards greater technological sovereignty in strategic computing systems.
No comments:
Post a Comment