Tuesday, August 22, 2023

Modeling the ocean to understand natural phenomena

by Hokkaido University
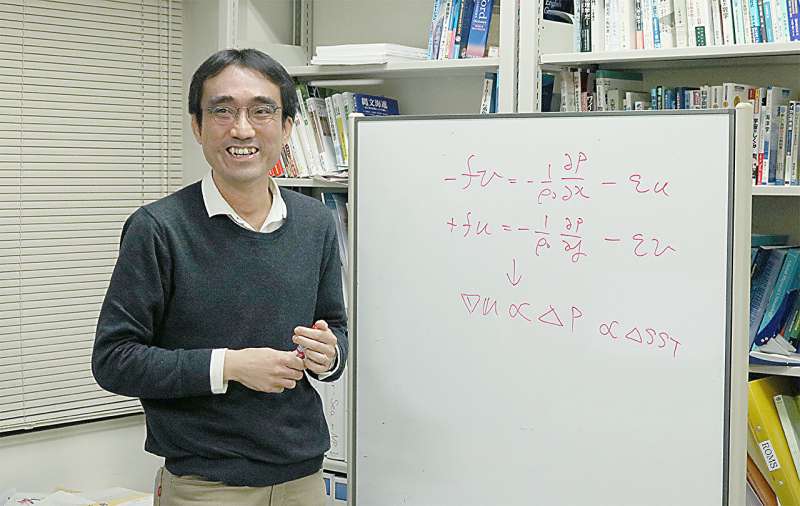
Associate Professor Yoshi N. Sasaki, Faculty of Science, Hokkaido University. Credit: Hokkaido University

Associate Professor Yoshi N. Sasaki, a specialist in Physical Oceanography, is involved in research into rising sea levels—particularly in coastal areas of Japan. He spoke about what he has learned so far about the relationship between ocean currents, sea level and climate change, what research he is currently focusing on, and the appeal of research that uses numerical modeling to uncover natural phenomena.

It is a common view among researchers that the global mean sea level is rising. The only question now is, by how much will it rise?

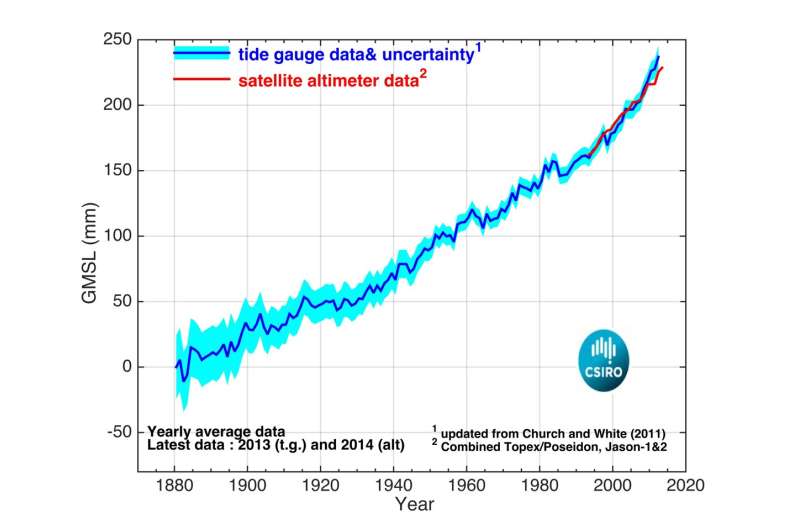
The graph below shows global average sea level, with tide-gauge data since 1880 and satellite data since 1993. It shows that the water level rose at a rate of about 1.5 to 2 millimeters per year in the 20th century, but has increased at a faster rate of about 3 millimeters per year in the 21st century. This speed is expected to increase further in the future as global warming continues.
Global mean sea level (1880-2014). 
Credit: Copyright CSIRO Australia

Indeed, on the US coast, for example in Florida, many people live on low land, and sea levels are rising faster than in other areas of the ocean. In such areas, dike building and migration are already being considered.

Researchers are now focusing on detailed predictions of what will cause sea level changes, when, in which areas, and to what extent.

As this graph is a "global average," the actual situation at different locations is much more nuanced than this alone reveals. To clarify this, simulations using numerical models are being carried out.
Sea level is the sum of multiple factors

Sea level rise does not occur uniformly across the globe, but varies greatly from one ocean region to another. The causes also vary between global changes and changes in some ocean regions.

There are two main causes of sea level rise on average across the globe. The first is the thermal expansion of seawater due to warming caused by global warming. The second is the melting of glaciers and ice sheets due to global warming. Water that was previously trapped on land as ice flows into the sea, increasing the mass of seawater and causing sea levels to rise.


Play15 questions for climate change researcher Dr. Yoshi N. Sasaki. 
Credit: Space Time for Hokkaido University

There are many different mechanisms by which sea level changes in different ocean regions. To give a few examples: one, variations in ocean circulation. Due to the physics of geostrophic currents, the sea level in the Northern Hemisphere is higher on the right side and lower on the left side in relation to the direction of the ocean currents. Two, changes in atmospheric pressure. Three, changes in the ground—the ground also sinks and rises, which changes the height of the coastal water table.

In other words, to predict sea level in an area, a combination of these factors needs to be taken into account. Specifically, the effects of each of these factors can be added together to estimate the actual rise in sea level, to some extent.

Understanding natural mechanisms using numerical models

My research involves computer simulations, using regional ocean models of the US. In principle, the model can reproduce the state of the ocean by feeding it with observed data such as atmospheric winds and temperatures.

For example, if we know that a change in water levels is caused by wind fluctuations, we can make predictions of future changes in water levels by knowing what the winds will be like in the future.

Although I simply said "By wind fluctuations," it is about understanding the mechanisms of nature. For me, it's something very enjoyable that satisfies my intellectual curiosity.

Naturally, it is not a straightforward process. Models are very complex, and to understand the mechanism, the model must first be able to reproduce the phenomena accurately. Once that is done, a "simpler model" that reproduces the same situation can be developed, revealing new principles hidden in nature. We need to look at the results of the complex models to find the essence of what is important.

When I was doing research in the US, I discovered a new mechanism that changed the ocean circulation. To someone outside the field, it would have looked like just a diagram, but after working on it for a very long time, it suddenly looked like important information that no one had ever seen before. This is the best part of research.
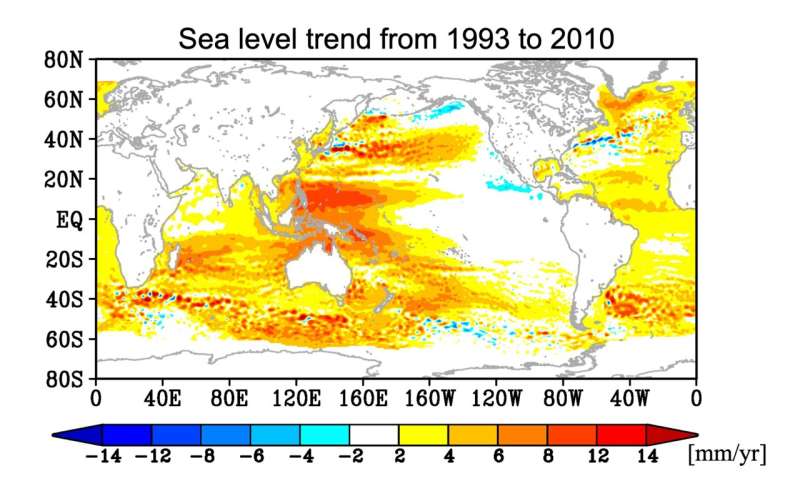
Sea level fluctuations vary from sea area to sea area. 
Credit: Yoshi N. Sasaki

Water level fluctuations along the coast of Japan

Water levels along the Japanese coast are also currently rising, but it is known that they did not rise all the way through the 20th century—they peaked once around 1950 and then fell.

Our research has shown that the peak around 1950 was dominated by wind effects. In particular, it seems to have been caused by fluctuations in ocean circulation due to wind fluctuations from a low-pressure system called the Aleutian Low. On the other hand, the rise in recent years has been found to be primarily due to the effects of heat and other factors at the sea surface.
Assessing the impact of typhoons and storm surges

In the future, typhoons and extratropical cyclones are predicted to become stronger. So far, research has been conducted on how sea level changes on long-term time scales of a decade or more, but the possibility that short-term fluctuations, such as storm surges, could cause major damage cannot be ignored.

In order to assess such impacts, we need to know exactly how typhoons and extra-tropical cyclones will strengthen in the future, and how this will affect sea levels. I am currently working on this with students, and we are hoping to get this project off the ground.

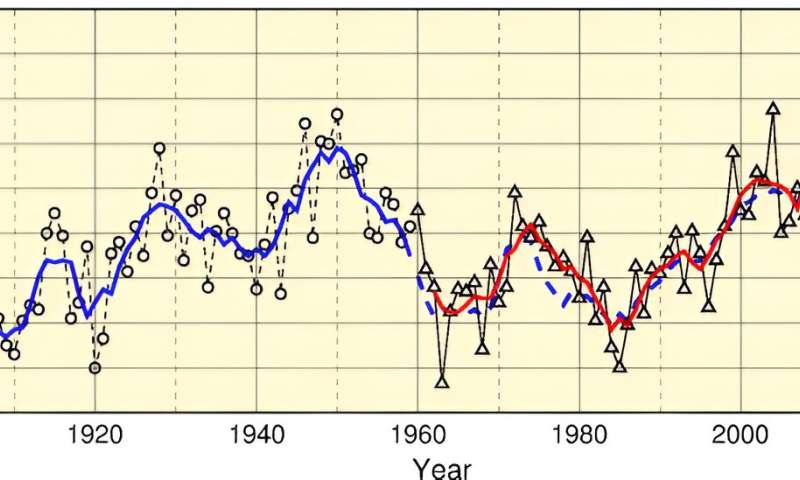
Mean sea level anomalies along the coast of Japan (1906-2020). Source: website of the Japan Meteorological Agency. Credit: Japan Meterological Agency
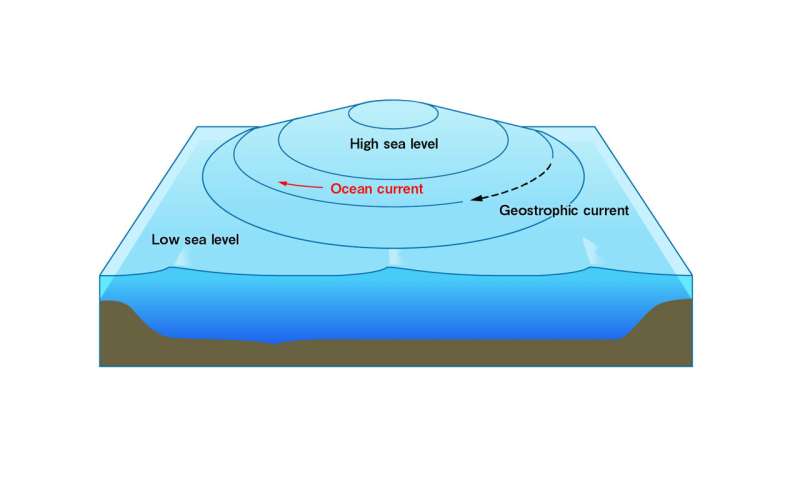
The sea level in the Northern Hemisphere is higher on the right side and lower on the left side in relation to the direction of the ocean currents. Credit: Yoshi N. Sasaki

Sea level rise is one aspect of the wider ocean


Right now, the resolution of ocean models for global warming simulations is approximately 100 kilometers, and can be narrowed down to 10 kilometers at the finest. This may be sufficient for some ocean regions, but it is not sufficient at all for some topographies, so I would like to create more detailed models and incorporate methods such as statistics and machine learning to estimate.

On the other hand, there is also a conflict between effective measures and the economic aspects. For example, in the US, there were very specific discussions about the cost of migration to avoid the influence of sea level rise and the cost of building dikes, and which is better. Once you know certain things, the rest is no longer in the field of science, but in the field of politics or in the field of society. It's about how much accuracy society demands.

I myself would like to go back to the theme of ocean currents and look for more interesting and important phenomena caused by ocean currents once I have gone through sea level rise. I think there are still many interesting phenomena caused by ocean currents, such as ocean circulation. My dream for the future is to elucidate the mechanisms of these phenomena.


Provided by Hokkaido University


Rise in toxic algae blooms requires coordinated response, say researchers

algae blooms
Credit: Unsplash/CC0 Public Domain

The prevalence of blue-green algae blooms in southern Ontario will become more frequent as temperatures rise, say Brock University researchers.

The hot, dry periods from June to August create perfect conditions for harmful  to grow, impacting fish populations and potentially putting human and pet health at risk.

Brock researchers Vaughn Mangal, assistant professor in the Department of Chemistry, and Kelly Biagi, assistant professor in the Department of Earth Sciences, are investigating what nutrients are entering the water that contribute to uncontrollable algae growth and the neurotoxins that shut down beaches and recreational water activities.

"These harmful algae blooms are triggered by , primarily phosphorus and nitrogen, from , such as applied fertilizers that runoff from the land to waterways," says Mangal. "The need for interventions and management from municipalities and  will continue to grow to help regulate how much fertilizer is used."

The Niagara region and Greater Toronto and Hamilton Area is a hub for  with a lot of agriculture,  and industrial effluents discharging inorganic pollutants and excess nutrients in harbors, lakes and waterways, Mangal says.

Understanding how contaminants, including excess nutrients, move from land to water is a major focus of Mangal and Biagi's research.

With expertise in hydrology, Biagi studies how water physically moves through ecosystems, which includes all components of the water cycle from precipitation and evaporation to water flow through rivers, wetlands and groundwater.

"Water drives the movement of contaminants, so we need to understand how water is moving through these agricultural landscapes to determine where excess nutrients are entering waterways and quantify their concentration," she says. "Knowing this can help identify where to focus management strategies for problematic algae blooms."

Mangal—who has extensive experience looking at algae biomarkers, contaminant cycling and —and Biagi are currently doing fieldwork at the Wignell Drain in Port Colborne as part of a study on factors contributing to algae blooms.

This year's rain has made algae blooms more sporadic, whereas the summer of 2022 was hot and dry. This led to one big algae bloom in 2022 that later subsided, he says.

Recent research in southern Ontario shows that large rain and snowmelt events lead to some of the largest nutrient inputs to waterways.

"Climate change is expected to increase the severity and frequency of storms, which will likely enhance the movement of excess nutrients to waterways, and subsequent harmful  will only continue to increase over time," Biagi says.

When algae die, the bacterial decomposition uses up oxygen from water that fish need to breathe. The decaying algae become slimy and odorous while removing oxygen from the water, ultimately shutting down the ecosystem.

Mangal suggests municipal governments should begin to regulate fertilizer use and continue to explore alternatives to traditional synthetic fertilizers that wash from land to water.

"If we don't begin to regulate fertilizer use and the amount of nutrients going across the terrestrial, aquatic interface, conditions for  growth will continue," he says.

Mangal has conducted algae research in Hamilton Harbor, Bay of Quinte, Port Colborne and Dryden, Ont., as well as Churchill, Man.

Biagi's research into how human disturbances impact water quality has focused on southern Ontario, Nova Scotia and the Athabasca oil sands region in Alberta.

Provided by Brock University 

Long and slow, or fast and furious: The clever way blue-green algae hedge their bets in blooms


Is flood pollution causing turtle strandings? Researchers look for answers in their cell response

turtle
Credit: Unsplash/CC0 Public Domain

Last year was a grim season for sea turtles in Queensland's Wide Bay-Burnett region with more than 10 times the usual number of sick and dying animals, including over 100 turtles, pulled from the water.

The Australian Rivers Institute Toxicology Research Group (ARI-TOX) is investigating the potential role that  had on the elevated green turtle strandings on the Fraser Coast following the major flooding events in early 2022.

"At this stage, we don't know if these strandings were related to disease, parasites, changes to quantity and quality of food sources, , or a combination of multiple factors," said ARI-TOX  and eco-toxicologist Dr. Jason van de Merwe.

"During large flooding events, chemical pollutants, such as pesticides and industrial chemicals, are often washed into , where they can then accumulate in the resident .

"Many of these chemicals have known effects on humans and other animals, so we are looking into if and how they're contributing to the observed elevated strandings of green turtles."

Researchers at ARI-TOX collaborated with the Queensland Department of Environment and Science to capture  foraging in the waters of Hervey Bay adjacent to pollution sources in river mouths and urban outflows, while also assessing turtles in the eastern bay areas, further away from potential pollution sources.

The  and demographics of the green turtle population were recorded during these sampling events, including size and age, indicators of health and body condition, and breeding status.

Blood samples were also collected from each turtle for investigations into health and toxicology, the latter to be performed by ARI-TOX researchers.

"Full credit must be given to the Australian Government and the Queensland Department of Environment and Science for initiating such a swift and comprehensive investigation into the potential impacts of the 2022 floods on the health of marine wildlife," Dr. van de Merwe said.

"They did a great job in assembling a multi-disciplinary team of sea turtle experts, wildlife veterinarians, pathologists and toxicologists. As toxicologists, our role in this project is to determine the amount and types of metals and organic contaminants found in these sea turtles, and investigate whether there are any links to the health and demographic data collected.

"We measure metals using well established analytical techniques, however, due to the vast array of organic pollutants that are found in the , we measure the toxicity of the specific mixture of organic contaminants extracted from each individual turtle sampled, using a cell-based test.

"To test the combination of contaminants that the turtles accumulate, we concentrate the mixture of  found in a sea turtle blood sample, perform a series of dilutions of this concentrate, and, using a novel sea turtle specific cell-based toxicity assay, expose sea turtle cell cultures from ARITOX's Marine Wildlife Cell Bank to this concentration gradient.

"These assays will allow us to understand if the level of pollutants currently found inside the turtles is toxic to their cells, and if not, how much it has to increase to cause a toxic response."

In a separate component of the project investigating the impacts of flooding on marine wildlife, the ARI-TOX team are also collaborating with Sea World and other wildlife hospitals to measure the chemical contamination of sea turtles, dolphins and dugongs that are currently being stranded in South East Queensland.

"The goal of this aspect of research is to again determine what the potential role of chemical pollution is in causing the elevated levels of marine wildlife strandings we have been seeing in the region in recent years," Dr. van de Merwe said.


Why beaver-like dams can protect communities from flooding

Why beaver-like dams can protect communities from flooding—new research
A beaver-like dam at Wilde Brook on the Corve catchment in Shropshire. Credit: Daniel Jones, Author provided

Low cost, human-made river barriers, similar to those built by beavers, can protect communities at risk of flooding.Our new research has found that such  intentionally increase  upstream to slow down river flow.

 These  barriers are made of materials like logs, branches, mud and leaves. They reduce downstream water levels by deliberately blocking the river and storing the water. They then slow down the river flow during a storm.

Using natural processes to temporarily store water above and below ground is called natural flood management. It essentially involves using nature as a sponge to soak up rainwater.

Not only does this protect communities further down the river from flooding, but it has other benefits too. It helps to enhance habitat diversity for river insects and animals, trap pollutants, and enhance the supply of sediment to the floodplain.

It also adds resilience to the river during spells of dry and hot weather by preventing it from drying up entirely. That was a big issue during the summer of 2022, which was the UK's warmest on record.

Until our recent research, very little data existed on how effective such river barriers are, or how such approaches might best be used. We also did not understand how these beaver-like dams operate during big storms.

Slowing the flow

The presence of a tree trunk or similar obstacle in a river will disrupt its flow. But the exact extent to which the  was slowed down by one , let alone 50 to 100 barriers, was unknown. We also did not understand how the flow changed for different types of storms and different river settings.

The theoretical idea of a natural barrier is that they have a big hole at the bottom for everyday river flows, as well as holes in between the logs and branches in the upper part of the barrier where the water slowly flows through after a small storm.

During , the water level gets higher and flows over the top of the barrier.

Why beaver-like dams can protect communities from flooding—new research
Beavers are natural engineers and make dams by using their teeth to cut trees and 
branches. Credit: Mark A. Rice/Shutterstock

We found that the barrier's holes can become bigger due to the changing flow of the river. In addition, during a storm, the twigs, leaves and sediment transported by the  can accumulate behind the barrier, causing it to grow in size. So, we needed to understand how these natural barriers evolve over time to understand the range of their effectiveness.

Engineers use computer models called "flood models" which use mathematical equations to predict how different storm sizes impact on river water levels. These help us predict when a river will burst its banks, and then the location and extent of a flooded area.

This is important as it helps governments decide on what type of flood defense is needed to protect people from existing and future flooding. It also helps to determine where new buildings can be constructed that will be safe from flooding, and that such new builds will not make existing houses more vulnerable to floods.

The Corve catchment in Shropshire

We gathered data from 105 natural flood barriers on a small Shropshire river to measure their effectiveness in holding back flood waters and to understand how natural flood barriers operate during a . We collected water levels, velocity and flow data every 15 minutes for a two year period.

We also used a technique called "photogrammetry". This is where data from drone photographs are used to obtain accurate measurements of the topography in areas of river covered by trees and other vegetation.

Our results showed that the natural flood barriers at the site could store enough water to fill at least four Olympic-sized swimming pools during significant storms such as Storm Dennis, which hit the UK in February 2020.

This shows that natural barriers are effective in slowing down the flow of the river during periods of rainfall, storing up vast quantities of water which would otherwise rush through, causing damage to areas downstream. Instead, this force is slowly released over a period of one to two weeks.

Our research shows that natural flood management works. It is also cheaper than traditional engineering works and complements rather than replaces existing flood defenses.

The information from our study will help natural barriers be more accurately represented in flood models, using our new observations on  changes over time and effectiveness during storms.

Society can get better value from our flood defense spending by supporting landowners to install natural solutions. This is increasingly an issue as more and more houses are being built on land at risk of flooding.

This article is republished from The Conversation under a Creative Commons license. Read the original article.The Conversation


Beaver-like dams can enhance existing flood management strategies for at-risk communities, study finds


Seine pollution forces cancelation of third Olympics test event

The starting line for the 2023 World Triathlon pre-Olympics test event floating on the Seine River in Paris
The starting line for the 2023 World Triathlon pre-Olympics test event floating on the Seine River
 in Paris.

The swimming stage of a triathlon in Paris's Seine River was canceled on Sunday due to pollution, organizers announced, raising further questions about holding competitions there during the 2024 Olympics.

The mixed relay triathlon is the third pre-Olympics test event to be affected by excessive E. coli bacteria in the , but organizers insist the Seine will be fit to host events next year.

The triathlon was changed to a duathlon only involving cycling and running after analyzes of the water quality did not offer the "necessary guarantees," said the Paris Olympics organizing committee and governing body World Triathlon.

The same solution was reached for a para-triathlon test event on Saturday, while the World Aquatics Open Water Swimming World Cup was canceled altogether earlier this month.

As organizers investigated the source of Saturday's elevated E. coli readings Tony Estanguet, the head of the Paris 2024 organizing committee, stressed there was no "Plan B" for next year's sporting extravaganza.

"There is no solution to move the event, the triathlon and open water swimming will be held in the Seine next year," he insisted.

"From the start, we have remained on the same project, to organize the triathlon and para-triathlon in this extraordinary site. You have a beautiful setting between the Grand Palais, the Invalides, this Alexandre III bridge. This course, I believe, is unanimous."

The cause of this impasse in the Seine remains the same: the concentration of Escherichia Coli (E. coli) bacteria in the river.

Storms, causing  leading to overflowing sewers spilling into the river, are not the cause, officials insist.

"An investigation is underway to find the cause of this degradation but, to date, we have not yet found an explanation," Pierre Rabadan, deputy mayor of Paris in charge of Sport and the Olympics told AFP.

"We missed out by very little," said French sports minister Amelie Oudea-Castera.

"It's extremely encouraging, you have to see the glass half full. I repeat, we will be ready."

Athletes dive into the Seine River on Friday for the men's 2023 World Triathlon pre-Olympic test event
Athletes dive into the Seine River on Friday for the men's 2023 World Triathlon pre-Olympic
 test event.

"Still being developed'

A triathlon has never been converted into a duathlon at the Olympics since its introduction at the 2000 Sydney Games.

"It would be a shame but we adapted to a duathlon this morning," said Beth Potter, winner of the women's race on Thursday and second in Sunday's mixed relay with the British team.

"Hopefully by next year it will be okay. We saw that for the individual races it was okay, so hopefully it will be a triathlon."

Britain's Alex Yee, winner of the men's race, added, "They are saying the water filtering is still being developed. So by next year it will be perfect.

"What they are doing is hugely historic, they are leaving a legacy after the Games. We can only applaud them."

Local authorities are working to correct some 23,000 poor connections in private homes whose wastewater ends up in the river.

"We are a quarter of the way there," said Oudea-Castera.

French world champion Leo Bergere said he had not "heard that athletes had come out sick" from the men's race on Friday, the day on which the first below standard samples were taken.

"The objective was to make the Seine swimmable in 2024," added Estanguet.

"This test comes along the way, the plan has not reached maturity. There are still great efforts, new means being deployed to improve the quality of the water in the Seine. As we have seen, it is improving month by month and will continue to improve."

Olympic open water swimming has frequently been hit by pollution concerns.

At the end of the test event in 2019 ahead of the Tokyo Olympics, swimmers protested against the quality of the water in Tokyo Bay.

At the Rio Olympics in 2016, the prospect of swimming in the polluted Guanabara Bay also made headlines.

© 2023 AFP

Paris Olympics swimming test event in Seine canceled due to pollution


Civilian support for military coups is rising in parts of Africa. Research explains why

Civilian support for military coups is rising in parts of Africa—research explains why
The clamour for coups among citizens is rising. Credit: Wikimedia Commons

On the night of 13 January 1963, Togo's President Sylvanus Olympio was shot dead by rebels in the first military coup staged in Africa. A long list, as shown below, was to come. From the 1960s to the end of the millennium, there were an average of four military coups a year on the continent. By the end of the 1990s this phenomenon seemed to have faded away.

But since August 2020 six African nations have suffered seven coups or attempted coups.

First came Mali, in August 2020. The military took advantage of social unrest and insecurity caused by the activities of violent extremists. Mali had two coups or attempts in a nine-month span.

In April 2021, Chad followed the same path. In March 2021, there was a coup attempt in Niger, and in September 2021 it was Guinea's turn. A month later, it was Sudan. In Burkina Faso, an attack in November 2021 led to the coup in January 2022.

More recently, a coup was launched in Niger, deposing President Mohamed Bazoum. Two days later, General Abdourahamane Tchiani declared himself the leader of Niger.

All together, that's more than 100 million people being ruled by the military after power was seized violently. All are in the Sahel. This has alerted governments in the region.

Researchers, analysts and journalists have pointed to mismanagement, incompetence, corruption,  and state weakness as the main factors propelling military coups all over the world and, of course, in Africa. State weakness is a factor in the recent instances in Africa. They have happened partly because of governments' failure to stem the spread of groups linked to Al Qaeda and the Islamic State all over the Sahel.

But there are two intertwined characteristics that differentiate Africa from the rest of the world. One is the public support of many citizens on the streets when there is a coup. The other is the society's rising support for military rule as a form of government. Popular support for military rule has grown in the last 20 years.

My research explored the reasons for this. I used  to examine whether support for nondemocratic rule was mainly due to poor institutional and  or to an existing so-called authoritarian personality and culture in the region. This type of personality refers to values existing in certain societies that make them more prone to embrace authoritarian forms of government.

This distinction is relevant because if the reason for military rule support is cultural, then societies will continue to endorse authoritarian regimes. If the reason is institutional performance, then as long as incumbent governments perform efficiently, both politically and economically, democratic support will overcome authoritarian support.

Citizen discontent

I carried out a  using Afrobarometer survey data gathered from 37 African countries, both from North Africa and Sub-Saharan Africa. The analysis looked for underlying factors propelling the rise in support for military rule.

Respondents were asked about the extent of their support for military rule as a form of government plus a number of other potential explanatory questions such as perception of corruption, governing and opposition parties performance, economy evaluation and socio-demographic issues like their level of education.

The data shows that from 2000 to the present, the level of support for military rule as a form of government has doubled, from 11.6% of people supporting "much" or "very much" military rule as a form of government to 22.3%. Of the 37 countries analyzed, there were 11 where support for military dictatorship was decreasing and 26 where this figure was on the rise. The latest Afrobarometer data shows that support for democracy has fallen in the last year. Out of 38 countries, only four show decreasing support for military rule since 2000, whereas 34 show higher support for higher military rule than in 2000.

Support for military rule was higher in "partly free" and "not free" countries than in "free" countries. (They were categorized according to the Freedom House index.)

But there were some exceptions. In South Africa, which is a constitutional democracy with regular elections, one in three South Africans supported military rule as a form of government. In democratic Namibia the level of support showed that one in four Namibians supported military rule.

Reasons to support military rule

The analysis points to three conclusions:

  • In sub-Saharan Africa, the legitimacy of military rule is mainly based on institutional performance and economic management. These are weakened by jihadist organizations rapidly expanding throughout the region. State institutions are not able to tackle their expansion throughout the region.
  • In North Africa, institutional performance plays a role but authoritarian personality plays a larger role in the support for military rule.
  • Education seems to be an antidote against authoritarianism. Those with higher level of education, according to survey data, show higher level of democratic endorsement.

The study's findings suggest that people in sub-Saharan Africa are fed up with their governments for many reasons, including security threats, humanitarian disasters and lack of prospects. Waiting for the next elections to take place to change government does not seem to them to be a good option. Opposition parties do not seem to enjoy a better image. For the survey respondents, the solution appears to be to welcome the military to intervene.

If citizens perceive that politicians don't care about them, this will invite the military to continue overthrowing civil governments, with society publicly legitimizing their intervention in politics.

If military, political and economic solutions are not found, military coups in the region will increase and people will continue gathering on the streets to welcome them. Niger's recent coup may not be the last one.

This article is republished from The Conversation under a Creative Commons license. Read the original article.The Conversation


Does U.S. military training incubate coups in Africa? The jury is still out


Research measures global impact of ant invasions on native species

Ant invasions cause species loss through predation and competition
Local richness responses of ants and invertebrate communities to non-native ants. The 
number of studies for each taxon is in parentheses by taxon labels. Solid dots with black 
bars represent the overall standardized mean difference (Hedges' g) and 95% confidence 
intervals, respectively. Translucent circles represent individual taxon responses. The size
 of each circle is proportional to its relative weighting in the overall model and the inverse of
 its variance. A positive effect size means that invasive ants are reducing taxon richness. 
The position on the y-axis ("intercept") ensures that points are visible and do not overlap 
and is also determined by the taxonomic grouping variable. Several studies with very high
 effect sizes (>5) and taxa with fewer than five studies were omitted from the plot to aid 
visualization of the remaining data. 
Credit: Insect Conservation and Diversity (2023). DOI: 10.1111/icad.12672

New research by Cardiff University has measured the impact of ant invasions on native species at a global scale for the first time, finding that the introduction of invasive ants into new environments can reduce species numbers by 53% through competition and predation.

Ants play an important role in helping to maintain stable ecosystems, but some  of ants have been transported by humans globally and can cause major problems, even contributing to the extinction of some animal species.

The introduction of invasive ant species into habitats around the world through human activities, such as international commerce, has led to non-native ants establishing colonies in various habitats worldwide. Most research studying these populations show that invasive ants can lower native species diversity, probably through predation and competition.

Invasive ants possess adaptations that allow them to dominate most native ant species. This includes being able to eat a wide and general diet, as well as forming supercolonies—interconnected nests consisting of multiple queens and that can spread over large areas.

Dr. Maximillian Tercel, Cardiff University's School of Biosciences, said, "Ants are ecologically important social insects, helping to maintain key ecosystem functions. They participate in a wide range of species interactions, such as acting as predators, parasites, herbivores, granivores, prey, mutualists and hosts, across almost all terrestrial environments and all continents except Antarctica.

"But this means, through human transportation around the world, we have introduced different non-native species of ants into new areas—this can cause a lot of problems for the ecosystems and biodiversity in that area. Invasive ants are generally expected to lower  diversity by predation and competition.

"However,  show that the effect of invasive ants might vary depending on where they invade and between different groups of animals. For example, birds might react badly to invasive ants but mammals or some insect groups may not react as badly—but this hasn't been measured until now.

"Ant invasions appear to be a really important element to consider when trying to conserve native biodiversity in many areas around the world, so we aimed to estimate the effect of invasive ants on animal community biodiversity for the first time."

The researchers extracted data from 46 published articles investigating the responses of animals to ant invasion in areas relatively unimpacted by other stressors, such as human disturbance. They focused on the impacts on the abundance and richness of species in those locations after ant invasions.

The Cardiff scientists calculated that an ant invasion reduces the total number of animal individuals in that location by 42% and reduces the number of species by 53% on average.

"This is a huge reduction in the diversity of animal communities and suggests that invasive ants can pose serious problems for the health of ecosystems in which they invade.

"These findings show that we urgently need to improve international prevention processes, early detection systems, and well-designed control strategies for ," added Dr. Tercel.

The research, "Non-native ants drive dramatic declines in animal community diversity: A ," was published in Insect Conservation and Diversity.

More information: Maximillian P. T. G. Tercel et al, Non‐native ants drive dramatic declines in animal community diversity: A meta‐analysis, Insect Conservation and Diversity (2023). DOI: 10.1111/icad.12672

An aid to ecological management and ecosystem services supply and demand dynamics

An aid to ecological management and decision-making ES supply and demand dynamics
Location of TLB in the Yangtze River Delta in China. Credit: Circular Agricultural Systems

Ecosystem services (ESs) provide a variety of services and benefits for human well-being, but the supply-demand mechanism of ecosystem services under different spatio-temporal scales is unclear.

The Taihu Lake Basin (TLB) is a microcosm of degraded and unsustainable . Rapid industrialization and urbanization poses a great threat to the environment and ecology. Therefore, it is urgent to assess the changes in supply and demand for TLB ecosystem services from a spatio-temporal and multi-stakeholder perspective, and this will be conducive to the scientific and sustainable development of ecological services.

Circular Agricultural Systems published an online paper, entitled "Quantifying the difference between supply and demand of ecosystem services at different spatial-temporal scales: A case study of the Taihu Lake Basin," on 31 May 2023.

In this study, the InVEST model was used to quantify the dynamics of ESs supply and demand in the TLB from 2010–2020, and compared the mismatch between supply and demand for five ESs (i.e., water yield, carbon sequestration, recreation, food production, and heat regulation services) at four spatial scales (pixel scale, township scale, county scale, and city scale).

The study highlights the increasing quantitative and spatial differences in the supply and demand of environmental services in the TLB, in particular the conflict between  services and heat regulation services, which has become a major constraint to the development of environmental services.

However, there is a demand gap for water yield services and food production services. Evaluations of ecosystem service deficit and redundancy (ESDR) indicate that significant deficits are mainly in densely populated towns of the eastern and central regions, while high surplus areas are mainly in the  in the southwest.

Comprehensive ecosystem service deficit and redundancy (CESDR) metrics showed a decline from -0.03 in 2010 to -0.05 in 2020, among which  like Shanghai and Suzhou reflect pronounced imbalances. The data underscores the urgency for focused policy interventions in regions with high deficit.

In conclusion, this study analyzes the quantitative characteristics and spatial-temporal pattern of the relationship between the supply and demand of ESs in TLB at different scales. It emphasizes that a multi-scale analytical approach should be adopted in policy formulation to achieve a balance between supply and demand through reasonable ecological protection and ecological restoration.

More information: Wei Yang et al, Quantifying the difference between supply and demand of ecosystem services at different spatial-temporal scales: A case study of the Taihu Lake Basin, Circular Agricultural Systems (2023). DOI: 10.48130/CAS-2023-0005


Provided by Maximum Academic PressEcological restoration for sustainable development in China


France sizzles in late summer 'heat dome'

A man jogs along the docks at sunrise to avoid the heat, in Bordeaux, southwestern France.

Millions of people in France sweated through a late summer heat wave on Monday, with record temperatures expected in the wine-growing Rhone valley region and a forest fire blazing in the southeast.

Temperatures are expected to peak on Tuesday and Wednesday, with the most intense heat in the southern parts of the country where the mercury is already pushing past 40 degrees Celsius (104 Fahrenheit).

Health authorities have placed roughly half of the 96 departments in mainland France on the second-highest heat warning level, with some areas around the Rhone set to be placed in the maximum red category on Tuesday.

"Some records could be broken, notably on Tuesday in the Rhone valley with 40-42°C expected," national weather service Meteo France said.

The heat wave is "intense and long-lasting" and "particularly late in the season", it added, with a period of high pressure creating a "heat dome" over the country.

After a suffocating summer of record temperatures and forest fires in 2022, France had for the most part experienced a typical holiday period this year, escaping the intense heat that scorched southern Europe in July.

The current highs are the hottest of the season, Meteo France said.

Many people headed to municipal swimming pools, fountains or the beach to cool off.

"We went to the pool, so it was a cheap and easy way to fight the heat," Nathalie Chopin told AFP in the southeastern city of Lyon.

"It's very hot. Otherwise, we stay in our apartments, close the shutters and shut ourselves in."

Fire fears

After several weeks of dry weather, local authorities in the southern Gard area of France restricted access to forests due to the high risks of fires.

Around 260 firefighters were battling a wildfire near the village of Chanousse in the foothills of the Alps in southeast France, according to the Association for the Prevention and Reporting of Forest Fires.

It has consumed around 120 hectares (nearly 250 acres) of woodland, according to local authorities.

The high temperatures have also interfered with the scheduled re-starting of a nuclear power plant in Golfech in southwest France and could also lead to restrictions at a plant in Bugey in the Ain area, power group EDF said.

Heat waves frequently affect France's river-side nuclear power plants which suck in river water for cooling purposes before discharging it downstream.

They are forced to reduce their water usage during hot spells to guard against excessive warming of rivers which could affect local ecosystems.

The highest temperature ever recorded in France was 46C, registered in June 2018 in the village of Verargues in southern France.

Temperatures reached 35C in Bordeaux on Monday afternoon, while 37C was recorded in Lyon, Perpignan and Toulouse.

© 2023 AFP