U.S. Government Economic Statistics Show Endurance of Structural Racism

Photograph by Nathaniel St. Clair
U.S. government economic statistics that can be used to compare the conditions of the Black population with the white population provide a picture of the continuing deep seated structural racism in the United States. The statistics covering wealth and income distribution, poverty, and unemployment show how the functioning of capitalism and the operation of its institutions have continued to keep much of the Black population in an inferior economic position relative to the white population despite reforms that supposedly have increased opportunities and that have led to many Blacks occupying positions of power.
Wealth Inequality
One’s wealth is the value of what one currently possess minus one’s debts. Wealth inequality between whites and Blacks, especially if growing, is of great importance in bringing out the presence of structural racism.
Under capitalism, over time, wealth inequality usually grows. That has been especially true in the current neoliberal era. Federal Reserve Board figures show the increasing wealth inequality in the United States over the last three decades.[1] From the start of their survey in the third quarter of 1989 until the second quarter of 2023, the share of the nation’s wealth held by the wealthiest 1% of households increased from 22.5% to 31.4%. During the same period, the share of the poorest 90% declined from 40.1% to 31.1% while the poorest 50% saw their share of the nation’s wealth decline from 3.8% to 2.5%. The 2.5% represents a recovery from the great recession in 2008 when it fell below 1%.[2]
Recent Federal Reserve Board figures on mean, or average wealth, and median wealth, (the point at which half of the particular group has more and half has less), generally show the ongoing and increasing wealth inequality between white and Black families.[3]
Most striking are the changes in mean wealth. From 1989 until 2022, based on 2022-dollar values, the mean wealth of white families went up 261% from $524,410 to $1,367,170. For Blacks, mean wealth went from $95,530 to $211,450 for a 221% increase, widening the difference between Black and white family average wealth from $428,880 in 1989 to $1,155,720 in 2022.
From 1992 until 2022, the median wealth of white families, also based on 2022-dollar values, increased from $144,420 to $285,010 while that for Blacks went from $20,510 to $44,890. The rate of increase for Blacks was greater. However, the gap between white and Black median wealth widened from $123,910 to $240,120.
Below are tables using Federal Reserve Board figures on mean and median wealth that have been put together every three years starting in 1989. What is especially noteworthy with regard to mean wealth is both the general trend in the increasing size of wealth held by whites compared to the smaller amount held by Blacks, and the growth in how many times greater is white wealth compared to Black wealth even when the average wealth of Black and white households have both increased.
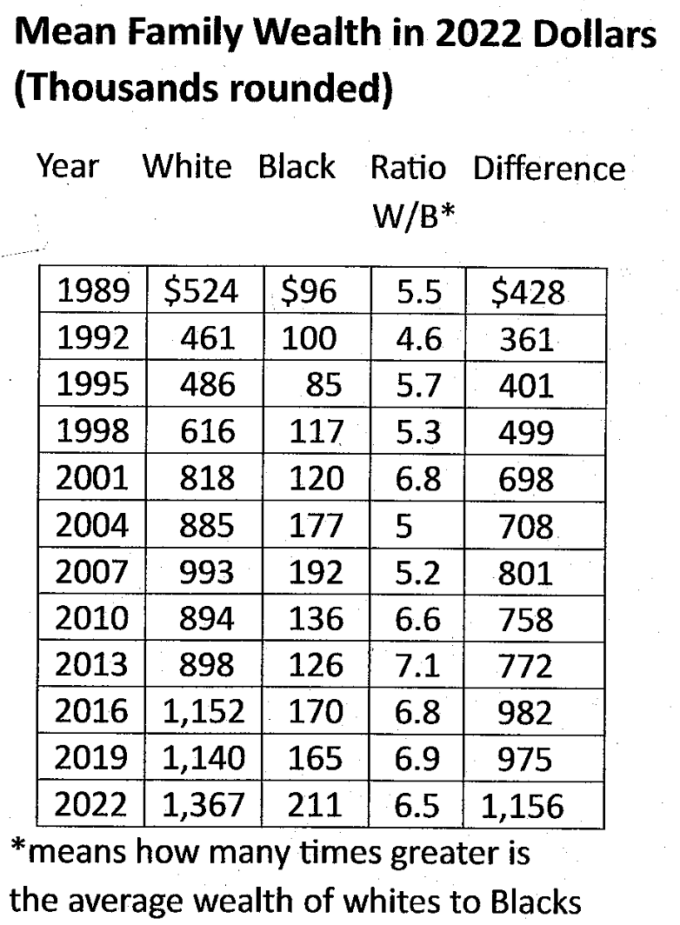

The Fed figures show that the Black population endured a greater percentage loss in average wealth during the great recession and took longer to recover. Not until 2022 did they exceed their 2007 average wealth while whites reached that level in 2016.
In terms of median wealth, following the great recession, both Blacks and whites took until 2022 to surpass their 2007 amounts, an indication of how the recession and growing inequality was presumably harshest on the working class and those with fewer resources. With the recovery, the difference in median wealth between whites and Blacks increased from $215,000 in 2007 to $240,000 in 2022.
The increases in average wealth give the appearance of many people being better off. That may be an illusion given the recent gains that have benefited the wealthiest the most. The gains in average wealth may not represent improvements for the less well-off but, instead, reflect the furthering of the class divide within both the Black and white populations.
What the tables don’t show is the quantitative and qualitative difference between the share of the country’s total wealth held by Blacks compared to what is held by whites.
As of the second quarter of 2023, the white share of the nation’s wealth (from drop down tables) came to 82% ($119.76 trillion) while the total Black share came to 4.5% ($6.53 trillion) which is significantly lower than their 13.6% of the nation’s population.[4] Since 1989, the share of the nation’s wealth held by Blacks has never reached half of their percent of the U.S. population, ranging from its highest point of 4.7% in 1992 to a low of 3.3% in 1999.[5]
The wealth holdings of Blacks and whites are different. As of the middle of 2023, the white share of the country’s corporate equities and mutual funds stood at 88.9% ($33.8 trillion) while the Black share was 1.1% ($.42 trillion). These assets are generally liquid meaning, unlike many other assets such as real estate, they can more easily and quickly be converted into cash.
The difference between Black and white holdings of real estate are not as great as the differences in the holdings of corporate equites and mutual funds. The white share of the nation’s real estate is 74.3% ($33.06 trillion) to the Black share of 6.2% ($2.75 trillion). However, Black real estate holdings are more encumbered by greater home mortgage debt ($.9 trillion which is 32.7% of the value of their real estate) compared to real estate held by whites ($9.18 trillion home mortgage debt, 27.8% of the value of their real estate). Factoring in mortgage debt, real estate represents a larger share of Black wealth, 28.3%, compared to that for whites, 19.9%.
There are other forms of real estate inequality. As of 2022, the rate of homeownership by whites is 73.15% compared to the Black rate of 46.34%. The net home value at figure 6 for a typical family owned home in 2022 for whites stood at $205,370 compared to $123,000 for Blacks.[6]
Wealth Inequality Among Black and White Billionaires!
Between Black and white billionaires, there is great billionaire inequality!! In 2023, of the 735 billionaires in the United States, only nine are Black.[7] Their wealth together came to $25.4 billion. Compare that to the wealth of a single white individual, Elon Musk, whose wealth is currently over $200 billion, about eight times the total wealth of the nine Black billionaires. Their combined wealth is dwarfed by the wealth of each of the nine wealthiest U.S. billionaires, each of whom is worth more than $100 billion.[8] Additionally, the total wealth of the nine wealthiest is close to one-fifth of all Black wealth of $6.53 trillion (as of the end of the second quarter of 2023).
Income[9]
Income refers to the amount of money brought in during a given period of time (usually a year). For most people, the primary source of their income comes from payment for work or from a pension earned from working. For rich people, the bulk of their income is more likely to come from investments in the forms of interest, dividends, capital gains, and rent.
Over the years, the dollar difference in white income compared to Black income has generally been growing. According to Federal Reserve report at figure 7, from 2019-2022, the wages and salaries of white families increased 6.16% while for Blacks, they were stagnant, declining by .03%.[10] Growth of all income during this period was 6.9% for Blacks and 16.05% for whites furthering inequality between whites and Blacks.
Census Bureau tables on household income cover the mean and median amounts. The figures show how income inequality between Blacks and whites has tended to be increasing before dipping in 2022. Here are the table A-2 amounts from a few selected years in 2022 dollars.[11]

Is the difference in income between whites and Blacks a result of whites tending to be better educated which results in higher incomes? In recent years, the Bureau of Labor Statistics (BLS) has been providing figures that show the variation in median weekly income by race when people have a similar education level. Over many years, the median income level for whites at all education levels is higher than that of Blacks. In the years randomly selected, in most categories, the difference in median weekly pay for whites compared to Blacks, over time, has gone up. The exceptions are small amounts.
Below is a table based on BLS table 17 or 16 over the cited years showing the differences for whites and Blacks.[12]

As with all statistics, there are limitations to what they show. The above table is not completely definitive. For those who went to college, the table does not show the college people attended nor the fields they studied which can impact one’s level of pay. For example, not shown is if whites attended more prestigious colleges and/or went into fields that pay better. However, the unequal results are persistent and are consistent with many other unequal results.
Poverty
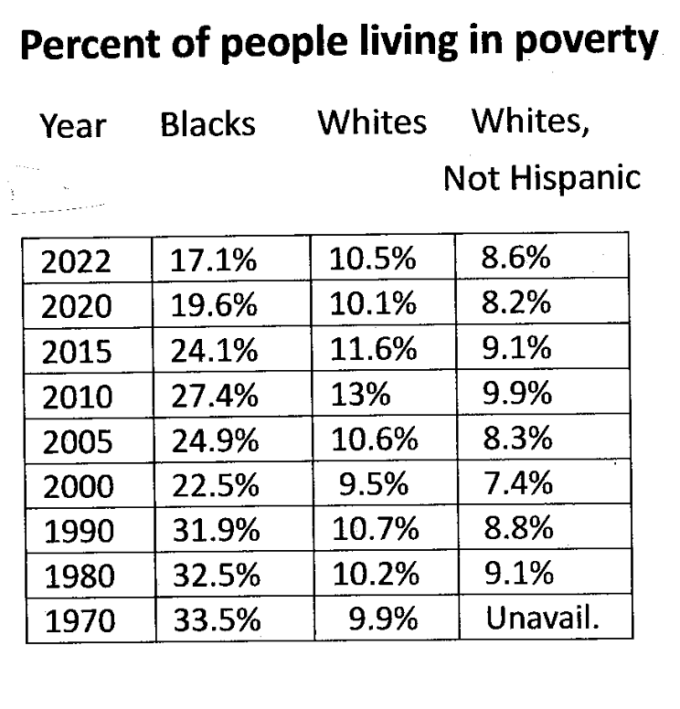
Presumably, ever since such statistics were being gathered, more whites than Blacks living in the United States are deemed to be poor. That is because whites constitute a much larger share of the country’s population. However, and of critical importance, the rate of poverty for Blacks has always been much greater than the rate for whites.
2022 is no different. The government official figures at Table A-3 placed the number of impoverished Blacks at 7.6 million compared to 26 million whites and 16.7 million whites who are not Hispanic.[13] The Black rate of poverty was 17.1% compared to the white, not Hispanic rate of 8.6% and rate of 10.5% for all whites.
Below is from the table at A-3 that covers selective years. It shows a decline in the Black poverty rate, but it has remained significantly higher than the rate for whites.
Additionally, in 2022, this same census bureau report at table B-6 shows another form of inequality. That year, the poverty income threshold was $15,225 for a single person under 65 years old and $29,678 for two adults with two children. 8.4% of the Black population had incomes below one-half that income threshold compared to 4.9% of whites, and 4.2% for whites who are not Hispanic.
Another measure provided in table B-6 shows how many have an income level that is four times or higher than the poverty income threshold. Here, Blacks compared to whites are worse off. In 2022, 29.1% of Blacks exceeded the threshold while the white figure is 44.6%, and the white not Hispanic figure is 49.9%.
Unemployment
The Black unemployment rate has usually been close to or more than twice the rate for whites. For example, before Covid, in 2019, the rate of Black unemployment was 6.1% to 3.3% for whites. Job prospects have improved for Blacks. Nevertheless, compared to whites, a higher percent of Blacks remain unemployed.
Below are unemployment figures by race derived from the U.S. Bureau of Labor Statistics table 12 figures that show the ongoing higher rate of unemployment for the Black population compared to whites.[14]

Conclusion
Much attention is rightfully devoted to the racism behind voter suppression, unequal health coverage and its negative consequences, the workings of the criminal justice and prison system, and police murders such as that of George Floyd. Behind these issues is the continuation of a system of significant racial economic inequality as brought out in official government figures.
Those with power, by their actions or lack of actions, have repeatedly accepted the conditions that give rise to significant economic inequality, showing their support for the continuation of structural racism.
Notes.
[1] Figures found at https://www.federalreserve.gov/
[2] My focus is on the Black and white economic divide. Of critical importance are class divisions not being addressed. The poorest 50% are predominantly members of the working class as is most of the poorest 90%. The working class can be defined as being separated from the means of production such that they lack an independent means to support themselves and are forced to sell their ability to work for a wage or salary to pay for the needs that sustain their lives. Additionally, members of the working class labor in positions in which they do not supervise others. A larger percentage of the Black population than the white population is presumed to be in the working class.
[3] Tables and all figures used in this section found by clicking accessible version
https://www.federalreserve.gov/
[4] https://www.census.gov/quickfacts/fact/table/US/PST045222
[5] Use the drop-down menu distribute by race to access figures https://www.federalreserve.gov/releases/z1/dataviz/dfa/distribute/table/
[6] https://www.federalreserve.gov/econres/notes/feds-notes/greater-wealth-greater-uncertainty-changes-in-racial-inequality-in-the-survey-of-consumer-finances-20231018.html
[7] https://ncrc.org/the-racial-wealth-divide-and-us-black-billionaires/
[8] https://www.bloomberg.com/billionaires/
[9] Generally, more attention is paid to income rather than wealth. For example, in many college level American Government textbooks, the way income is distributed might be briefly discussed. With few exceptions, the topic of wealth and how it is distributed is not covered. This troubling omission suggests that wealth inequality has no impact on the exercise of power in the United States political system!
[10] https://www.federalreserve.gov/econres/notes/feds-notes/greater-wealth-greater-uncertainty-changes-in-racial-inequality-in-the-survey-of-consumer-finances-20231018.html
[11] https://www.census.gov/content/dam/Census/library/publications/2023/demo/p60-279.pdf
[12] https://www.bls.gov/opub/reports/race-and-ethnicity/2022/home.htm
For years before 2022, substitute the year for 2022.
[13] https://www.census.gov/content/dam/Census/library/publications/2023/demo/p60-280.pdf
[14] https://www.bls.gov/opub/reports/race-and-ethnicity/2022/home.htm#:~:text=The%20unemployment%20rate%20averaged%208.6,and%204.7%20percent%20for%20Whites
