Tuesday, April 16, 2024


New radar analysis method can improve winter river safety
New radar analysis method can improve winter river safety
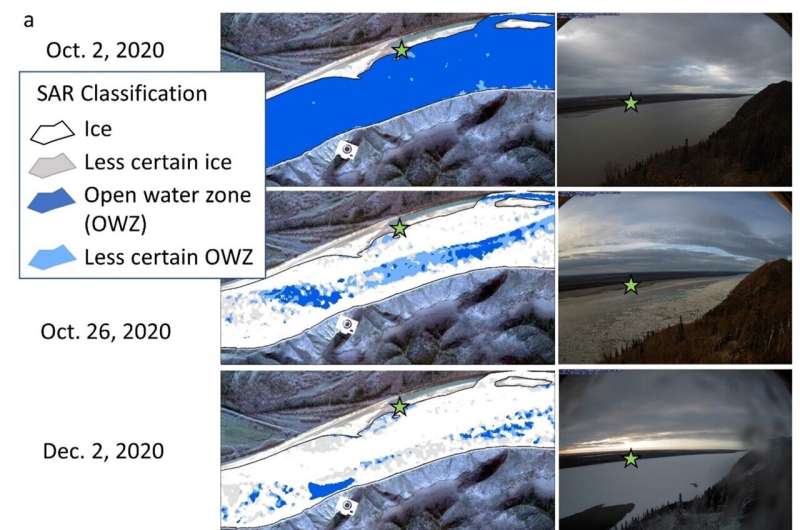
Panel a shows the Yukon R. at Paimiut with SAR classification and shore-based camera
 for four dates, and panel b shows the Tanana River at Sam Charley Island, about 20 river 
km SW of Fairbanks with shore-based camera image on top row and SAR classification 
on bottom row. Camera icons indicate location of shore-based camera and green stars are
 in the same location in the vertical SAR-classification and the oblique photos. Background
 image in panel a is Planet Oct 14, 2020; in panel b is Planet Oct. 10, 2020.
 Credit: Remote Sensing of Environment (2024). DOI: 10.1016/j.rse.2024.114096

University of Alaska Fairbanks researchers have developed a way to use radar to detect open water zones and other changes in Alaska's frozen rivers in the early winter. The approach can be automated to provide current hazard maps and is applicable across the Arctic and sub-Arctic.

Many Alaskans, especially in rural parts of the state, use rivers as wintertime ice highways to travel between communities or for recreation, hunting and fishing. Open  zones in river ice can be dangerous.

The new method is detailed in a paper published March 13 in the journal Remote Sensing of Environment.

Remote sensing scientist Melanie Engram of the Water and Environmental Research Center at the UAF Institute of Northern Engineering led the research.

Co-authors include Franz Meyer of the UAF Geophysical Institute; Dana Brown, Sarah Clement and Katie Spellman of the UAF International Arctic Research Center; and Allen Bondurant, Laura Oxtoby and Christopher Arp of the Water and Environmental Research Center.

"Arctic warming has changed the ways rivers freeze and has impacted rural winter river travel due to later freeze-ups, mid-winter open water zones and earlier breakups," the authors write.

Prior research by others focused on just one or two river reaches in Canada and temperate climates in Lithuania.

Engram and her UAF colleagues used  data from 12 reaches on eight Alaska rivers to create a river ice classification system that can be used in northern high-latitudes from October through January. The time period concludes with January because river users have usually shared open water locations by then. River ice also becomes more complex later in the winter. Other SAR-based river ice classifications focus on spring ice during breakup.

"This can be customized and automated for any northern latitude rivers to provide current open water zone maps," Engram said. "It's not designed just for Alaska."

Synthetic aperture radar can penetrate clouds and other atmospheric conditions such as haze, fog and rain. This is because SAR operates in the microwave portion of the electromagnetic spectrum, which has longer wavelengths than visible light.

SAR technology is widely used for environmental monitoring, agriculture, disaster management and defense.
New radar analysis method can improve winter river safety
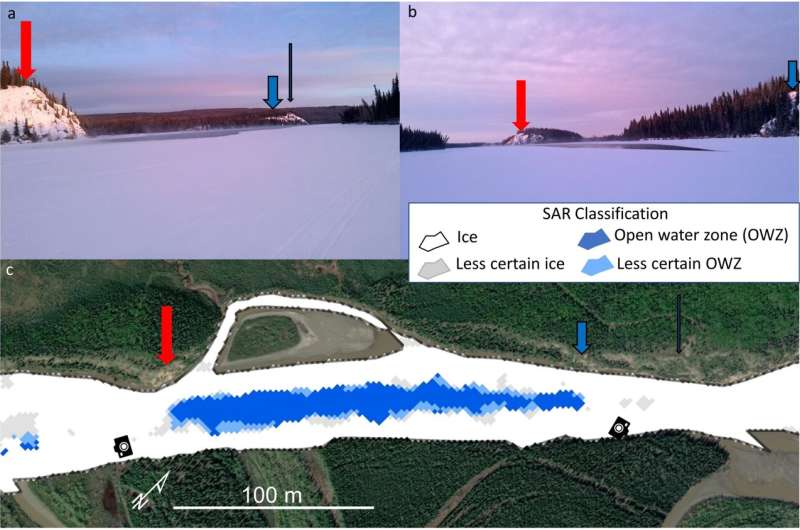
Citizen science photos uploaded to the Fresh Eyes on Ice Observer showing a large
 OWZ still unfrozen on Dec. 20, 2020 on the Tanana R. near the Rosie Creek Trail. 
Credit: Remote Sensing of Environment (2024). DOI: 10.1016/j.rse.2024.114096

Engram and the team refined and validated their data processing to reduce the classifications to four: ice, open water, less certain ice and less certain open water. To do this, they worked with two types of radar data: vertical-vertical and vertical-horizontal.

For vertical-vertical, the electromagnetic wave of both the transmitted and returned radar beam has peaks and valleys, similar to the rise and fall of ocean waves.

For vertical-horizontal, the transmitted electromagnetic wave is like the ocean waves, but the wave returning from the targeted object is oriented side-to-side, similar to how a snake moves.

That's important because the different combinations can reveal different data features.

Data is also influenced by the angle at which the radar beam itself is aimed at a target. Different angles can provide different perspectives and, therefore, different information.

Engram used data from the European Space Agency's Sentinel-1 satellite. This data is archived at UAF's Alaska Satellite Facility.

The researchers then compared the SAR data with aerial photos, the field of view of dozens of shore-based cameras, , on-ice observations and reports from community members who uploaded observations to the observer portal.

"We had shore-based cameras all over the state, and they took a picture of the river every day," Engram said. "And we consulted with communities, asking "What's important to you?'"

Engram chose sections of eight rivers: the Colville, Noatak, Tanana, Yukon, Kantishna, Innoko, Copper and Kuskokwim, listed here in descending order of latitude.

The team selected locations with different river volumes, widths, channel types and glacial silt content. They also chose locations in both tundra and boreal forest, as well as with variations in nearby permafrost conditions.

"With this ice classification, we're trying to distinguish between ice and open holes in the ice," Engram said. "A lot of studies have been done, especially in Canada, looking at different types of ice. We didn't do that. We just went ice versus open water."

Engram praised the Alaska Satellite Facility, which hosts the data.

"We're really fortunate in that scientists have access to that data, not just at the University of Alaska Fairbanks, but worldwide," she said. "The Alaska Satellite Facility has made SAR data much more usable for any type of scientist. You don't have to be a SAR specialist."

More information: Melanie Engram et al, Detecting early winter open-water zones on Alaska rivers using dual-polarized C-band Sentinel-1 synthetic aperture radar (SAR), Remote Sensing of Environment (2024). DOI: 10.1016/j.rse.2024.114096

New technique uses radar to gauge methane release from Arctic lakes


Researchers uncover ways to improve railcar roller bearing safety, strength

Researchers uncover ways to improve railcar roller bearing safety, strength
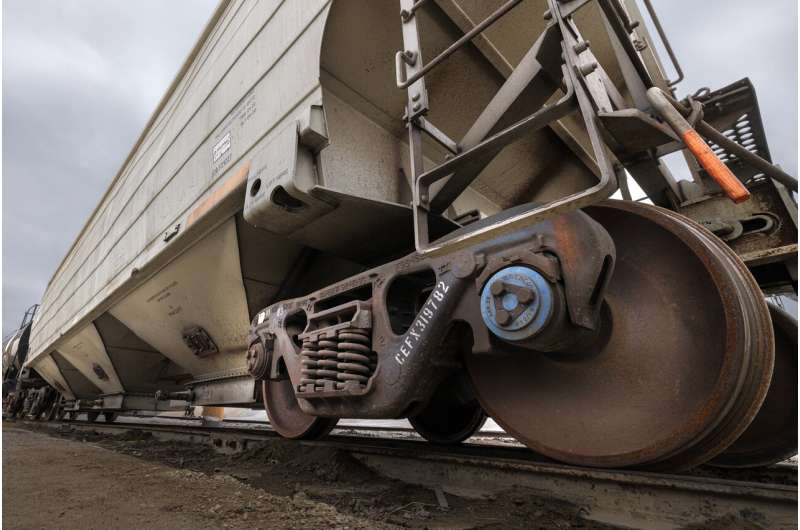
A blue Brenco railcar axle bearing is shown on a railcar. Each railcar has more
 than 350 bearings to support the load and keep the wheels turning. This railcar
 was photographed in the Omaha, Lincoln and Beatirce Railway yard with 
permission from the railway. 
Credit: Craig Chandler | University Communication and Marketing

When Nebraska Engineering researchers began cooking up new recipes for manufacturing railcar bearing components, they expected there would be a few offerings that wouldn't be as satisfying.

However, rollers for a railroad tapered roller bearing produced using , a state-of-the-art 3D printing lab, and additive manufacturing processes proved to be just as robust as rollers made using currently conventional techniques.

Joseph Turner, Robert W. Brightfelt Professor of Mechanical Engineering, said the first-ever 3D-printed rollers for railroad bearings exceeded expectations, creating a starting point for expanding the use of this innovative process that could help to make transportation even safer. Their results were compiled into a paper—"Fatigue Performance of Bearing Rollers Manufactured by Laser Powder Bed Fusion"—that was published in Bearing and Transmission Steels Technology.

"We cooked up many different recipes and we printed many rollers," Turner said. "We expected the printed rollers to show failure early on in the tests, but the bottom line is they performed just as well as conventional rollers. Now, we're going to explore other ideas using this work as the foundation."

The team was led by Turner and recent mechanical engineering doctoral graduate Luz Sotelo. It also included former faculty member Michael Sealy, graduate students Cody Pratt, Guru Madireddy and Rakeshkumar Karunakaran, and industry partner Amsted Rail Brenco. The project also received support from the National Science Foundation and the Federal Railroad Administration. Sotelo was an NSF Graduate Fellow.

Turner said the team expected standard fatigue tests simulating the loads—up to 286,000 pounds per railcar over 250,000 miles traveled—would show the metal AM recipe for a printed bearing was in need of tweaking.

However, Turner said, the rollers printed in the College of Engineering's Nebraska Engineering Additive Technology Labs using 8620HC—a high-carbon steel—performed as well as those manufactured using current standard processes.

"Basically, when you look at the two types of rollers side by side, you can't see any difference in the look or their performance," Turner said. "A lot of times (in metal AM), you will have concerns about the porosity or the internal microstructure of the metals in the first printed objects. Our 3D-printed rollers held up to the demands of the loads and distance that are expected from the mass-produced bearings."

Typical railcar bearings have more than 40 rollers, which measure about 2 inches by ¾ of an inch, one bearing for each wheel, and a total of about 350 per railcar. The standard-use bearings, Turner said, are manufactured by cutting long loops of thick, steel wire into the required lengths and then grinding them down to create the tapers needed for optimal performance.

Using 3D printing to produce the rollers proved to be significantly more expensive than the current methods, Turner said. Despite that drawback, he said, the use of 3D printing could in the not-too-distant future find a place in many industries that use these types of bearings.

"You have to explore whether it's even possible before you can begin figuring out when it's cost effective," Turner said. "Setting up a production line that makes the bearings is a huge investment but, maybe, it can work in emergency situations—like a  in the outback of Australia has a failure that might otherwise hurt their ability to move their product. If they can 3D print a part and not have to wait for something to be shipped to them."

The next steps, Turner said, might also include looking at possible other ways to make 3D printing more financially sensible in the manufacturing process, such as using more expensive steel powders to create a coating on bearing components made from less expensive metals, to create an overall cheaper and more sturdy bearing with better properties.

"One of the things we in the NEAT Lab have become pretty proficient at is developing these new recipes for alloys," Turner said. "As  for our ingredients and equipment continue to drop in price, we will be able to try rolling out some new things that could appeal to a lot of fields and industries."

More information: Luz D. Sotelo et al, Fatigue Performance of Bearing Rollers Manufactured by Laser Powder Bed Fusion, Bearing and Transmission Steels Technology (2024). DOI: 10.1520/STP164920220115


Provided by University of Nebraska-Lincoln Scientists propose anti-fatigue preparation for 3D-printed titanium alloy


Lufthansa reports loss, cuts outlook after strikes

Strikes have taken a deep bite into Lufthansa balance sheet but the airline still expects to end 2024 with an operating profit of 2.2 billion euros
Strikes have taken a deep bite into Lufthansa balance sheet but the airline still 
expects to end 2024 with an operating profit of 2.2 billion euros.

German airline giant Lufthansa reported a hefty first-quarter loss Monday and downgraded its 2024 outlook due to recent strikes, while warning of risks from conflict in the Middle East.

Adjusted operating losses came in at 849 million euros ($902 million), according to preliminary results.

While the start of the year is typically a quieter period for travel in Europe, the results were still far worse than a loss of 273 million euros in the same period last year.

"The loss was higher than expected due to various strikes," said Lufthansa, one of Europe's biggest airline groups, adding that the walkouts had slashed earnings by hundreds of millions of euros.

Lufthansa—whose carriers include Lufthansa, Eurowings, Austrian, Swiss and Brussels Airlines—cut the forecast for its  for the whole year to 2.2 billion euros.

It had previously been expecting the figure to come in broadly the same as last year, at around 2.7 billion euros.

After two years of hefty  during the pandemic, Lufthansa had racked up healthy profits in 2022 and 2023 as travel demand roared back.

But the German aviation sector faced walkouts in recent months as workers pushed for higher pay to combat inflation, with airport security staff as well as Lufthansa ground staff and  staging repeated strikes.

When the company unveiled its 2023 results in March, Lufthansa personnel chief Michael Niggemann had criticized the "uncompromising strikes," saying they were "damaging our guests, the company and ultimately our employees".

But the group has in recent weeks struck deals with major staff unions, averting the immediate threat of more industrial action.

Second-quarter profits are also likely to be impacted however, and are likely to come in lower than last year due to the impacts of wage disputes on short-term demand for bookings, Lufthansa said.

Results are expected to bounce back in the second half of the year.

Lufthansa also warned that the "recent escalation of the Middle East conflict and further geopolitical uncertainties pose risks to the group's full year financial outlook".

Lufthansa has since April 6 suspended flights to and from Tehran due to soaring regional tensions.

At the weekend, it suspended flights to and from several more destinations in the Middle East following Iran's drone and missile attack on Israel.

© 2024 AFP


Lufthansa warns on 'damaging' strikes, as 2023 profits double

SAY BYE BYE CHINA

Apple announces Vietnam spending boost as CEO visits Hanoi

OFFSHORING - OUTSOURCING- STALINIST STATE CAPITALI$M

Hanoi
Credit: Unsplash/CC0 Public Domain

Tech giant Apple said Monday it would increase spending on suppliers in Vietnam, a key production hub, as CEO Tim Cook arrived in the country for a two-day visit.

The iPhone maker announced the news in a statement on its website but gave no details of how much it would spend or where the money would go.

Cook is expected to meet programmers,  and students during his visit, according to VnExpress.

The visit comes as US President Joe Biden's administration seeks to ramp up Vietnam's role in the global tech supply chain in order to reduce American dependence on China.

Images on the VnExpress news site showed Cook taking a walk by Hoan Kiem lake in downtown Hanoi.

"Hello Vietnam. I am so excited to be here today. I can't wait to see all the developers and creators in the community," the Apple boss said in a video posted on the  site.

The Apple statement said the company has spent nearly 400 trillion dong ($16 billion) since 2019 through its local supply chain and has more than doubled its annual spending to Vietnam during the same period.

"From cooperating with local suppliers, to supporting clean water projects and , we are committed to continuing to strengthen connections in Vietnam," Cook said in the statement.

Last week more than 60 environmental and human rights organizations called on the US-based company to oppose the detention of climate activists in Vietnam.

© 2024 AFP


South Korea's Amkor opens $1.6 bn chip factory in Vietnam


Lessons from South Australia's business recovery amidst bushfires and pandemic

small business
Credit: Unsplash/CC0 Public Domain

New research has given insight into the resilience and recovery of businesses in two South Australian regions following a major bushfire event and disruptions caused by the COVID-19 pandemic.

Small businesses in two of the state's regions affected by a devastating bushfire and a COVID-19 cluster outbreak have been analyzed by economics experts at the University of South Australia to determine the best pathways for future disaster recovery in regional areas.

Like many SA regional areas heavily reliant on international tourists, Kangaroo Island and Barossa Valley experienced a drop in visitors following the destructive 2019–20 bushfires that erupted on Kangaroo Island only months before COVID-19 halted international travel. The bushfire was the largest in KI's history, scorching 211,000ha of land, which is almost half the island.

A few months later the Barossa Valley experienced its own disaster when a cluster of COVID-19 cases sent the region into lockdown. Both events caused significant disruption to businesses' cash flows, supply chains and markets.

In a study of a small pool of business owners across KI and Barossa Valley, published in the journal Regional Studies, Regional Science, UniSA's Dr. Kathy Rao found that a "dynamic capabilities approach" during a crisis is integral to long-term recovery in regional areas. This includes having the ability to identify and evaluate a threat, deploying resources in response to it and then renewing or transforming structures to ensure recovery and survival.

She says research participants spoke about the importance of financial stability for  and its impact on  during crises.

"Many of the small business operators also found that having a strong online presence including a well-established website was an essential factor in their survival during the pandemic. Connections with local community groups or committees such as Tourism SA, Regional Development Australia and well as local accountants, mentors, lawyers and web designers were also critical," she says.

Most Barossa Valley participants reflected on how COVID-19 forced them to adapt or change their existing business models or alter their products and services. Some were forced to lay off staff, while others took the initiative to learn how to make their business leaner. Some took the period as a time for reflection, revaluation and to think about how they could "do things differently."

Dr. Rao says the study has identified a lack of mental health support for business owners and operators in regional areas during times of crises.

"We know that higher workloads and stress, exacerbated by turbulent environments, can put considerable pressure on mental health and well-being of business operators which can affect their ability to manage and make decisions, ultimately posing a risk to their resilience," she says.

"Many of the participants indicated that mental health is still a topic that carries stigma in regional communities. The  of the pandemic on business owners and managers were especially significant because without , other supports were difficult to access."

The findings also indicated that regional business responses to the COVID-19 crisis were reactionary and often involved implementing short-term remedies to address reduced cash flow and supply and demand.

Dr. Rao says the findings have highlighted the need for regional businesses to undertake key processes that lead to building resilience over time, rather than only acting once a crisis has broken. These include establishing connections with local and regional support structures such as Regional Development Australia, tourism or primary industry authorities, local councils and community groups.

Most businesses in the study would also have failed to survive without a digital marketplace or online marketing strategies.

"Businesses therefore need to consider these factors in their crisis recovery planning and skillfully navigate and adapt around these challenges," Dr. Rao says.

She says while few Australian studies have investigated the impact of disasters on regional businesses, examining the effects of such crises is critical in contributing towards further regional policy development and decision making.

"Regional businesses contribute enormously to the area's socio-economic viability and act as a vital source of wealth and culture. Regional enterprises—from cafes to clothes shops to tourism enterprises—are crucial for healthy, well-functioning local communities so we must understand how to ensure regional businesses have the capacity to anticipate, adapt, respond to and recover from external shocks and disturbances," she says.

More information: Kathyayini Kathy Rao et al, The dynamic capabilities approach and regional business resilience: an Australian case study, Regional Studies, Regional Science (2024). DOI: 10.1080/21681376.2024.2315192


Provided by University of South Australia Female business leaders need better support to thrive in times of crisis


Victorian London was a city in flux: Architectural models helped the public visualize the changes

Victorian London was a city in flux: architectural models helped the public visualise the changes
The new Royal Courts of Justice in London, opened in 1882 and photographed here 
between 1897 and 1899. 
Credit: The Queen's Empire. Volume 3. Cassell & Co. London|Wikimedia

In 1848, the British government decided to draw up a precisely measured map of London. Imperial expansion had seen the city develop quickly, particularly around the docks and the City of London.

There was a growing need for improved infrastucture, particularly an underground sewer system, which would be overseen by the Metropolitan Board of Works.

Previous cartographic attempts had largely involved piecing together existing maps of the region. Military professionals now undertook a thorough survey of the city's topography and rivers, covering a radius of 12 miles from St Paul's Cathedral.

This was a time of great urban expansion. London in the mid-19th century was becoming the global center of finance and trade. New public buildings were constructed including museums, libraries, art galleries and markets (for money, livestock, coal). As the minister in charge of public works, Austin Layard, put it: "The government has to decide upon the erection of a large number of important public buildings than had ever been raised in any capital at one time."

Politicians began to talk about needing to supplement this new cartographic view of the city with a three-dimensional one. The idea was to detail both individual buildings and major changes to urban districts. In 1869 Layard thus proposed a new 3D model of the city itself that would be open to public viewing.

In my new book, Modeling the Metropolis, I show how architectural models became a crucial communication tool in Victorian London. They enabled politicians and the wider public to visualize, in unprecedented fashion, how their city was changing.

Victorian politics and architecture

The early 19th century saw major changes made to the electoral landscape in Britain. First, following the 1832 Reform Act, voting rights were extended to a greater share of the male population. Electoral boundaries moved to better reflect the urbanization of industrialized Britain.

Three decades later, the 1867 Reform Act enfranchised a million new male voters. This doubled the size of the electorate and propelled the country into the age of mass politics.

These changes created a new political context and an urban public eager for democratic participation. In London, this meant keeping the public up to date on how the city was expanding.

The popular press discussed the various merits of new prominent civic buildings. These included the National Gallery, built between 1832-1838, and George Edmund Street's designs for the Royal Courts of Justice, which opened in 1882.

Architectural models came to play a central role in this public discourse. Architects and politicians used scale models to present to the public an accurate idea of a proposed building, prior to its construction.

These used models variously to show different options for how a future building might look, to raise funds for its construction or to celebrate the project's progress. These models enabled audiences to visualize different scenarios and discuss the future appearance of their city.

During a debate about the Royal Courts of Justice, Layard said, "I am strongly of opinion that no great public building ought to be erected without a model upon a large scale, having first been submitted to the public."

A model, he argued, was the best means to openly display the chosen design to the government, opposition members of parliament and the tax-paying public. He felt it necessary that projects "be seen and criticized."

In 1869 a team of modelmakers made a vast model of the Embankment, from Blackfriars Bridge to the Palace of Westminster. It showed two different sites for the Royal Courts of Justice. Each component part could be removed and replaced to show new buildings constructed as the city changed.

Although now lost, we know that the model required consent from the chancellor of the exchequer due to its expense. It cost some £150,000 in today's money. Londoners were able to view it on display in the library of the Palace of Westminster and at the newly opened Bethnal Green Museum.

Nineteenth-century leveling up

The relationship between democratic politics and architectural models also reveals tensions between the metropolis and the regions in Victorian Britain.

After 1867, the importance of British popular politics grew exponentially. The Third Reform Act in 1882 extended the same voting qualifications as existed in Britain's cities and towns to the countryside.

Sections of the public and various MPs raised concerns that national finances would be used for the benefit of London alone. Metropolitan improvements were funded directly by the city's own authorities. There was a growing sense that the capital should also pay for its own public buildings.

This issue came to the fore in various debates surrounding the construction of the Natural History Museum and various government offices on Whitehall. Select committee inquiries in parliament logged journalistic protests and complaints. The extents and ornament of a building were often reduced as a result, in a bid to lower costs.

By the turn of the 20th century, a group of politicians advocated for changes to legislation. Led by Francis Wemyss-Charteris-Douglas, the 10th Earl of Wemyss, with the support of the Royal Institute of British Architects, they suggested that any proposal for a government-funded  should first require an architectural model to be displayed in public.

Politicians in the House of Lords said models would allow taxpayers to view designs for new buildings and give them the opportunity to voice an opinion. Ultimately, this campaign was unsuccessful. The legislation regulating how public works should be presented to the public did not change.

Across the Victorian period, journalists and critics questioned the reliability of particular scales, viewing positions or model-making materials. This popular use of architectural models shows how effective they can be as a tool of communication, and how they give the public an idea of what buildings will really look like.


New research highlights aging dog health care needs

New research highlights ageing dog healthcare needs
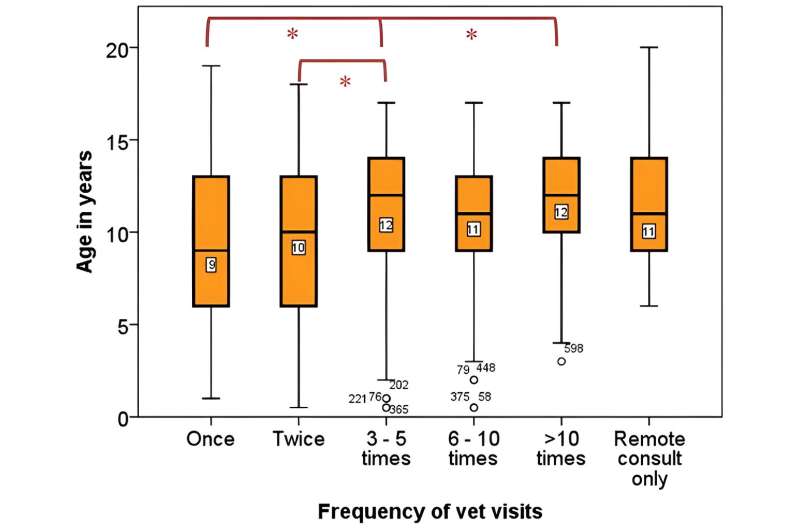
Box plot displaying the frequency of times owners brought their dog physically to the 
veterinary surgeon in the past 12 months and age in years of the dogs. 
Number of dogs = 503. The frequency of vet visits was categorized into five groups: once,
 twice, 3–5 times, 6–10 times, >10 times, and remote consult only. The median age in
 years of the dogs in each frequency category was compared using a Kruskal Wallis test,
 df = 5, N = 503, p = 0.001. Categories that differed significantly are denoted with *p < 0.050;
 significance values have been adjusted by the Bonferroni correction for multiple tests. 
Credit: Frontiers in Veterinary Science (2024). DOI: 10.3389/fvets.2024.1358480

New research from the University of Liverpool shows that dog owners think many important changes in their older pets are "just old age," when actually they are signs of serious health problems.

The researchers surveyed more than 600  and more than 300 veterinary professionals across the UK. Dog owners were asked if they had noticed any of a list of 48 different clinical signs in their older dogs and how urgently they thought they should seek veterinary advice when they noticed them.

The research team identified that dog owners regularly attributed potentially serious changes in older dogs to normal aging, and thus may not take them to see a vet.

How often should an aging dog see a vet?

The majority of owners believed a "healthy" senior dog (seven years plus) should go to the vet once a year, whereas veterinary professionals most commonly advised every six months.

A minority (14%) of owners would take the dog only "if they got sick," but almost all (98%) of veterinary professionals would not advise this strategy. Sixteen percent of owners of dogs of all ages had not had any contact with their veterinary practice in the previous year.

To vaccinate or not to vaccinate?

Health checks often occur during vaccination appointments, and 92% of veterinary professionals believed that senior dogs should receive yearly vaccinations; however, 28% of owners' dogs of all ages had not been vaccinated in the previous year. In fact, a third of these owners did not believe that older dogs need vaccinations.

Urgency to seek care

Dog owners who stated that their dog had experienced a clinical sign typically reported less urgency to seek  than owners whose dog had never experienced it and responded to a hypothetical question asking what they would do if they noticed this sign in their dog.

The majority of veterinary professionals (85–100%) thought that it was moderately to extremely important for owners of senior dogs to seek veterinary advice for all 15 of the most common clinical signs. The three most common clinical signs reported by owners in their older dogs were slowing down on walks (57%), dental tartar (53%), and being stiff on rising (50%).

However, fewer than 70% of owners would seek veterinary care for their dog within a week for dental issues (bad breath and tartar) or musculoskeletal issues (problems with stairs/jumping, slowing down on walks, and stiff on rising).

Dog owners attribute clinical signs to 'just old age'

Veterinary professionals reported that they believed owners commonly associated sleeping all the time, slowing down on walks, being stiff on rising, and the presence of dental tartar with old age rather than potential illness. Owners' opinions were broadly in line with veterinary professionals' perceptions of them. For example, 78% of owners believed slowing down on walks was a normal part of the aging process and would not take their dog to the vet for and, and 77% for sleeping all the time.

Study co-author Professor Carri Westgarth said, "Perceptions of dog owners and veterinary professionals can influence the preventive health care and treatment provided to dogs, especially at the senior life stage, when  become more common. The differences in opinion highlighted by our survey suggest that new educational initiatives and more effective communication are required."

Findings from this study have been used to support the design of a new resource that can facilitate communication between owners and veterinary professionals. A checklist of common missed clinical signs for use pre-veterinary appointments would be supported by both owners and veterinary professionals surveyed in the current study.

The BSAVA PetSavers Aging Canine Toolkit (ACT) leaflet and poster are currently in use in first-opinion practice, and feedback is being collected to measure the toolkit's impact on owners, veterinary professionals, and senior dogs.

Dr. Sarah Williams from BSAVA PetSavers said, "Screening tools and toolkits have the potential to increase owner understanding and engagement with veterinary care, and through repeated application over time and implementation of necessary interventions, improve patient welfare and health span."

The work is published in the journal Frontiers in Veterinary Science.

More information: Lisa J. Wallis et al, Cross-sectional United Kingdom surveys demonstrate that owners and veterinary professionals differ in their perceptions of preventive and treatment healthcare needs in ageing dogs, Frontiers in Veterinary Science (2024). DOI: 10.3389/fvets.2024.1358480


Provided by University of Liverpool 'Just old age' or is your dog experiencing a serious clinical issue?


Reptiles in South Africa are under threat, but there's good news too

reptile
Credit: Pixabay/CC0 Public Domain

Media reports about the biodiversity crisis and what researchers have argued qualifies as a mass extinction event tend to focus on the big ecological effects. Melting ice sheets, severe weather events, droughts, habitat loss and wildfires dominate headlines. So too do the plights of large iconic animals—orangutans, gorillas, polar bears, rhinos, elephants, pangolins.

Small animals do not often share the limelight. That includes reptiles. With more than 12,000 species, this largely low-profile group of vertebrates is more species-rich than each of the following groups: mammals, birds and amphibians. And many reptiles play important but largely unknown roles in ecosystems, such as snakes controlling pest species or crocodiles as apex predators.

A recent global review found that more than 20% of  were in decline and at risk of extinction. This is similar to the percentage of threatened mammals, amphibians and birds.

Tortoises, crocodiles and, specifically within Africa, chameleons and vipers are the reptile species most at risk of extinction. In addition to the effects of habitat loss and climate change, some species of reptiles have high value in the pet trade, leading to harvesting of wild individuals. Some species of South African tortoises, chameleons, girdled lizards and small-body vipers are prevalent in the pet trade, leading to poaching of live animals.

We are herpetologists who are part of a team that has just published a new book assessing all 401 South African indigenous terrestrial reptiles and related conservation efforts. The methods we used strictly followed the protocols of the International Union for Conservation of Nature (IUCN). This means the findings are more robust than previous assessments and more likely represent the true conservation status of South African reptiles.

The bad news

Though there's some good news, this is offset by the findings of a parallel study, which we co-authored with others.

It revealed that many species of threatened reptiles were inadequately conserved in formally protected areas. One reason for this mismatch is that many of the threatened species have small geographic ranges falling outside protected areas; another is that reptiles are generally not considered when planning . Thus, some species do not occur in any protected areas at all.

For example, the sungazer, a South African lizard that is in high demand in the pet and muthi (traditional medicine) trades—and does not breed in captivity—does not occur in any formally protected area.

The tiny geometric tortoise also doesn't occur in formally protected areas. Its population is winking out of existence due to habitat loss. The extinction of one of South Africa's small grassland lizards, Eastwood's long-tailed seps, may also be the result of it not occurring in any formal protected area. Its grassland habitat has been slowly converted to pine plantation.

The good news

A positive finding of this new conservation assessment is that the percentage of threatened South African reptiles is actually lower (7.6%) than the . This is also lower than previous assessments for South Africa's reptiles, since the IUCN's assessment protocols were more rigorously applied than before.

South Africa's reptiles probably fare better than those in some other parts of the world because there are many active conservation measures in place and a fair amount (9% or 108,000 km²) of South Africa's landcover is under protection. The global average is weighted by much more severe threats in areas where habitats are not as well protected as they are in South Africa, such as south-east Asia, central Africa and central South America.

Conservation planning needed

We contend that it is important that the conservation needs of South Africa's reptiles be integrated into conservation planning more broadly. Many South African reptiles have small geographic ranges and are thus vulnerable to , which can rapidly increase the threat of extinction.

Regular conservation assessments such as those documented in our new book and the parallel study mentioned above are also crucial for highlighting relevant conservation issues of South Africa's reptiles.

Provided by The Conversation 

This article is republished from The Conversation under a Creative Commons license. Read the original article.The Conversation