US EPA’s controversial Climate Crisis report is full of lies and mistakes
The US Environmental Protection Agency (EPA) released a controversial report in July claiming the effects of the Climate Crisis were overblown and is using the “critical review” to justify gutting the EPA of its Obama-era "endangerment finding”. A fact check of the report by Carbon Brief found the report to be full of lies and errors.
The 140-page report – “A critical review of impacts of greenhouse gas emissions on the US climate” – was published by the US Department of Energy (DoE) on 23 July, just days before the government laid out plans to revoke a scientific finding used as the legal basis for emissions regulation.
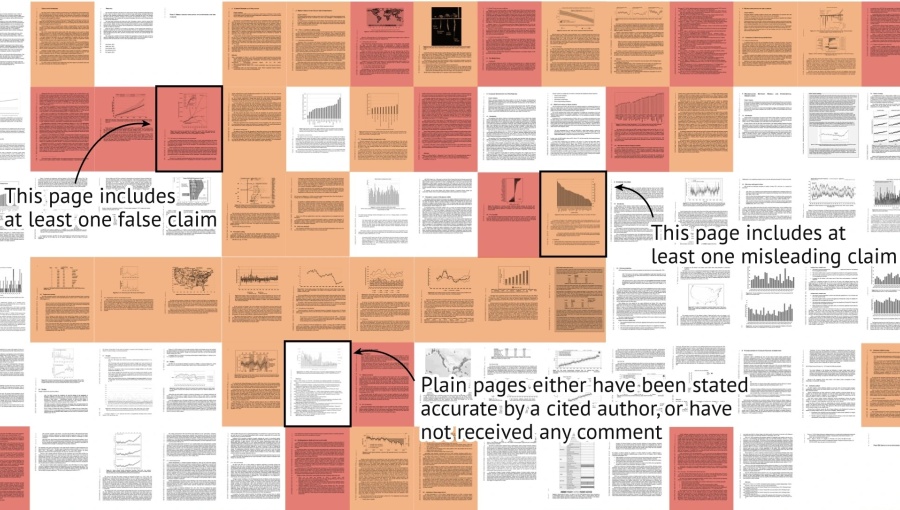
Carbon Brief invited a wide range of scientists, including some whose work was cited in the review, to assess its claims. Their responses—highlighting inaccuracies in red and misleading statements in orange—paint a picture of a document riddled with flaws.
Not only has US President Donald Trump taken the US out of the 2015 Paris Agreement for a second time, he campaigned on the slogan “drill, baby, drill” at a time when emissions are at record highs and rising. The US is the second largest emitter of emissions and unlike China and India, the first and third largest, has already blown through its carbon budget and fuelling trillions of dollars in environmental damage. The United Nations’ Intergovernmental Panel on Climate Change (IPCC) has already said that the Paris target to hold temperature rises to 1.5 °C above the pre-industrial benchmark has been missed, but the world is now on course for a catastrophic 2.7C-3.1C temperature increase.
The report is clearly intended to justify rolling back emissions regulations and contains at least 100 false or misleading statements, according to the Carbon Brief factcheck involving dozens of leading climate scientists.
The report’s executive summary asserts that “CO2-induced warming might be less damaging economically than commonly believed” and claims that “excessively aggressive [emissions] mitigation policies could prove more detrimental than beneficial.” Both statements were singled out by scientists as wrong.
“Compiled in just two months by five ‘independent’ researchers hand-selected by the climate-sceptic US secretary of energy Chris Wright, the document has sparked fierce criticism,” Carbon Brief reported. Experts highlighted factual errors, misrepresentation of existing research, disorganised citations and selective use of data.
The assessment also revealed that of the 350 references included, almost 10% were authored by the report’s own contributors. “Experts have also noted the authors’ track record of promoting views at odds with the mainstream understanding of climate science,” Carbon Brief noted.
The DoE has insisted the review underwent an “internal peer-review period amongst [the] DoE’s scientific research community.” Critics argue this falls short of the independent, transparent scrutiny expected for documents intended to guide regulatory decisions – especially on such an important subject as a policy briefing covering what is an existential crisis for humanity.
At stake is the Obama-era endangerment finding, enacted in 2009, which concluded that six greenhouse gases endanger public health and welfare and therefore must be regulated under the Clean Air Act.
That decision has since been bolstered by the non-binding conclusion by the world’s top court, the International Court of Justice (ICJ) that ruled in July that a sustainable environment is a human right. This provides a legal precedent for holding governments and companies liable for the trillions of dollars of Climate Crisis damage by extreme weather. Both have a legal obligation to contain and reduce emissions, the ICJ found.
The Trump administration has argued that “updated studies and information” set out in the new report would “challenge the assumptions” of that finding, according to a July 29 statement from the EPA.
Amid growing concern about political interference in science, some researchers who participated in the factcheck requested anonymity. The DoE did not respond to Carbon Brief’s request for comment.
Trump’s commitment to fighting the Climate Crisis
Trump has never been committed to tackling the Climate Crisis. The previous controversial head of the EPA is Scott Pruitt, who served under President Donald Trump from 2017 to 2018. His tenure was marked by extensive ethics scandals, including allegations of misusing agency resources, first-class travel, and cozy relationships with lobbyists. Pruitt resigned amid at least 14 federal investigations and a widespread pattern of questionable conduct. The current head, Lee Zeldin, is no better.
The report was commissioned by the Trump administration's Department of Energy to provide a scientific justification for the EPA's proposal to repeal the 2009 endangerment finding.
The finding, established by the EPA under the Obama administration, declared that greenhouse gases endanger human health and welfare, which is the basis for many federal climate regulations.
Mainstream scientists, like Zeke Hausfather of Berkeley Earth, criticized the report as a "farce" for cherry-picking data to create a misleading narrative and for bypassing the traditional peer-review process.
The report was released on the same day the EPA proposed rescinding the endangerment finding, leading to claims of a coordinated effort to undermine established climate science, according to Politico Pro.
The authors of the controversial Department of Energy report, "A Critical Review of Impacts of Greenhouse Gas Emissions on the US Climate," which was commissioned to support the EPA's proposal to rescind the endangerment finding, are five prominent sceptics of the climate consensus: Steven E. Koonin, John Christy, Judith Curry, Richard Epstein, and Robert H. Balling Jr. All of these authors are known Climate Crisis sceptics, handpicked to undermine the US climate policies and justify a walk back from its commitment to reducing emissions.
The report has been heavily criticized for lacking peer review and selectively using fringe studies to support its contrarian conclusions.
Main findings of Carbon Brief's fact check
Main findings of Carbon Brief's fact check of EPA report | |||
Section | Claim | Critique | Brief Explanation |
Executive Summary (Page 0) | Elevated CO2 enhances plant growth, contributing to global greening and agricultural productivity. | MISLEADING | Overstates CO2 benefits, ignores climate-driven losses (e.g., extreme weather, reduced crop nutrients). Cites non-peer-reviewed co2science.org; benefits overstated per Ainsworth & Long (2021). |
Executive Summary (Page 0) | Climate models offer little guidance on CO2 response, exaggerating warming projections. | FALSE | IPCC AR6 integrates models, observations, and paleoclimate data. CMIP6 ensemble mean aligns with observed warming (within 0.2°C). Claim misrepresents robust methodology. |
CO2 as a Pollutant (Page 2) | Rising CO2 promotes plant growth and neutralizes ocean alkalinity. | MISLEADING | Ignores climate impacts (e.g., warming, nutrient loss in crops). Ocean acidification reduces calcium carbonate, harming marine life, not neutralized (Honisch et al., 2011). |
CO2 and Global Greening (Page 3) | CO2 drives 30% increase in photosynthesis since 1900, exceeding model predictions (Haverd et al., 2020). | FALSE | Haverd et al. focuses on natural ecosystems, not crops. Climate stressors (e.g., droughts) threaten yields; socioeconomic impacts not transferable. |
CO2 and Global Greening (Page 3) | Greening continues with no slowdown (Piao et al., 2020; Chen et al., 2024). | MISLEADING | Chen et al. (2024) shows greening slowdown; Chen (2022) notes reversal in 90% of vegetated areas post-2000. Piao et al. attributes Arctic greening to warming, not CO2. |
CO2 and Global Greening (Page 4) | Plant growth ceases below 180 ppm CO2; C3 plants benefit greatly. | MISLEADING | Lab studies (Gerhart & Ward, 2010) not representative of natural conditions. Nutrient limits and climate stressors reduce CO2 benefits; ecosystem disruptions ignored. |
CO2 and Global Greening (Page 6) | IPCC minimally discusses global greening and CO2 fertilization. | FALSE | IPCC AR6 WG1 and WG2 extensively cover CO2 effects (e.g., WG2 Chapter 5, 136 mentions), including nutrient declines and ecosystem impacts, contrary to claim. |
Alkaline Oceans (Page 6) | Ocean life evolved in acidic conditions (pH 6.5–7.0), implying resilience. | MISLEADING | Ancient ocean pH irrelevant to modern ecosystems. Rapid CO2-driven acidification harms shell-forming species by reducing calcium carbonate (Honisch et al., 2011). |
Alkaline Oceans (Page 7) | Ocean pH was 7.4–7.5 during last glaciation, rising to present levels. | MISLEADING | Refers to deep Southern Ocean, not surface. Surface pH was higher than today during glaciation (Shao et al., 2019), contradicting claim. |
Alkaline Oceans (Page 8) | Ocean acidification has negligible impact on fish behavior (Clements et al., 2021). | MISLEADING | Clements et al. applies to fish behavior, not other species or ecosystems. Acidification harms shellfish and corals; claim overgeneralizes findings. |
Human Influences (Page 11) | IPCC downplays solar role; plausible reconstructions suggest solar contribution to warming. | MISLEADING | IPCC uses robust TSI models (SATIRE, NRLTSI). Connolly et al. (2021) cherry-picks outdated, flawed reconstructions (e.g., Hoyt & Schatten, 1993), inflating solar role. |
Radiative Forcing (Page 13) | ACRIM-gap in TSI data (1989–91) is a thorny issue. | MISLEADING | Overstates ACRIM-gap significance. Recent studies (e.g., Amdur & Huybers, 2023) show no TSI increase, contradicting claim of major uncertainty. |
Emission Scenarios (Page 15) | IPCC emission projections overstate actual emissions. | FALSE | Some scenarios (e.g., RCP8.5) overestimate, others (e.g., RCP6.0) underestimate. Total CO2 emissions align with SSP2-4.5, not consistently overstated. |
Carbon Cycle (Page 17) | Atmosphere has ~850 GtC; land/ocean exchanges 80/120 GtC annually. | MISLEADING | Outdated (850 GtC ~2010; 877 GtC in 2020). Reverses land/ocean fluxes (land: 120–175 GtC; ocean: 90 GtC). Misleads on net vs. gross emissions. |
Urbanization (Page 21) | UHI biases land temperature records upward, not fully corrected. | FALSE | Homogenized data (Hausfather et al., 2013) show minimal UHI bias. Satellite and USCRN data confirm warming trends, unaffected by UHI. |
Volcanic Forcing (Page 13) | Uncertainty in Hunga Tonga volcano forcing sign. | MISLEADING | Jenkins et al. (2023) omitted aerosols, suggesting warming. Recent studies (e.g., Stenchikov et al., 2025) confirm slight cooling. |
Climate Sensitivity (Page 27) | AR6 did not rely on climate models for ECS estimates. | FALSE | AR6 used models, observations, and paleoclimate data (Sherwood et al., 2020). Claim contradicts report’s later acknowledgment of model use. |
Extreme Weather (Page 46) | Most extreme weather shows no long-term trends. | MISLEADING | Cherry-picks low-confidence IPCC statements. AR6 confirms increased frequency/intensity of heatwaves, heavy precipitation, and strong hurricanes globally. |
Wildfires (Page 70) | US wildfire area burned increased only until 2007. | MISLEADING | Western US forest fire area tripled over 40 years, with record-breaking 2020–21 fires. Claim ignores regional trends and fire suppression failures. |
Sea Level (Page 75) | Sea level rise is below IPCC AR6 projections. | FALSE | Ignores observed acceleration. Satellite data (74 mm by 2025) align with AR6 projections (~9–10 cm by 2030), consistent with expected rise. |
Global Sea Level Rise (Page 75) | Sea level rise began 1820–1860, before most anthropogenic GHG emissions. | MISLEADING | Unfairly compares start of rise with "most" emissions. CO2 rise began ~1820–1860, coinciding with sea level rise (Keeling curve; Nature Communications, 2019). |
Attribution of Global Warming (Page 84) | Natural drivers changed global temperature by ±0.1°C since 1850–1900, with no net impact. | MISLEADING | Misrepresents AR6 Fig. SPM.2, which shows net effect, not max changes. Natural variability caused ±0.5°C fluctuations, but net contribution is ~±0.1°C. |
Attribution of Global Warming (Page 84) | Minimal natural variability contribution disputed by studies questioning solar and ocean circulation impacts. | MISLEADING | Relies on cherry-picked, discredited TSI reconstructions (e.g., Hoyt & Schatten, 1993). Chatzistergos et al. (2023) shows these are scientifically flawed. |
Attribution of Global Warming (Page 84) | AR5 estimated small solar radiative forcing (0.05 W/m², 1750–2011). | MISLEADING | Imprecise wording; AR5 range was 0–0.1 W/m². AR6 uses full solar cycles, not minima, causing confusion in DoE report comparisons. |
Attribution of Global Warming (Page 84) | AR6 cites TSI increase of 0.7–2.7 W/m² from Maunder Minimum to late 20th century. | MISLEADING | Vague; conflates TSI differences with radiative forcing. AR6’s 2.7 W/m² is a theoretical upper bound, not historical trend; most reconstructions show smaller trends. |
Attribution of Global Warming (Page 84) | IPCC minimally discusses solar influences on climate. | FALSE | IPCC AR5, AR6 extensively discuss solar impacts (e.g., AR6 WG1 Chapter 7). Claim ignores comprehensive solar forcing assessments. |
Attribution of Global Warming (Page 84, Section 8.3.1) | IPCC AR6 inadequately assesses natural climate variability. | MISLEADING | Overstates uncertainty. AR6 confirms GHG-driven warming dominates; ocean warming patterns (top-down) contradict ocean circulation as primary driver. |
Attribution of Global Warming (Page 85) | High solar activity (Modern Maximum, 1959–1990s) supports significant solar role. | MISLEADING | Cites Chatzistergos et al. (2023) out of context; sunspot-based Modern Maximum doesn’t imply large TSI trend. Recent reconstructions show minimal trend. |
Attribution of Global Warming (Page 85) | CMIP6 uses low-variability TSI datasets, dismissing high-variability reconstructions. | MISLEADING | AR6’s 2.7 W/m² is a theoretical maximum, not historical. CMIP6 uses robust SATIRE, NRLTSI models; high-variability reconstructions are outdated. |
Attribution of Global Warming (Page 85) | AR6 shows greater solar impact than AR5, but solar forcing remains small. | MISLEADING | Vague; confuses TSI and radiative forcing. AR6’s solar forcing estimate (0.01 W/m²) is lower than AR5’s (0.05 W/m²), contradicting claim. |
Attribution of Global Warming (Page 85) | Solar impact on climate is uncertain, not evident in IPCC reports. | MISLEADING | AR6 discusses TSI uncertainty (e.g., Yeo et al., 2020). Connolly et al. (2021) uses discredited reconstructions; IPCC addresses solar adequately. |
Attribution of Global Warming (Page 85) | TSI datasets disagree on 1986–96 trend (ACRIM-gap). | MISLEADING | Overstates ACRIM-gap impact. Recent studies (e.g., Amdur & Huybers, 2023) show minimal TSI trend, undermining significant solar contribution claims. |
Attribution of Global Warming (Page 85) | TSI satellite record calibrates proxy models for past solar variations. | MISLEADING | Overlooks physics-based models (e.g., SATIRE); Velasco Herrera et al. (2015) is unreliable. TSI reference has minor impact on long-term trends. |
Attribution of Global Warming (Page 85) | High-variability TSI datasets explain >70% of temperature variability since 1750. | MISLEADING | Cites flawed studies (Scafetta, 2013; Stefani, 2021) using discredited Hoyt & Schatten (1993) TSI. Modern reconstructions show small solar impact. |
Attribution of Global Warming (Page 85) | TSI satellite record choice significantly affects climate attribution. | MISLEADING | Exaggerates TSI record impact. Physics-based models (e.g., SATIRE) show minimal effect of reference TSI on trends; high-variability models are discredited. |
Attribution of Global Warming (Page 85) | ~80% of solar influence on climate from non-TSI mechanisms. | FALSE | Scafetta (2023) relies on discredited Hoyt & Schatten (1993) TSI. Non-TSI effects (e.g., cosmic rays) shown negligible (CLOUD experiment, Pierce, 2017). |
Attribution of Global Warming (Page 85) | Non-TSI solar effects (e.g., UV, cosmic rays) are significant, not in climate models. | MISLEADING | Exaggerates non-TSI effects; CLOUD experiment (Pierce, 2017) shows negligible cosmic ray impact. Many CMIP6 models include spectral irradiance, ozone effects. |
Attribution of Global Warming (Page 87) | Early 20th century warming (1901–50) had little CO2 impact (298–310 ppm). | MISLEADING | Faulty; 12 ppm CO2 caused ~0.2°C warming, offset by aerosols. Bayesian analysis (Hegerl et al., 2017) shows ~50% forced warming, not “somehow” inferred. |
Attribution of Global Warming (Page 88) | Great Pacific Climate Shift attributes ‚â•40% of late 20th century warming to natural variability. | MISLEADING | Relies on Tung & Zhou (2013); other studies show lower AMO contribution. AR6 notes natural variability has little effect on centennial warming. |
Attribution of Global Warming (Page 89) | Vostok ice core shows temperature drives CO2, not vice versa. | MISLEADING | Vostok data are regional, not global. Shakun et al. (2012) shows CO2 leads global temperature in deglaciation; CO2 drives ice-age cycles (Broccoli, 2000). |
Declining Planetary Albedo (Page 90) | 0.5% albedo reduction since 2015 caused 1.7 W/m² increase in absorbed solar radiation. | MISLEADING | Incomplete comparison; albedo decline is a mix of forcing and response. GHG warming dominates energy imbalance (Hodnebrog et al., 2024). |
Declining Planetary Albedo (Page 90) | Arctic sea ice declined by ~5% since 1980. | FALSE | September sea ice declined 34–35% (OSISAF, NSIDC); annual mean ~14%. Misleadingly cites Antarctic data for Arctic claim. |
Declining Planetary Albedo (Page 90) | Pause in Arctic sea ice decline since 2007. | MISLEADING | True but lacks context; England et al. (2025) note pause is temporary due to variability, not a cessation of human-induced decline. |
Declining Planetary Albedo (Page 90) | No significant Antarctic sea ice trend (1979–2020). | MISLEADING | Omits dramatic decline since 2015 with record lows; recent studies show unprecedented lows (Nature Climate Change, 2022). |
Declining Planetary Albedo (Page 90, Section 8.4) | Overemphasizes natural variability in albedo decline. | MISLEADING | Downplays low-cloud feedback and aerosol effects; overstates natural variability’s role in albedo changes (Goessling, Allan). |
Declining Planetary Albedo (Page 90) | Sharp temperature and albedo increase questions short-term drivers. | MISLEADING | Overemphasizes abruptness; temperature and albedo rise steadily with ENSO variability (Loeb et al., 2024). Feedbacks amplify warming. |
Declining Planetary Albedo (Page 91) | Cloud cover decline main cause of albedo reduction; aerosols not mentioned. | MISLEADING | Omits indirect aerosol effects, a key driver of cloud cover decline (Hodnebrog et al., 2024), overemphasizing natural variability. |
Declining Planetary Albedo (Page 91) | Surface albedo changes contribute weakly to planetary albedo decline. | MISLEADING | Understates surface albedo role; sea ice decline significantly reduces albedo (Loeb et al., 2024), not just clouds. |
Declining Planetary Albedo (Page 91) | Low- and mid-level cloud decreases drive albedo decline. | MISLEADING | Misrepresents Loeb et al. (2024); cloud fraction, reflection, and surface albedo (ice melt) all contribute, plus aerosol effects. |
Declining Planetary Albedo (Page 92) | No obvious trigger for positive low-cloud feedback since 2015. | MISLEADING | Strawman; no specific trigger needed. SST pattern changes drive cloud decline (Andrews et al., 2022), consistent with warming feedbacks. |
Declining Planetary Albedo (Page 92) | Natural variability (e.g., El Niño, PDO) drives cloud cover changes. | MISLEADING | Overemphasizes natural variability; ignores aerosol reductions and cloud feedback. Hunga Tonga impact minor (Goessling). |
Declining Planetary Albedo (Page 92) | 1–2% cloud cover change has greater radiative impact than doubling CO2. | MISLEADING | Unfairly compares short-term cloud fluctuations with long-term CO2 forcing. Albedo decline is a feedback to GHG warming (Forster et al., 2021). |
Extreme Event Attribution (Page 96) | Outlier at data series end biases event probability estimates. | FALSE | Suggests bias is unmanageable; Barlow et al. (2020) and Miralles & Davison (2023) provide statistical methods to address bias. |
Extreme Event Attribution (Page 96) | Single extreme event at series end makes return period estimation unreliable. | MISLEADING | Miralles & Davison (2023) suggest avoiding return periods but recommend stating uncertainty, not avoiding attribution entirely. |
Extreme Event Attribution (Page 97) | Methods overstate heatwave rarity, biasing climate change perception. | MISLEADING | Zeder et al. (2023) quote taken out of context; short records overestimate return periods, but warming increases heatwave probability. |
Econometric Analyses (Page 104) | Conventional models show negative warming effects on French farmland values. | FALSE | Bareille & Chakir (2023) show positive impacts, consistent with Ricardian approach; no negative effects found. |
Econometric Analyses (Page 104) | Repeat sales data show climate change very beneficial for French agriculture. | FALSE | Bareille & Chakir (2023) show positive effects across all methods, not a reversal from negative to positive impacts. |
Econometric Analyses (Page 104) | Climate change benefits French agriculture, generalizable to other contexts. | MISLEADING | Benefits specific to France (e.g., vineyard expansion); not applicable to diverse climates like the US. |
Econometric Analyses (Page 104) | Warming benefits French agriculture 2–20 times more than estimated. | MISLEADING | Repeat-Ricardian approach untested elsewhere; US studies show negative impacts (Deschênes & Greenstone, 2007). |
Econometric Analyses (Page 105) | Econometric studies omit CO2 fertilization effects. | MISLEADING | Studies implicitly include CO2 effects via temperature/precipitation correlations. Hultgren et al. (2025) show partial offset of negative impacts. |
Field Studies of CO2 Enrichment (Page 105) | FACE experiments show 18% yield increase for C3 plants with 200 ppm CO2 rise. | MISLEADING | Ignores negative effects of ozone, temperature, and extreme weather; overall GHG-driven changes reduce yields (Long). |
Crop Modelling Meta-Analyses (Page 107) | Complete data show constant or increased crop yields with warming. | MISLEADING | Regression analyses miss non-linear effects (e.g., extreme heat). IPCC AR6 shows yield declines with warming (Deryng). |
CO2 Fertilisation and Nutrient Loss (Page 107) | Nutrient dilution in C3 crops sometimes occurs with CO2 rise. | MISLEADING | Consistently seen in C3 crops (e.g., 10% protein decline); ignores toxin increases (Ebi et al., 2021). |
CO2 Fertilisation and Nutrient Loss (Page 107) | Rising temperatures offset nutrient dilution; dilution not solely due to CO2. | MISLEADING | Mixed evidence; some studies show no compensation (Jayawardena et al., 2021). Ziska (2022) confirms CO2 drives protein decline. |
CO2 Fertilisation and Nutrient Loss (Page 108) | Selective breeding is a proven strategy to address nutrient dilution. | MISLEADING | Biofortification targets few nutrients, not CO2-induced declines or toxins (Ebi et al., 2021). Not proven for this purpose. |
CO2 Fertilisation and Nutrient Loss (Page 108) | Nutrient fortification and supplements are effective solutions. | MISLEADING | Supplements fail to address current deficiencies (e.g., 30% US women iron-deficient); cannot mitigate CO2-induced toxin increases. |
CO2 Fertilisation and Nutrient Loss (Page 108) | Strategies for nutrient dilution are location-specific. | MISLEADING | Developing cultivars is costly, time-consuming, and not local; impractical for widespread application (CGIAR). |
CO2 Fertilisation and Nutrient Loss (Page 108) | High-emission scenarios eliminate poverty, enabling supplement affordability. | MISLEADING | Wealth doesn’t solve nutrient deficiencies (e.g., US deficiencies persist). Toxin increases unaddressed by supplements. |
CO2 Fertilisation and Nutrient Loss (Page 108) | CO2-induced warming benefits US agriculture. | MISLEADING | Cherry-picks productivity; ignores yield declines (Hultgren et al., 2025) and toxin increases. Consensus predicts harm to US agriculture. |
CO2 Fertilisation and Nutrient Loss (Page 108) | Incorrect citation date for Deryng et al. (2016). | FALSE | Cited as 2021; correct year is 2016. Not referenced in chapter text. |
Mortality from Temperature Extremes (Page 111) | Cold-related mortality far exceeds heat-related mortality. | MISLEADING | True but irrelevant; warming increases heat-related deaths, offsetting cold reductions (Gasparrini, 2017; Masselot, 2025). |
Climate Change and Economic Growth (Page 116) | No negative effect of warming on global growth; poor countries may benefit. | FALSE | Tol (2024) finds negative global economic impacts; no evidence poor countries benefit. Claim lacks references. |
Climate Change and Economic Growth (Page 117) | Warming has negligible or positive effects on US banks and finance sector. | MISLEADING | Mohaddes et al. (2023) show broad negative impacts across US sectors, including finance; not small or positive. |
Social Cost of Carbon (Page 120) | SCC models rely on damage functions and discount rates. | MISLEADING | Omits key studies (e.g., Moore et al., 2024); cherry-picks literature, missing high SCC estimates ($283/tCO2). |
Social Cost of Carbon (Page 123) | Private benefit of carbon outweighs social cost. | FALSE | Tol (2017) unpublished, rejected for comparing average benefit to marginal cost; comparison invalid. |
Social Cost of Carbon (Page 125) | Tipping points add ~25% to SCC, deemed unlikely by IPCC. | MISLEADING | Dietz et al. find 27% median, 42% mean SCC increase; 10% chance of doubling. IPCC notes low likelihood, but risk exists. |
source: Carbon Brief | |||


