Monday, January 19, 2026

China’s electricity consumption surpasses 10 trillion kWh for the first time, outpacing US and EU combined

China’s electricity consumption surpasses 10 trillion kWh for the first time, outpacing US and EU combined
China produced 10 trillion kWh for the first time, making itself the globel electricity champion. / bne IntelliNews
By bne IntelliNews January 18, 2026

China’s annual electricity consumption surpassed 10 trillion kilowatt-hours for the first time in 2025, according to government data released this week, underscoring the country’s accelerating industrial output and surging demand from high-tech sectors including electric vehicles and artificial intelligence.

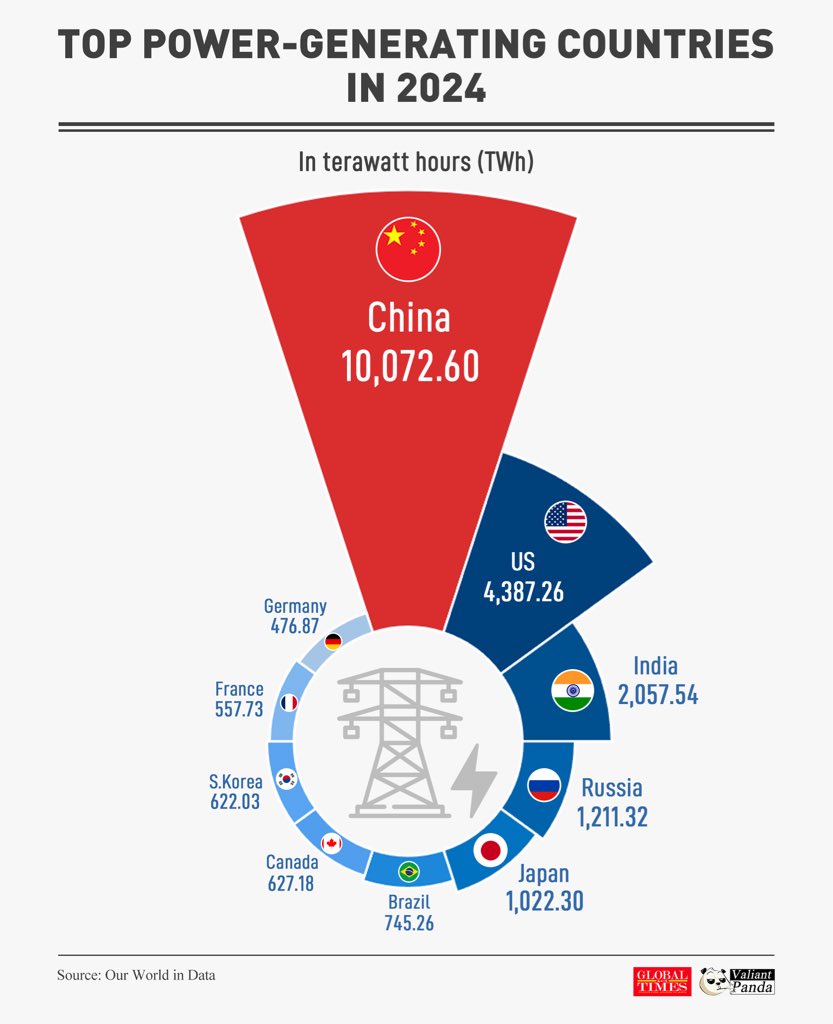
The milestone, described by Chinese officials as a first in human history, places China’s power usage at more than twice that of the United States and above the combined consumption of the European Union, Russia, India and Japan. The figure reflects growing energy demands from both traditional manufacturing and a rapidly expanding digital economy.

“Electricity is a country’s lifeline and a driving force behind advanced technological progress such as EVs and AI,” state media reported on January 17, citing data from China’s National Energy Administration.

Demand was largely driven by high-end manufacturing sectors and strategic industries supported under the government’s “new quality productive forces” strategy. In 2025, power consumption in the manufacturing of new energy vehicles rose by more than 20%, while wind power equipment manufacturing usage climbed by over 30%.

The digital economy also played a significant role. The expansion of infrastructure including 5G base stations and EV charging stations led to a more than 30% increase in electricity use in the internet and related services sector. The battery charging and swapping sector posted the highest annual rise, with power consumption soaring nearly 50% in 2025.

By the end of November 2025, the number of EV charging guns in China had reached 19.32mn, representing a 52% year-on-year increase, according to official figures.

During the 14th Five-Year Plan period (2021–2025), green electricity accounted for roughly one-third of total power consumption. Between January and November 2025, electricity traded on power markets reached more than 6tn kWh, comprising 63.7% of overall consumption.

China has also established the world’s largest clean power system and carbon trading market, part of its broader transition to low-carbon energy.

“The country has built the world’s largest clean power system and carbon trading market, and its green industries continue to grow,” the report stated.

Electricity prices remain stable amid reform and rising demand

Despite surging demand and global energy market volatility, the cost of electricity in China has remained largely stable over the past three years, due in large part to continued state regulation and targeted policy interventions.

Despite its position as the world’s largest power consumer, China continues to offer some of the lowest electricity prices globally, particularly for residential users. Industrial electricity rates in China typically range from $0.08 to $0.11 per kWh, broadly in line with the US but significantly lower than in most EU member states, where prices for industry often exceed $0.15 per kWh and can reach $0.25 or more, enhancing China’s competativeness on the global market.

Residential users in China pay an average of just $0.08 per kWh, compared to $0.15–0.17 in the US and up to $0.40 in parts of Europe. China’s limited carbon pricing and state-managed grid infrastructure also contribute to keeping costs down. While the EU’s carbon prices regularly exceed $85 per tonne, China’s national carbon market remains in its early stages, with prices closer to $8. The country’s ability to maintain low-cost electricity is a key competitive advantage as it scales up energy-intensive industries such as electric vehicle manufacturing, semiconductors and artificial intelligence.

While China liberalised pricing for industrial and commercial users in 2021, residential tariffs remain under strict government control. In response to widespread power shortages that year—driven by tight coal supplies and surging fuel costs—authorities permitted coal-fired electricity prices to fluctuate by up to 20% from benchmark levels and removed caps entirely for energy-intensive sectors. The move marked a significant shift in pricing policy, aimed at preventing supply disruptions and allowing producers to recover rising input costs.

Coal prices, which had more than doubled at their peak in late 2021, gradually stabilised through 2022 and 2023 as the government expanded long-term supply contracts and increased domestic production quotas. These measures helped to buffer end-user prices and restore grid stability without triggering the sharp increases seen in Europe or parts of Asia.

Meanwhile, China has accelerated power market reform through the expansion of electricity spot trading. As of 2023, more than 63% of total electricity consumption was traded through market mechanisms, up from less than one-third five years earlier. The trend reflects a gradual shift towards pricing based on supply and demand, though the state continues to play a central role in market coordination.

The growing share of renewable energy—particularly solar and wind—has also influenced the generation mix, but has not yet translated into significant changes in end-user tariffs. Integration costs, including grid upgrades and storage, have been offset by subsidies and policy support.

The government’s approach has allowed it to meet rising electricity demand—now the highest in the world—while maintaining broad price stability. However, analysts note that further liberalisation could introduce greater price variation in the years ahead as China deepens market reform.


Afghanistan’s heroin boom years ended with US military exit, UN report shows

Afghanistan’s heroin boom years ended with US military exit, UN report shows
Opium poppy fields in Afghanistan are nowadays a far less common site than they were in the first two decades of this century. / pd, davric, cc/public domain
By bne Eurasia bureau January 17, 2026

Opium production in Afghanistan boomed during the two decades in which largely US forces propped up a Washington-approved government – but it has collapsed since the Taliban retook power in the country in August 2021.

The stark decline in both poppy cultivation and opium output is explored in the Aghanistan Opium Survey 2025, released by the United Nations Office on Drugs and Crime (UNODC).

It shows that sustained enforcement of a ban on growing opium poppy crops, combined with drought conditions that caused crop failures, have driven down output, especially in Badakhshan, a northeastern province of Afghanistan bordering Tajikistan, China and Pakistan that is the country’s main opium poppy producing province.

The survey says that last year in Afghanistan there was an estimated potential production of 296 tonnes of opium that could be converted into approximately 22-34 tonnes of export-quality heroin. That compares to an estimated 32-50 tonnes in 2023 and an estimated 350-580 tonnes in 2022.

Credit: Afghanistan Opium Survey, UNDOC.

The report notes that in “the 2025 season, most farmers continued to adhere to the ban on opium poppy cultivation, which is in its third year of enforcement.

“The total area under opium poppy cultivation in 2025 was estimated at 10,200 hectares, 20% lower than in 2024 (12,800 hectares) and a fraction of the pre-ban levels recorded in 2022, when an estimated 232,000 hectares were cultivated nationwide.”

The UNODC – which refers to the Taliban administration as the De facto Authorities, or DfA, of Afghanistan, given their lack of international recognition beyond that lately granted by Russia – said that the DfA reported that over 4,000 hectares of opium poppy were eradicated in  the country in 2025, “although UNODC could not technically verify this number”.

While lower than the 16,000 hectares reported by the Taliban – ideologically opposed to all illicit narcotics – as eradicated in 2024, “this still corresponds to about 40% of the estimated cultivation area”, the UNODC report says.

It adds: “Eradication efforts occasionally sparked violent resistance, particularly in the northeast, where protests led to unrest and casualties.”

The report also assesses that given falling production and falling prices, Afghan farmers’ income from opium sales to traders dropped by 48% from $260mn in 2024 to $134mn in 2025. This decline resulted from falling production and falling prices.

A truck carrying thousands of pounds of processed wheat rolls goes by in Helmland province. Persuading farmers to swtich to legal crops is tough when the profits available from poppy cultivation are so much higher (Credit: Cpl. Marco Mancha, USMC, cc, ID 110719-M-PE262-373).

Afghan farmers’ income from opium sales remained at historic lows last year, observes the report, stating: “In 2025, opium prices declined from the previous year but remained well above pre-ban levels. Although opium is traded at elevated prices, relative to the pre-ban period, the amounts produced in the most recent year have been some of the lowest in decades.

“In 2024, the average seasonal price for a kilogram of dry opium was US$780 at the trader level; in 2025, the average seasonal price was at US$570, a year-on-year decline of about 26%, but still more than five times higher than the long-running pre-ban average below US$100 a kilogram.”

Credit: Afghanistan Opium Survey, UNDOC.

The report reflects on difficulties in persuading farmers to switch from growing opium poppy to standard, lawful crops, pointing out: “Opium poppy continues to be far more profitable per hectare than wheat or cotton, deepening rural vulnerability.

“In 2025, declining opium prices and smaller yields meant that a hectare of opium generated about US$17,000 in Helmand (a 43% decline from the previous year) and around US$12,000 in Badakhshan (35% less than in 2024).

“Despite this drop, opium remained far more profitable than most licit crops. For comparison, staple crops such as wheat yielded only about US$800 per hectare, while a key cash crop like cotton provided roughly US$1,600 per hectare to farmers.”

The sustained high opium crop prices might have triggered opium poppy cultivation in countries in the immediate region around Afghanistan, the report warns.

“For instance, [providing an indication of this] eradication of opium poppy in two countries near Afghanistan increased from 5,868 hectares in 2022 to 13,200 in 2023 (latest official data available),” says the report.

It adds: “Market indicators suggest supply from elsewhere, too, as opiates seizures and opium prices fell despite reduced opium production from Afghanistan and the fairly steady nature of demand for opiates.

“Such a shift could be an example of the so-called balloon effect, where enforcement in one country leads to the displacement of illegal activities to another – a phenomenon that has been observed elsewhere.”

Looking at another consequence of the ban on opium poppies in Afghanistan, the report says: “Trafficking in synthetic drugs, especially methamphetamine, seems to have increased since the ban, with seizure events in and around Afghanistan higher than before, indicating a growing risk of synthetic drug substitution as opiate production falls.

“Prices for methamphetamine in Afghanistan and neighbouring countries have also decreased in line with higher seizure volumes. UNODC’s systematic monitoring of methamphetamine prices in Afghanistan began in late 2022, and monthly kilogram prices initially fluctuated between US$600 and US$850.

“Beginning in late 2024, methamphetamine prices fell sharply, dropping below US$600 per kilogram. The price decline together with increasing seizures can reflect an increase in production capacity or greater availability stemming from inflows from other countries; at present, neither dynamic has been conclusively verified, and both remain plausible contributors to the observed shift.”


Team evaluates CMIP6 climate models that simulate multiyear El Niño events


Focused on El Niño events and spring precipitation over southern China


Ocean-Land-Atmosphere Research (OLAR)

Schematic Framework for CMIP6 Evaluation of Multiyear El Niño and Spring Precipitation over Southern China 

image: 

This graphical abstract summarizes the evaluation of CMIP6 historical simulations in representing multiyear El Niño events and their impacts on spring precipitation over southern China. While most models reproduce the occurrence of multiyear El Niño events, notable biases remain in their frequency, duration, and associated precipitation patterns. The E3SM-1-0 model shows relatively better performance, capturing the observed precipitation increase linked to realistic moisture transport and uplift processes.

view more 

Credit: Zhang X, Zhong W, Li Q, Hu X, Li M, Kong Y.


A research team has evaluated a collection of climate models to better understand how well they can simulate multiyear El Niño events and their impact on spring precipitation over southern China. Their study showed that while many climate models can reproduce the multiyear El Niño events, most of them struggle to simulate their impacts on southern China’s spring precipitation.


Their work is published in the journal Ocean-Land-Atmosphere Research on December 16, 2025.

Multiyear El Niño events have become more frequent in recent decades. They impact the climate in markedly different ways than single year El Niño events. El Niño is one phase of the larger El Niño-Southern Oscillation, a recurring climate pattern in the tropical Pacific Ocean.


The spring precipitation over southern China following multiyear El Niño events is greater than the precipitation during single-year events. Yet the ability of current climate models to simulate these events and their associated regional impact is uncertain. “The core problem was that it remained unclear whether current CMIP6 climate models could accurately simulate these multi-year events and, more importantly, capture the related atmospheric circulation and precipitation responses over southern China during the second year of these events,” said Xiaoman Zhang, a master’s student at Sun Yat‐sen University and Southern Marine Science and Engineering Guangdong Laboratory.


The research team undertook their study using 39 Coupled Model Intercomparison Project Phase 6 (CMIP6) models. These CMIP6 models are a group of advanced global climate models that come from research centers around the world. They simulate past and future climate change. “We aimed to better understand how well current CMIP6 climate models can simulate multiyear El Niño events and their associated impacts on spring precipitation over southern China,” said Xiaoming Hu, a professor at Sun Yat-sen University, and Southern Marine Science and Engineering Guangdong Laboratory. The team assessed the performance of the 39 CMIP6 models in simulating multiyear El Niño events. Their study covers the period from 1950 to 2014, studying the spring precipitation in the following years.


Southern China is a densely populated and economically developed region that is vulnerable to frequent droughts and floods. The spring precipitation there accounts for more than 30 percent of the total annual precipitation in the region. The variability of the spring rainfall from year to year increases the risks of drought and flood. This variability presents challenges for farming and water resources management.


The team’s evaluation of the 39 CPMIP6 models showed that most models can capture the general occurrence of multiyear El Niño events and their impact on spring precipitation over southern China. However, the climate models are not as successful in reproducing the associated spring precipitation anomalies.


The team did note that the Energy Exascale Earth System Model version 1.0 (E3SM-1-0) is the only model that reproduces the observed increase in precipitation over southern China and simulates realistic water vapor transport and convergence-related uplift. However, even that model fails to accurately simulate the large-scale circulation anomalies connected with these events.


Only a few models were able to capture both the observed precipitation pattern and the associated large-scale circulation anomalies, such as changes in the western North Pacific anticyclone. This indicates substantial inter-model differences in representing the underlying physical mechanisms. As a result, uncertainties in simulating multiyear El Niño teleconnections may limit the reliability of regional climate projections and seasonal predictions based on current climate models.


“The key message of this study is that while many CMIP6 models can reproduce the occurrence of multiyear El Niño events, most of them struggle to realistically simulate their impacts on spring precipitation over southern China,” said Meng Li, a meteorological engineer at Handan Meteorological Bureau.


Looking ahead, the team wants to investigate the physical mechanisms responsible for the model performance differences, particularly why some models outperform others in simulating multiyear El Niño impacts. This would include examining air-sea coupling processes, tropical Pacific sea surface temperature evolution, and atmospheric circulation responses. “Ultimately, our goal is to improve the representation of multiyear El Niño-Southern Oscillation events and their teleconnections in climate models. This work will help provide more reliable climate information for assessing regional impacts, reducing disaster risks, and supporting climate adaptation, particularly in East Asia,” said Zhang.


The team includes Xiaoman Zhang, Wenxiu Zhong, and Xiaoming Hu, Sun Yat-sen University and Southern Marine Science and Engineering Guangdong Laboratory; Qingquan Li, National Climate Centre, Beijing, and Nanjing University of Information Science and Technology; Meng Li, Handan Meteorological Bureau; and Yunqi Kong, Guangdong Ecological Meteorological Centre.


This research is funded by the Southern Marine Science and Engineering Guangdong Laboratory (Zhuhai).


Scientists trace microplastics in fertilizer from fields to the beach


First steps in tracing major pollutant source in “missing plastics” problem


Tokyo Metropolitan University

Fate of microplastics in PCFs. 

image: 

Fate of microplastics in PCFs. Of polymer-coated fertilizer capsules used in paddies, 77% stay there and only 0.2% are estimated to end up on the beach, leaving 22.8% “missing” plastic waste.

view more 

Credit: Tokyo Metropolitan University


Tokyo, Japan – Researchers from Tokyo Metropolitan University have studied how polymer-coated fertilizer (PCF) applied to fields ends up on beaches and in the sea. They studied PCF deposits on beaches around Japan, finding that only 0.2% of used PCFs are washed into rivers and returned to the coastline. When there are canals connecting fields to the sea, this rises to 28%. Their findings highlight a potentially significant “sink” in the global circulation of plastics.


Plastic marine pollution poses a serious threat to wildlife, ecosystems, and human health. It is estimated that around 90% of the plastic that has flowed out to sea has disappeared from the sea surface, accumulated on the sea floor or any number of other “sinks.” To effectively reduce the amount of “missing plastics,” scientists have been studying the complex ways by which plastic material is transported from its point of use to the sea.

Polymer-coated fertilizer (PCF) is a major source of microplastic pollution. Certain fertilizers are coated in a thin layer of plastic to delay the release of chemicals, making it last longer. They are widely used in Japan and China for rice cultivation, as well as for wheat, corn, and other crops in the U.S., U.K., and Western Europe. In fact, it has been shown that 50-90% of plastic debris found on beaches in Japan is derived from PCFs. Yet, the way in which PCFs are carried from land to sea, and how that affects its eventual disappearance, is not well understood.

A team of researchers from Tokyo Metropolitan University, led by Professor Masayuki Kawahigashi and Dr. Dolgormaa Munkhbat, surveyed the amount of PCFs ending up on beaches across different environments. They focused on beaches near river mouths and direct drainage points from agricultural fields to the sea, surveying 147 plots across 17 beaches. Near river mouths, they estimated that the PCFs found on beaches there amount to less than 0.2% of what was used in surrounding areas. With 77% staying on fields, the remaining 22.8% wash out to sea. On the other hand, surveys around direct drainage points from agricultural land to the sea showed that 28% end up back on the beach. The team concluded that waves and tidal action help them wash back onto land, making beaches a temporary sink for microplastics. Given that most PCFs lost from fields end up in rivers, the majority of these plastic capsules end up going “missing.”

The team also noticed that many of the PCF microplastics they found showed significant reddening and browning. Analysis with Energy-Dispersive X-ray Spectroscopy (EDX) revealed newly added particles of iron and aluminum oxide, which may be weighing the capsules down, making them less likely to wash back to shore. While many challenges remain in understanding the complex transport of a major pollutant, the team’s survey is a key first step in tracing how PCFs contribute to the global challenge of missing plastics.