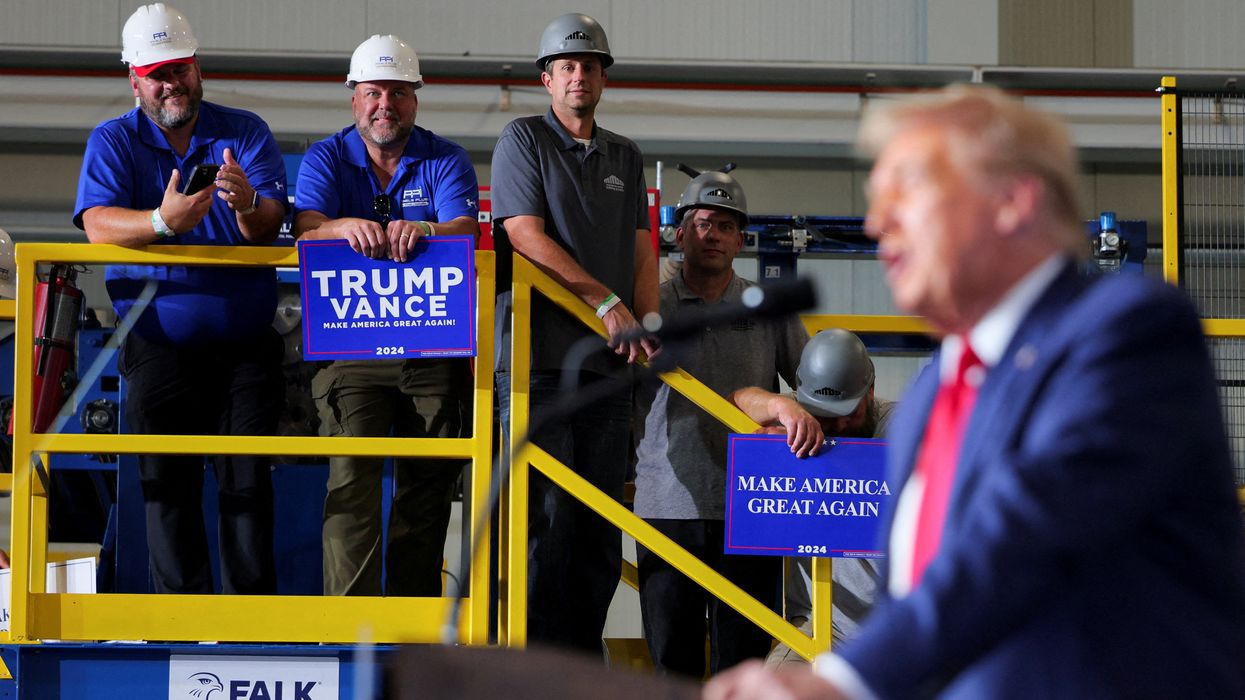
Donald Trump as he makes a campaign stop at manufacturer FALK Production in Walker, Michigan, U.S. September 27, 2024. REUTERS/Brian Snyder
President Donald Trump has tried to make big claims about saving the economy and creating jobs, but one prominent economist has torched those claims with one brutally simple graph.
Steve Rattner is a prominent investor and MS NOW economic analyst, who also previously served as the lead adviser for former President Barack Obama's auto industry task force. In recent years, he has been highly critical of Trump's economic performance, often using clear data to demonstrate how wrong his claims have been.
On Monday, Rattner took to his official X account with a new graph, demonstrating how poor the job numbers have been under Trump, after inheriting a "strong labor market" from former President Joe Biden.
"President Trump inherited a strong labor market from President Biden," Rattner wrote. "Since his inauguration, average monthly job creation has fallen dramatically: from 122k/month in 2024 to 33k/month in 2025-26."
In the graph, Rattner compared the last year of Biden's term to the entirety of Trump's second one, so far. Overall, the average monthly numbers tracked downward as Trump's term wore on, with the monthly numbers only going into the negative once he was sworn in.
"This morning's jobs report was shockingly negative," Rattner wrote in a post from last week. "Not only did the economy lose 23,000 jobs in July — the previous estimates for May and June were revised down by 103,000. These numbers are a major red flag indicating the labor market is weaker than previously thought."
Trump and his allies, when they are not reflexively blaming Biden for most issues, have tried to claim that the DOGE layoffs were part of what drove less-than-ideal job numbers under his watch, while also claiming that major growth is just over the horizon. Critics, conversely, have attributed the decline to his erratic economic agenda, especially his tariffs.
On Friday, Rattner shared another graph, this time exposing the gradual decline of wage growth during Trump's second term, wiping out the gains workers were making before Biden left office. The start of his Iran war also led inflation to eclipse wage growth for the first time on the graph, which again dated back to the start of Biden's final year.
"Wage growth ticked below inflation again last month," Rattner explained. "That means Americans' average wages shrunk in real terms over the past year. Real wages were growing when Biden left office, but the trend flipped negative after Trump launched the Iran War.
July Job Report: Weak Job Growth and
Slowing Wages
Photo by Hennie Stander
The economy lost jobs for the first time since a weather-related drop in February. The unemployment rate edged down to 4.1 percent, but the decline was the result of people dropping out of the labor market in July. Employment as measured in the household survey fell by 87,000. Wage growth also slowed further to a year-over-year increase of 3.2 percent. That is down from a pace of more than 4.0 percent through 2023 and 2024.
The weakness in employment on the household side is driven by prime-age (ages 25 to 54) workers. Their employment-to-population ratio (EPOP) fell 0.6 percentage points (p.p.) in June to 80.2 percent. It recovered only 0.2 p.p. of this fall in July, leaving the rate 0.4 p.p. below the May level. All of this drop was due to a fall among prime-age men. Their EPOP fell 0.9 p.p. in June and only rose 0.1 p.p. in July leaving it at 85.8 percent, 0.8 p.p. below the May level. Women’s EPOP, at 75.2 percent, is the same as the May level.
July Fall, Coupled with Downward Revisions to May and June Data, Leave 3-Month Average at 20K
Job growth seems to again be on a very slow track. The July decline was driven by a 49,600 drop in local government education, which is most likely a seasonal adjustment issue. But even pulling out government, private sector employment growth averaged just 40,000 over the last three months.
That may be close to the breakeven pace given near zero immigration and the retirement of baby boomers, but the further slowing of wage growth indicates serious labor market weakness. With inflation at 3.5 percent over the last year, wages are not even keeping pace.
Health Care and Social Assistance Continue to Lead Job Growth
The health care and social assistance sector added 22,600 jobs, with all but 600 of those in health care. Restaurant jobs fell by 26.1K in July after dropping 12.1K in June, despite the World Cup. Restaurant employment is now 123K above its year-ago level, an average gain of 10K a month. Even this growth is somewhat surprising since real sales are up by less than 0.3 percent year-over-year as of June.
Employment in the amusement, gambling, and recreation category fell by 10.1K in July, leaving it 11.8K below its year ago. This may be an indicator of how people are feeling about the economy since these are largely discretionary expenditures.
Motion pictures added 9.9K jobs, only the second monthly gain in the last two and a half years. Employment in the sector is still down by 22.3K (6.3 percent) over the last year. Insurance again lost jobs, shedding 6.7K in the month. This could be an AI story. Insurance jobs are down 81K (2.7 percent) over the last year.
Goods Sector Employment Shows Modest Gains
Construction added 22,000 jobs in July, but that follows three months where the average gain was just 3K. Also, the prior two months numbers were revised down by 10K with the July report. This is more likely a random jump than an indication of faster job growth, especially since the data on both residential and non-residential construction continue to be weak.
Manufacturing added 5K jobs, its second consecutive gain. Employment in the sector is still down 14K over the last year. Manufacturing of durables is doing somewhat better, adding 18K jobs in July after adding 12K in June. Employment in the sector is up 35K (0.4 percent) over the last year. Employment in non-durable manufacturing has fallen by 49K over the last year, with food processing taking the biggest hit with a decline of 20.5K.
The jump in oil prices has not led to a boom in employment in the industry. Jobs fell by 0.5K in drilling and another 0.3K in support activities. Over the year employment in drilling is down by 2.6K, while rising 0.1K in support activities.
Women’s Employment Fell Due to the Drop in Local Education
After accounting for well over half of employment growth through the recovery, the number of jobs held by women fell by 32K in July. This is almost certainly due to the drop in employment in local government education and will be reversed in the next two months. The main factor driving disproportionate growth in women’s employment has been the outsize growth in the health care and social services sectors.

Employment Rate for College Grads Falls a Full Percentage Point
Last year it was striking that the deterioration in the labor market seemed to be almost entirely among disadvantaged groups, notably Black and young workers. Now the opposite appears to be the case. Unemployment for Black workers fell by 0.3 p.p. to 6.3 percent and is down 0.9 p.p. over the last year. Unemployment for young workers (ages 20-24) was steady at 7.1 percent in July but down by 0.8 p.p. over the last year.
By contrast, the EPOP for college grads fell by 1.0 PP to 68.8 percent in July and is down by 0.8 PP over the last year. As noted earlier, in the last two months there was a sharp decline in the EPOP for prime-age men.The EPOP for native-born workers is also down 0.9 p.p. year-over-year, while it is unchanged for foreign-born workers.
Duration Measures of Unemployment Show Improvement
The average and median duration of unemployment spells both fell, as did the share of long-term (more than 26 weeks) unemployment. While this would ordinarily be a positive sign, it is also consistent with some of the long-term unemployed dropping out of the labor force. That is also consistent with a 1.3 p.p. decline, to 34.2 percent, in the share of unemployment due to permanent layoffs.
Weak, But Not Terrible Report
It is important not to put too much weight on the job loss reported for July. This is almost certainly an issue of seasonal adjustments for public school teachers. The underlying rate of job growth is slow, but likely enough to keep pace with a slow-growing labor force.
The bigger cause for concern is the slowing of wage growth, even in the face of rising inflation. This suggests serious labor market weakness. This is both bad news for workers who are struggling to make ends meet, but also a bad story for the economy as a whole. An economy that is barely creating any jobs, and where real wages are falling, is heavily dependent on the spending of high-income people who spend based on gains in the stock market. That is not a sound basis for growth. On the plus side, we are not seeing much evidence, outside of the insurance sector, of an AI-caused crash in employment.
This first appeared on Dean Baker’s Beat the Press blog.

No comments:
Post a Comment