This month the Big Mac index turns 40. The Economist launched it in September 1986 as a joke with a serious point: if a burger costs $6.22 in New York and the equivalent of $2.45 in Mumbai, then either the rupee is badly undervalued or the dollar measures something other than what people can actually afford. Four decades on, the burger has become the most famous shorthand for purchasing power parity (PPP), the economists’ attempt to compare living standards once you strip out the distortions of market exchange rates.
IntelliNews has taken the joke one step further. Imagine that dollars, euros and rubles did not exist and that everyone was paid, taxed and priced in Big Macs. A country’s GDP would be counted in burgers. Wages would be counted in burgers. A kilogram of potatoes, an iPhone and a new Lada would all carry a burger price tag. What would the world economy look like?
The answer is that the burger turns the rankings upside down, and then halfway back again. Anything grown and sold locally, such as rice, potatoes and a flat in town, is cheap in burger money in the poorer countries, so an Indian or Egyptian household looks far better off than its dollar income suggests. Anything that trades at a world price, such as an iPhone or an imported car, costs the same in dollars everywhere, so in burger money it is ruinously expensive exactly where people are poorest. Burger money flatters you at the market stall and humiliates you at the Apple store.
Two ways to count the world economy
Start with the conventional numbers. The IMF’s April 2026 World Economic Outlook ranks economies two ways. Nominal GDP converts local output into dollars at market exchange rates. GDP at PPP adjusts for the fact that a dollar goes much further in Delhi than in Dallas. The two lists overlap heavily, but the order changes a lot. China is already the biggest economy in the world at PPP, at $44.3 trillion against America’s $32.4 trillion. India jumps from sixth to third. Russia rises from ninth to fourth, ahead of Japan and Germany, while Indonesia and Turkey, 17th and 16th in dollars, break into the PPP top 15.
The last column of Table 1 is the key to what follows. It shows how much further a dollar’s worth of local currency stretches at home, according to the IMF. In the US it is 1.0 by definition. In Egypt it is 6.0 and in India 4.6: a dollar changed into Egyptian pounds buys six times as much in Cairo as it does in Cleveland.
Table 1. Nominal v PPP GDP, 2026 estimates
Country | Nominal GDP $bn | Rank | PPP GDP $bn | Rank | GDP/head $ | PPP GDP/head $ | PPP / nominal |
US | 32,384 | 1 | 32,384 | 2 | 94,430 | 94,430 | 1.00 |
China | 20,852 | 2 | 44,295 | 1 | 14,874 | 31,596 | 2.12 |
Germany | 5,453 | 3 | 6,408 | 6 | 65,303 | 76,747 | 1.18 |
Japan | 4,379 | 4 | 7,262 | 5 | 35,703 | 59,207 | 1.66 |
UK | 4,265 | 5 | 4,721 | 10 | 61,056 | 67,585 | 1.11 |
India | 4,153 | 6 | 18,902 | 3 | 2,813 | 12,801 | 4.55 |
France | 3,596 | 7 | 4,734 | 9 | 52,083 | 68,567 | 1.32 |
Italy | 2,738 | 8 | 3,872 | 12 | 46,505 | 65,761 | 1.41 |
Russia | 2,656 | 9 | 7,525 | 4 | 18,525 | 52,479 | 2.83 |
Brazil | 2,636 | 10 | 5,230 | 8 | 12,313 | 24,428 | 1.98 |
Canada | 2,507 | 11 | 2,911 | 16 | 60,305 | 70,006 | 1.16 |
Australia | 2,124 | 12 | 2,099 | 22 | 75,648 | 74,755 | 0.99 |
Mexico | 2,121 | 13 | 3,582 | 13 | 15,779 | 26,643 | 1.69 |
Spain | 2,091 | 14 | 2,978 | 15 | 41,563 | 59,187 | 1.42 |
South Korea | 1,931 | 15 | 3,541 | 14 | 37,412 | 68,624 | 1.83 |
Turkey | 1,640 | 16 | 4,025 | 11 | 19,018 | 46,672 | 2.45 |
Indonesia | 1,540 | 17 | 5,449 | 7 | 5,362 | 18,973 | 3.54 |
Saudi Arabia | 1,389 | 19 | 2,895 | 17 | 37,811 | 78,815 | 2.08 |
Egypt | 430 | >25 | 2,567 | 18 | 3,904 | 23,321 | 5.97 |
Nigeria | 377 | >25 | 2,424 | 19 | 1,556 | 9,994 | 6.42 |
Poland | 1,134 | 21 | 2,164 | 21 | 31,336 | 59,792 | 1.91 |
Source: IMF World Economic Outlook, April 2026 (2026 estimates). The countries are the union of the top 15 by nominal GDP and the top 15 at PPP, plus Saudi Arabia, Egypt, Nigeria and Poland, the next largest at PPP.
The burger exchange rate
The Big Mac index turns a burger into an exchange rate. Divide the local price by the American price and you get the “burger rate”, the exchange rate at which a Big Mac would cost the same everywhere. In July 2026 a Big Mac cost CNY26.50 in China and $6.22 in the US, which implies a burger rate of CNY4.26 to the dollar. The market rate this year has averaged CNY6.82, so by burger logic the yuan is 38% undervalued.
Table 2 applies the same arithmetic to every country and compares the burger rate with the average market rate so far in 2026. It also shows how far each currency has moved against the dollar since January 2, because the answer depends heavily on the day you ask. The euro countries are priced separately, using the national prices in The Economist’s source data rather than the euro-area average of EUR6.19, which is why Germany at EUR6.99 looks much more overvalued than France at EUR5.60.
Two countries need special handling. McDonald’s left Russia in 2022 and The Economist dropped it from the index; we use the RUB221 Big Hit sold by its successor, Vkusno i Tochka. India has never sold a beef Big Mac, so the index uses the chicken Maharaja Mac. Nigeria has no McDonald’s at all and drops out of the burger tables.
Table 2. The burger exchange rate v the market, 2026
Country | Big Mac, local | Burger rate (local per $) | 2026 avg market rate | Currency v $, Jan 2-Sep 25 | Over(+)/under(-) valued at 2026 avg | Range over 2026 |
US | $6.22 | 1.00 | 1.00 | +0.0% | +0.0% | - |
China | CNY26.50 | 4.26 | 6.82 | +4.2% | -37.6% | -39% to -36% |
Germany | EUR6.99 | 1.12 | 0.86 | -2.9% | +30.5% | +28% to +35% |
Japan | JPY500 | 80.39 | 159 | -0.3% | -49.3% | -51% to -47% |
UK | GBP5.49 | 0.88 | 0.74 | -1.6% | +18.7% | +16% to +22% |
India | INR236 | 37.98 | 93.93 | -6.1% | -59.6% | -61% to -58% |
France | EUR5.60 | 0.90 | 0.86 | -2.9% | +4.6% | +2% to +8% |
Italy | EUR6.56 | 1.05 | 0.86 | -2.9% | +22.5% | +20% to +27% |
Russia | RUB221 | 35.53 | 78.27 | -4.7% | -54.6% | -59% to -50% |
Brazil | BRL23.90 | 3.84 | 5.15 | +4.7% | -25.5% | -30% to -22% |
Canada | CAD8.17 | 1.31 | 1.39 | -2.9% | -5.2% | -8% to -3% |
Australia | AUD8.50 | 1.37 | 1.42 | +5.0% | -3.9% | -9% to -1% |
Mexico | MXN109 | 17.52 | 17.40 | +1.2% | +0.7% | -3% to +4% |
Spain | EUR5.90 | 0.95 | 0.86 | -2.9% | +10.2% | +8% to +14% |
South Korea | KRW5,700 | 916 | 1,463 | +5.6% | -37.4% | -41% to -32% |
Turkey | TRY325 | 52.25 | 45.69 | -12.1% | +14.4% | +7% to +22% |
Indonesia | IDR43,000 | 6,913 | 17,421 | -6.8% | -60.3% | -62% to -59% |
Saudi Arabia | SAR19.00 | 3.05 | 3.75 | +0.0% | -18.5% | -19% to -19% |
Egypt | EGP145 | 23.31 | 50.56 | -8.0% | -53.9% | -57% to -50% |
Poland | PLN23.50 | 3.78 | 3.68 | -6.5% | +2.8% | -2% to +8% |
Source: The Economist Big Mac index, July 2026 (national euro-area prices from its source file); Russia: Vkusno i Tochka Big Hit; India: Maharaja Mac. Exchange rates: exchange-rates.org daily data to September 25, 2026. The range shows the valuation at the currency’s weakest and strongest 2026 rates. bne IntelliNews calculations.
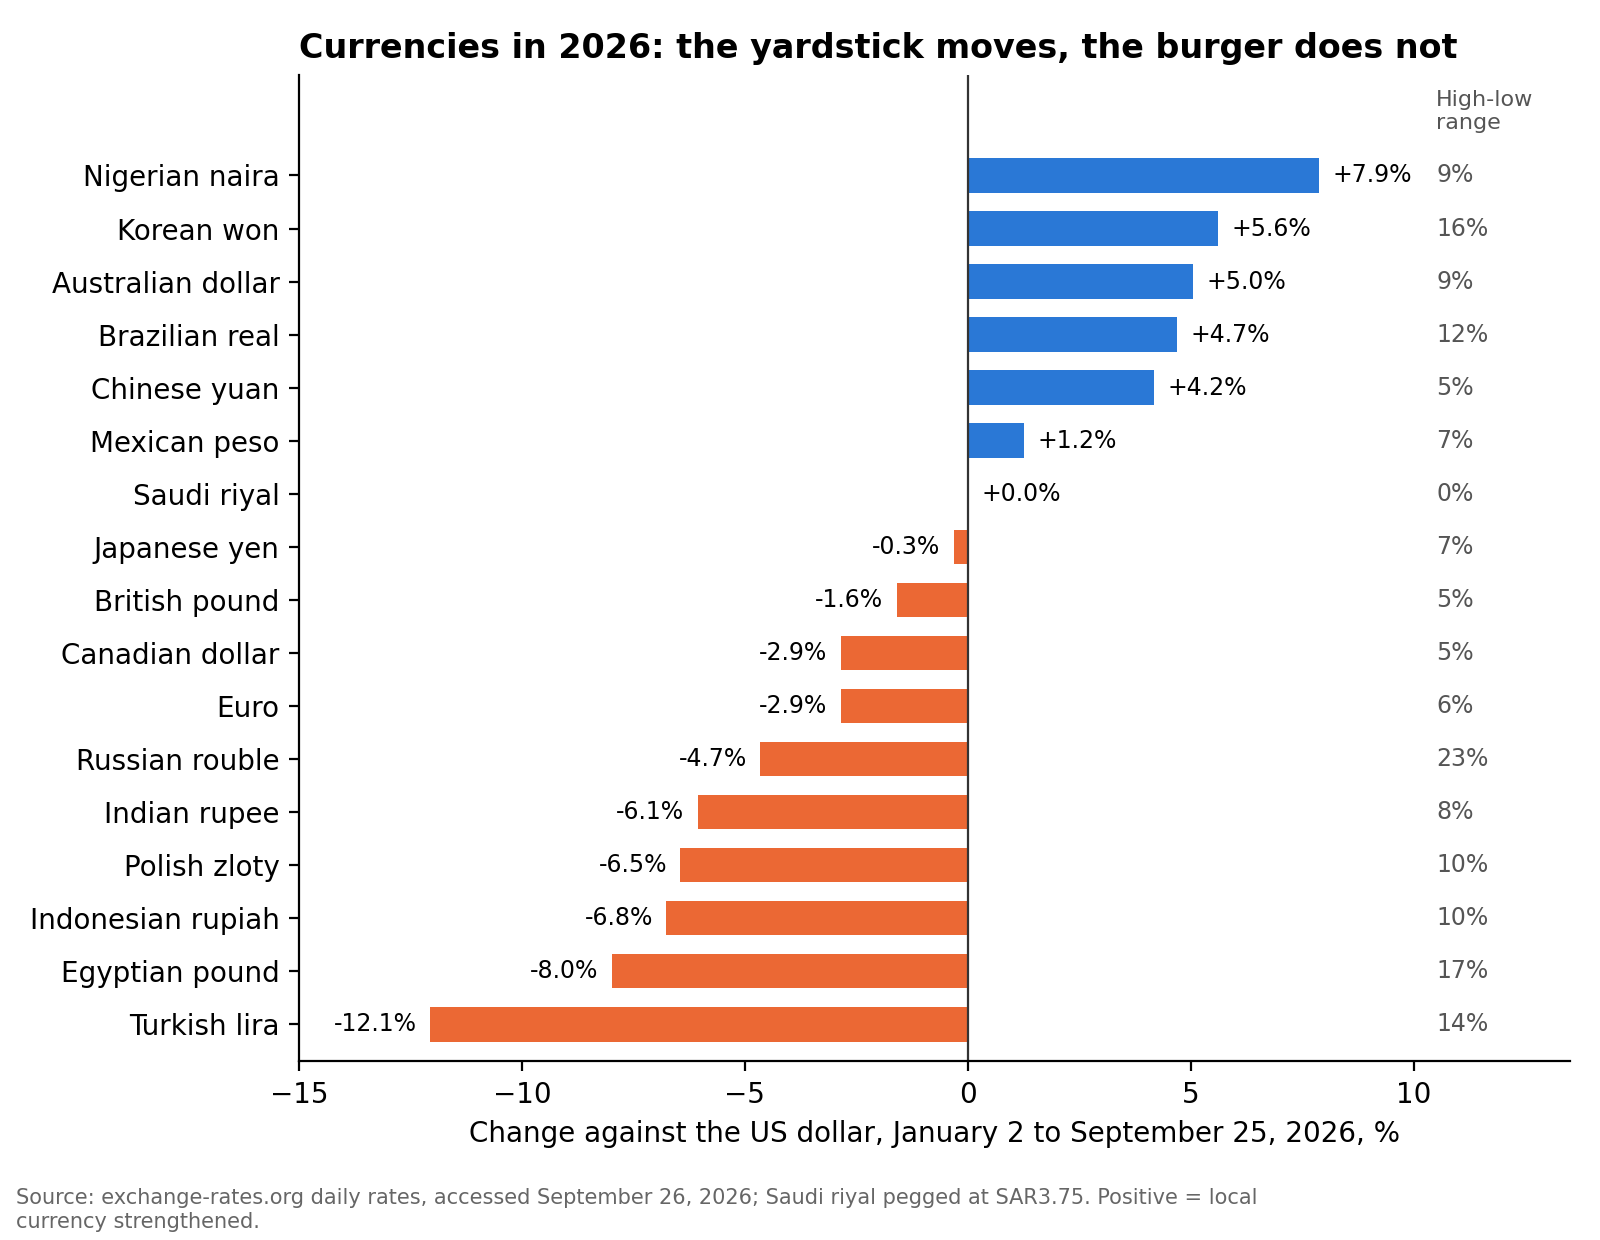
Chart 1. Most currencies have moved 5-10% against the dollar this year; the ruble swung 23% between its May high and its September low.
How much the exchange rate matters
Currency swings are exactly the noise burger money is designed to remove, and 2026 has been a noisy year. The Turkish lira has lost 12% against the dollar since January. The rupee, the rupiah, the zloty and the Egyptian pound have each lost 6-8%. The won, the Australian dollar, the real and the yuan have gained 4-6%. The ruble has been the most volatile: it strengthened to RUB70.85 per dollar in late May and then slid to RUB87.30 by early September, a 23% swing inside four months.
In dollar terms those swings reorder the league table without a single extra tonne of steel being made. At the exchange rates of January 2, India’s 2026 GDP comes to $4.33 trillion, putting it fifth, ahead of the UK. At September’s rates it is $4.07 trillion and back in sixth. Russia was ninth at January rates but has slipped to tenth behind Brazil, whose real has strengthened. At the ruble’s May peak Russia would have been the world’s eighth-largest economy, ahead of Italy, at $2.94 trillion. At its September low it would have been 11th, behind Canada, at $2.38 trillion. The same Russian economy was worth $550bn more or less depending on the week. Spain dropped from 12th to 15th between January and September, while Australia climbed from 14th to 12th. Turkey’s dollar GDP shrank by $210bn with no change in real output.
The burger ranking does not move at all when currencies move, because it never touches an exchange rate: local GDP is divided by the local price of a local burger. What does move it is the burger price itself. Between the January and July 2026 editions the US Big Mac rose from $6.12 to $6.22, and Turkish burger prices have risen 23-fold since 2020. Inflation can distort burger money; currency speculation cannot. That is its great virtue. Its weakness, discussed below, is that a burger is not a basket.
Table 3. How the exchange rate reorders the league table
Country | Nominal GDP at Jan 2 FX, $bn | Rank | At Sep 25 FX, $bn | Rank | At weakest 2026 FX | At strongest 2026 FX | Burger GDP rank (FX-proof) |
US | 32,384 | 1 | 32,384 | 1 | 32,384 | 32,384 | 2 |
China | 20,346 | 2 | 21,197 | 2 | 20,336 | 21,253 | 1 |
Germany | 5,505 | 3 | 5,348 | 3 | 5,331 | 5,643 | 6 |
Japan | 4,428 | 4 | 4,414 | 4 | 4,238 | 4,550 | 4 |
UK | 4,271 | 6 | 4,203 | 5 | 4,174 | 4,383 | 8 |
India | 4,334 | 5 | 4,071 | 6 | 4,027 | 4,341 | 3 |
France | 3,631 | 7 | 3,527 | 7 | 3,516 | 3,721 | 10 |
Italy | 2,764 | 8 | 2,686 | 8 | 2,677 | 2,834 | 13 |
Russia | 2,584 | 9 | 2,464 | 10 | 2,382 | 2,935 | 5 |
Brazil | 2,505 | 11 | 2,622 | 9 | 2,461 | 2,768 | 9 |
Canada | 2,528 | 10 | 2,456 | 11 | 2,440 | 2,574 | 12 |
Australia | 2,021 | 14 | 2,123 | 12 | 2,015 | 2,192 | 14 |
Mexico | 2,061 | 13 | 2,086 | 13 | 2,036 | 2,185 | 15 |
Spain | 2,111 | 12 | 2,051 | 15 | 2,045 | 2,164 | 16 |
South Korea | 1,959 | 15 | 2,068 | 14 | 1,812 | 2,109 | 11 |
Turkey | 1,741 | 16 | 1,531 | 16 | 1,531 | 1,744 | 18 |
Indonesia | 1,606 | 17 | 1,497 | 17 | 1,465 | 1,609 | 7 |
Saudi Arabia | 1,389 | 18 | 1,389 | 18 | 1,389 | 1,389 | 17 |
Egypt | 455 | 20 | 419 | 20 | 397 | 465 | 20 |
Nigeria | 360 | 21 | 388 | 21 | 357 | 391 | - |
Poland | 1,161 | 19 | 1,086 | 19 | 1,082 | 1,194 | 19 |
Local-currency GDP is taken as the IMF dollar estimate converted at the 2026 year-to-date average rate, then reconverted at each date. Ranks are within these 21 countries. Source: IMF WEO April 2026; exchange-rates.org; bne IntelliNews calculations.
The world economy in burgers
Now convert every economy into burgers. Divide each country’s local-currency GDP by its local Big Mac price and multiply by the American price, so that the result reads in “burger dollars”. Chart 2 and Table 4 show the result.
China edges past the US to become the biggest burger economy in the world, at $33.4 trillion of burger dollars against $32.4 trillion. India comes third at $10.3 trillion. Japan is the big mover: its Big Mac costs just JPY500, half the American price at market rates, the cheapest burger in the rich world, so Japan’s burger GDP of $8.6 trillion is almost double its dollar GDP and more than the IMF’s PPP estimate. Russia rises to fifth. Germany falls to sixth and shrinks: its EUR6.99 Big Mac is 30% dearer than an American one, so in burger money Germany’s economy is smaller than in dollars. Turkey is the most striking case. At TRY325 its Big Mac costs more than an American one, so burger money gives Turkey no PPP bonus at all, although the IMF says a dollar goes 2.5 times further there.
The burger is a half-hearted version of PPP. For rich countries it tracks the IMF numbers closely. For poor countries it captures only part of the gap. By the IMF’s reckoning a dollar goes six times as far in Egypt; by burger reckoning barely twice as far. The reason is that in Cairo, Jakarta or Mumbai a Big Mac is not a cheap everyday meal but a modest middle-class treat, priced for air-conditioned malls and paid for partly in imported beef, buns and franchise fees. The burger is too expensive to be a fair yardstick for the poorest.
In burgers per person the gap between rich and poor narrows but does not close. The average American’s share of national output is worth 15,182 Big Macs a year, or 42 a day. An Indian’s share buys 1,118 a year, barely three a day; an Egyptian’s 1,361. A Russian’s share of national output, 6,561 burgers a year, puts Russia level with Italy and Spain in burger money, where in dollars it sits alongside Mexico and China.
Table 4. GDP in burger money, 2026
Country | Nominal GDP $bn | Rank | Burger GDP, burger $bn | Rank | IMF PPP GDP $bn | Rank | Big Macs per head per year | Per day |
China | 20,852 | 2 | 33,400 | 1 | 44,295 | 1 | 3,830 | 10.5 |
US | 32,384 | 1 | 32,384 | 2 | 32,384 | 2 | 15,182 | 41.6 |
India | 4,153 | 6 | 10,271 | 3 | 18,902 | 3 | 1,118 | 3.1 |
Japan | 4,379 | 4 | 8,637 | 4 | 7,262 | 5 | 11,321 | 31.0 |
Russia | 2,656 | 9 | 5,852 | 5 | 7,525 | 4 | 6,561 | 18.0 |
Germany | 5,453 | 3 | 4,178 | 6 | 6,408 | 6 | 8,044 | 22.0 |
Indonesia | 1,540 | 17 | 3,880 | 7 | 5,449 | 7 | 2,172 | 6.0 |
UK | 4,265 | 5 | 3,593 | 8 | 4,721 | 10 | 8,269 | 22.7 |
Brazil | 2,636 | 10 | 3,536 | 9 | 5,230 | 8 | 2,655 | 7.3 |
France | 3,596 | 7 | 3,439 | 10 | 4,734 | 9 | 8,008 | 21.9 |
South Korea | 1,931 | 15 | 3,083 | 11 | 3,541 | 14 | 9,603 | 26.3 |
Canada | 2,507 | 11 | 2,644 | 12 | 2,911 | 16 | 10,223 | 28.0 |
Italy | 2,738 | 8 | 2,235 | 13 | 3,872 | 12 | 6,104 | 16.7 |
Australia | 2,124 | 12 | 2,209 | 14 | 2,099 | 22 | 12,650 | 34.7 |
Mexico | 2,121 | 13 | 2,105 | 15 | 3,582 | 13 | 2,518 | 6.9 |
Spain | 2,091 | 14 | 1,898 | 16 | 2,978 | 15 | 6,065 | 16.6 |
Saudi Arabia | 1,389 | 19 | 1,705 | 17 | 2,895 | 17 | 7,463 | 20.4 |
Turkey | 1,640 | 16 | 1,434 | 18 | 4,025 | 11 | 2,673 | 7.3 |
Poland | 1,134 | 21 | 1,104 | 19 | 2,164 | 21 | 4,902 | 13.4 |
Egypt | 430 | >25 | 932 | 20 | 2,567 | 18 | 1,361 | 3.7 |
Burger GDP = local-currency GDP / local Big Mac price x US Big Mac price ($6.22). Nominal and PPP ranks are global IMF ranks. Source: IMF WEO April 2026; The Economist Big Mac index, July 2026; bne IntelliNews calculations.
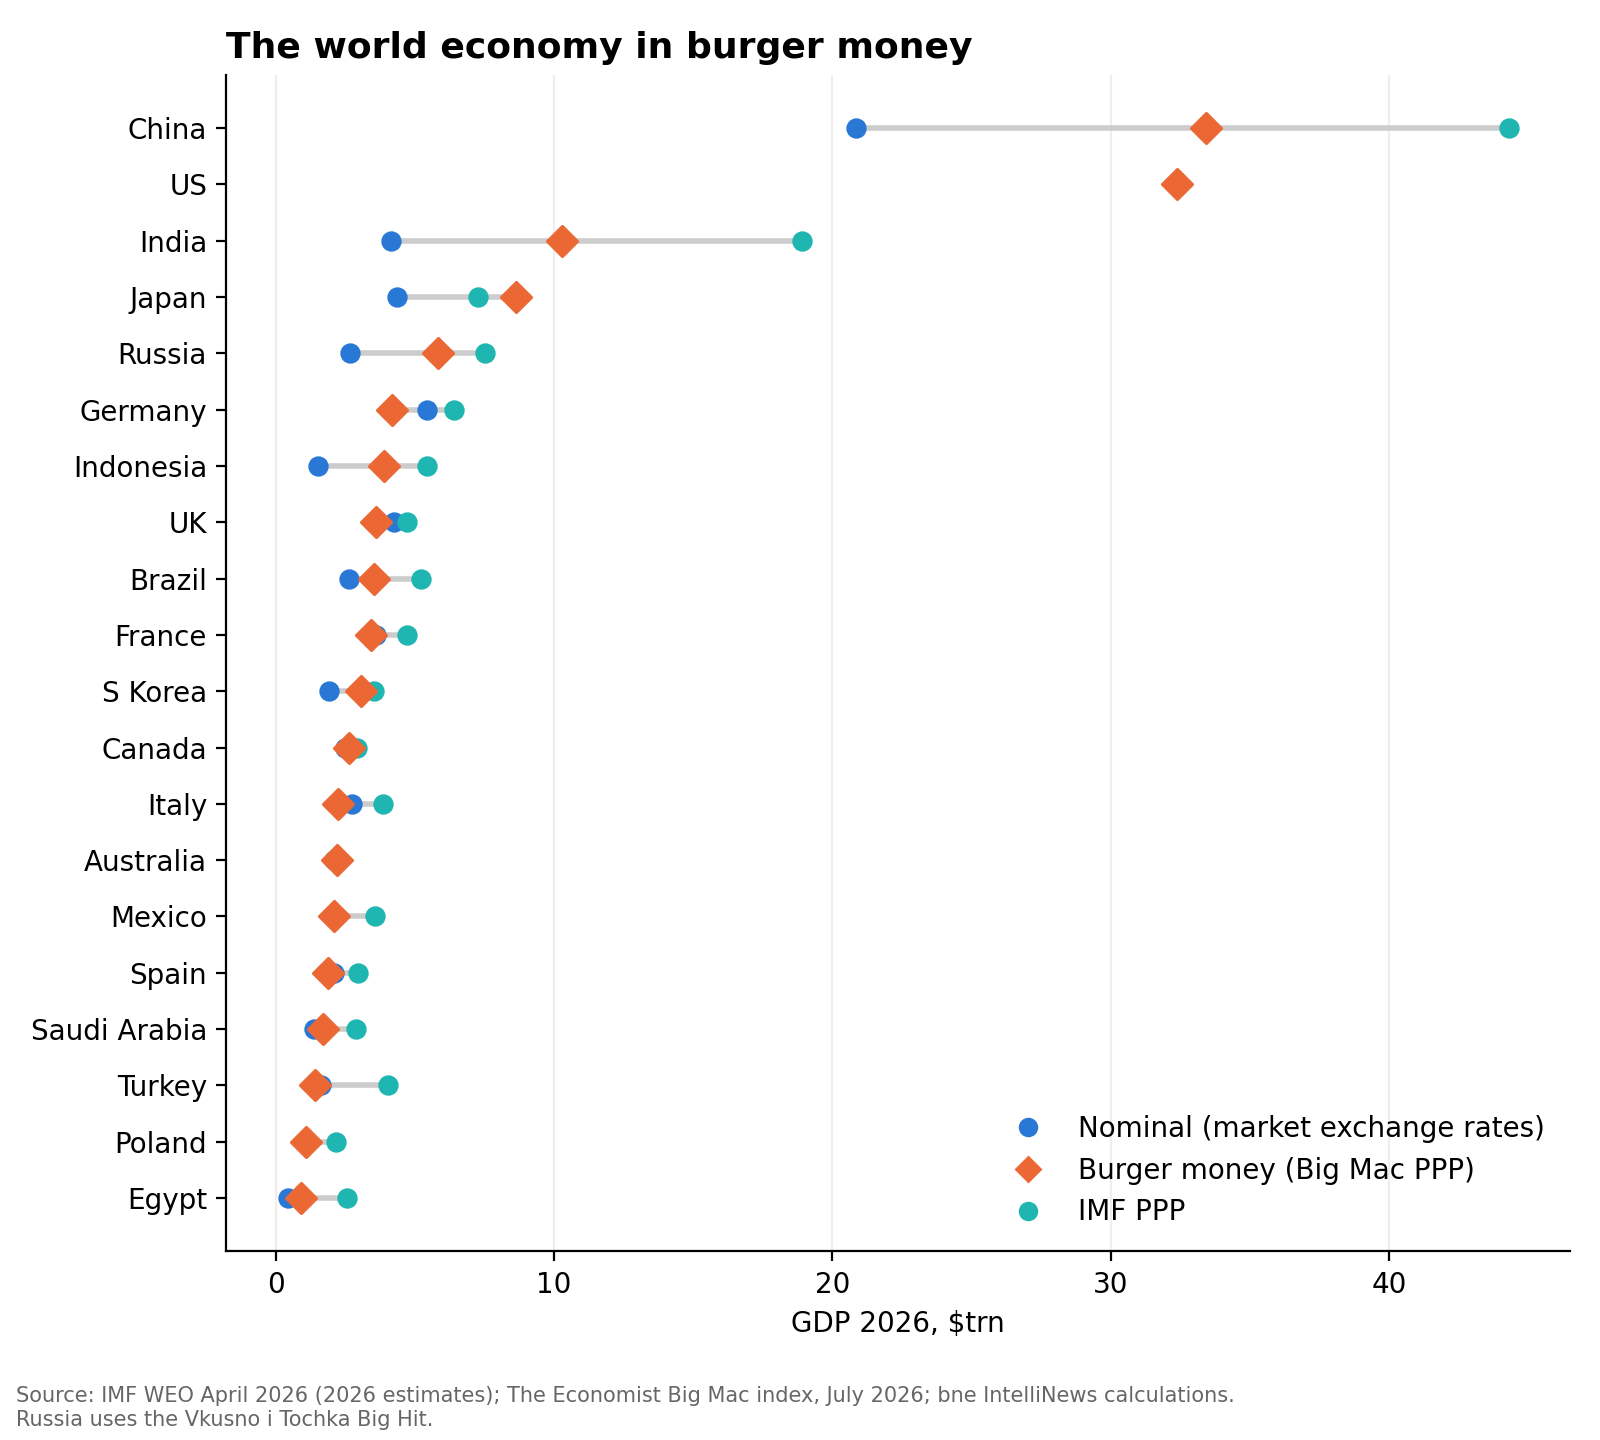
Chart 2. Burger money pulls the emerging markets up towards their IMF PPP values, but only part of the way.
Who wants to be a burger millionaire?
Being a millionaire means very different things in different currencies. Table 5 shows how many Big Macs a local-currency millionaire can buy, and how many an American dollar millionaire could buy after changing the money at today’s exchange rate.
A dollar millionaire can buy 160,772 Big Macs at home. A British pound millionaire does better, with 182,149, and a euro millionaire in France 178,571. A ruble millionaire, by contrast, can afford 4,525 Big Hits, a yen millionaire 2,000 burgers and a won millionaire only 175. In Indonesia almost everyone is a millionaire: a million rupiah buys 23 Big Macs, enough for a month of lunches but hardly a fortune.
The more interesting column is the last one. Take $1mn to Jakarta and change it into rupiah, and you can buy 416,605 Big Macs, two and a half times as many as at home. The same million buys 405,578 burgers in India and 381,842 Big Hits in Russia. That is the burger version of an undervalued currency: an arbitrage opportunity for anyone paid in dollars and eating in rupiah. Only in the UK, the euro countries and Turkey does the dollar millionaire lose out, because their burgers are dearer than America’s.
Table 5. How many Big Macs can a millionaire buy?
Country | Currency | Big Macs for 1mn in local currency | Big Macs for $1mn changed at Sep 25 rate | v a dollarmnaire at home |
Indonesia | IDR | 23 | 416,605 | 2.59x |
India | INR | 4,233 | 405,578 | 2.52x |
Russia | RUB | 4,525 | 381,842 | 2.38x |
Egypt | EGP | 6,897 | 357,528 | 2.22x |
Japan | JPY | 2,000 | 314,590 | 1.96x |
China | CNY | 37,736 | 253,328 | 1.58x |
South Korea | KRW | 175 | 239,637 | 1.49x |
Brazil | BRL | 41,841 | 216,787 | 1.35x |
Saudi Arabia | SAR | 52,632 | 197,368 | 1.23x |
Canada | CAD | 122,399 | 173,097 | 1.08x |
Australia | AUD | 117,647 | 167,282 | 1.04x |
Poland | PLN | 42,553 | 163,374 | 1.02x |
Mexico | MXN | 9,174 | 162,239 | 1.01x |
US | $ | 160,772 | 160,772 | 1.00x |
France | EUR | 178,571 | 156,757 | 0.98x |
Turkey | TRY | 3,077 | 150,592 | 0.94x |
Spain | EUR | 169,492 | 148,786 | 0.93x |
UK | GBP | 182,149 | 137,432 | 0.85x |
Italy | EUR | 152,439 | 133,817 | 0.83x |
Germany | EUR | 143,062 | 125,585 | 0.78x |
Source: The Economist Big Mac index, July 2026 local prices (Russia: Big Hit RUB221); exchange-rates.org, September 25, 2026; bne IntelliNews calculations.
The burger shopping basket
So, what can you buy with your burger money? We priced three staples in every country: 10kg of sugar, 10kg of potatoes and 10kg of rice. The thinking was that potatoes and rice are grown locally and so should be cheap in poorer countries, while sugar is an internationally traded commodity with a roughly common world price, and so should be relatively expensive wherever wages are low.
The data broadly bear this out, with some surprises. In dollars the retail price of a kilogram of sugar varies about fourfold across our 20 countries, from $0.68 in India to $2.71 in Japan. Potatoes vary elevenfold, from $0.40 in India to $4.40 in South Korea, and rice nearly eightfold, from $0.73 in India to $5.60 in Japan. The more local the product, the wider the price range.
Translate into burgers and the pattern sharpens. In India 10kg of potatoes costs 1.6 Big Macs but 10kg of sugar costs 2.8, almost twice as much. In the US it is the other way round: potatoes cost 5.3 Big Macs and sugar 3.1. In Egypt potatoes cost 1.6 burgers and sugar 2.9. In Turkey 10kg of potatoes costs less than one Big Mac. The traded good costs relatively more where people are poor, and the home-grown food relatively less.
The most expensive basket in burger money is Japan’s, at 36 Big Macs, and almost half of that is rice. Japan protects its rice farmers with steep tariffs and suffered a rice shortage that roughly doubled prices in 2025; 10kg of rice costs 17.6 Big Macs there, against 2.7 in China and 3.0 in India. South Korea, another rice-protecting Asian economy with expensive farmland, comes second at 23.9 burgers.
The cheapest baskets are in Turkey (6.2 burgers), Poland (6.7), Egypt (7.2) and India (7.3). Russia, at 17.2 burgers, is slightly dearer than the US: its cheap Big Hit makes everything else look expensive, and 10kg of sugar costs 7.4 burgers, more than anywhere except Japan.
Table 6. The burger basket: what 10kg of staples costs in Big Macs
Country | Sugar $/kg | Potatoes $/kg | Rice $/kg | 10kg sugar, Big Macs | 10kg potatoes, Big Macs | 10kg rice, Big Macs | Basket, Big Macs |
Turkey | $1.02 | $0.63 | $2.49 | 1.5 | 0.9 | 3.7 | 6.2 |
Poland | $1.43 | $0.98 | $1.68 | 2.3 | 1.6 | 2.7 | 6.7 |
Egypt | $0.81 | $0.44 | $0.76 | 2.9 | 1.6 | 2.7 | 7.2 |
India | $0.68 | $0.40 | $0.73 | 2.8 | 1.6 | 3.0 | 7.3 |
Spain | $1.14 | $2.09 | $1.88 | 1.7 | 3.1 | 2.8 | 7.6 |
UK | $1.46 | $2.02 | $2.50 | 2.0 | 2.8 | 3.4 | 8.2 |
Brazil | $1.11 | $1.33 | $1.43 | 2.4 | 2.9 | 3.1 | 8.4 |
Germany | $1.14 | $1.71 | $4.06 | 1.4 | 2.1 | 5.1 | 8.7 |
Mexico | $1.88 | $2.38 | $2.05 | 3.1 | 3.9 | 3.3 | 10.3 |
Saudi Arabia | $1.25 | $1.52 | $2.49 | 2.5 | 3.0 | 4.9 | 10.4 |
France | $1.14 | $2.59 | $3.02 | 1.8 | 4.1 | 4.7 | 10.6 |
Italy | $2.28 | $2.28 | $3.40 | 3.0 | 3.0 | 4.5 | 10.6 |
China | $2.65 | $0.84 | $1.08 | 6.7 | 2.1 | 2.7 | 11.6 |
Australia | $1.26 | $3.22 | $2.60 | 2.1 | 5.4 | 4.4 | 11.8 |
Indonesia | $0.98 | $1.45 | $0.97 | 4.1 | 6.0 | 4.0 | 14.2 |
Canada | $1.20 | $3.00 | $4.08 | 2.1 | 5.2 | 7.1 | 14.3 |
US | $1.90 | $3.30 | $5.22 | 3.1 | 5.3 | 8.4 | 16.8 |
Russia | $1.95 | $0.88 | $1.68 | 7.4 | 3.4 | 6.4 | 17.2 |
South Korea | $1.81 | $4.40 | $3.83 | 4.3 | 10.5 | 9.1 | 23.9 |
Japan | $2.71 | $3.12 | $5.60 | 8.5 | 9.8 | 17.6 | 36.0 |
Source: Numbeo market prices, September 2026; sugar: GlobalProductPrices, January 2026; The Economist Big Mac index, July 2026; bne IntelliNews calculations. Dollar prices at late-September exchange rates.
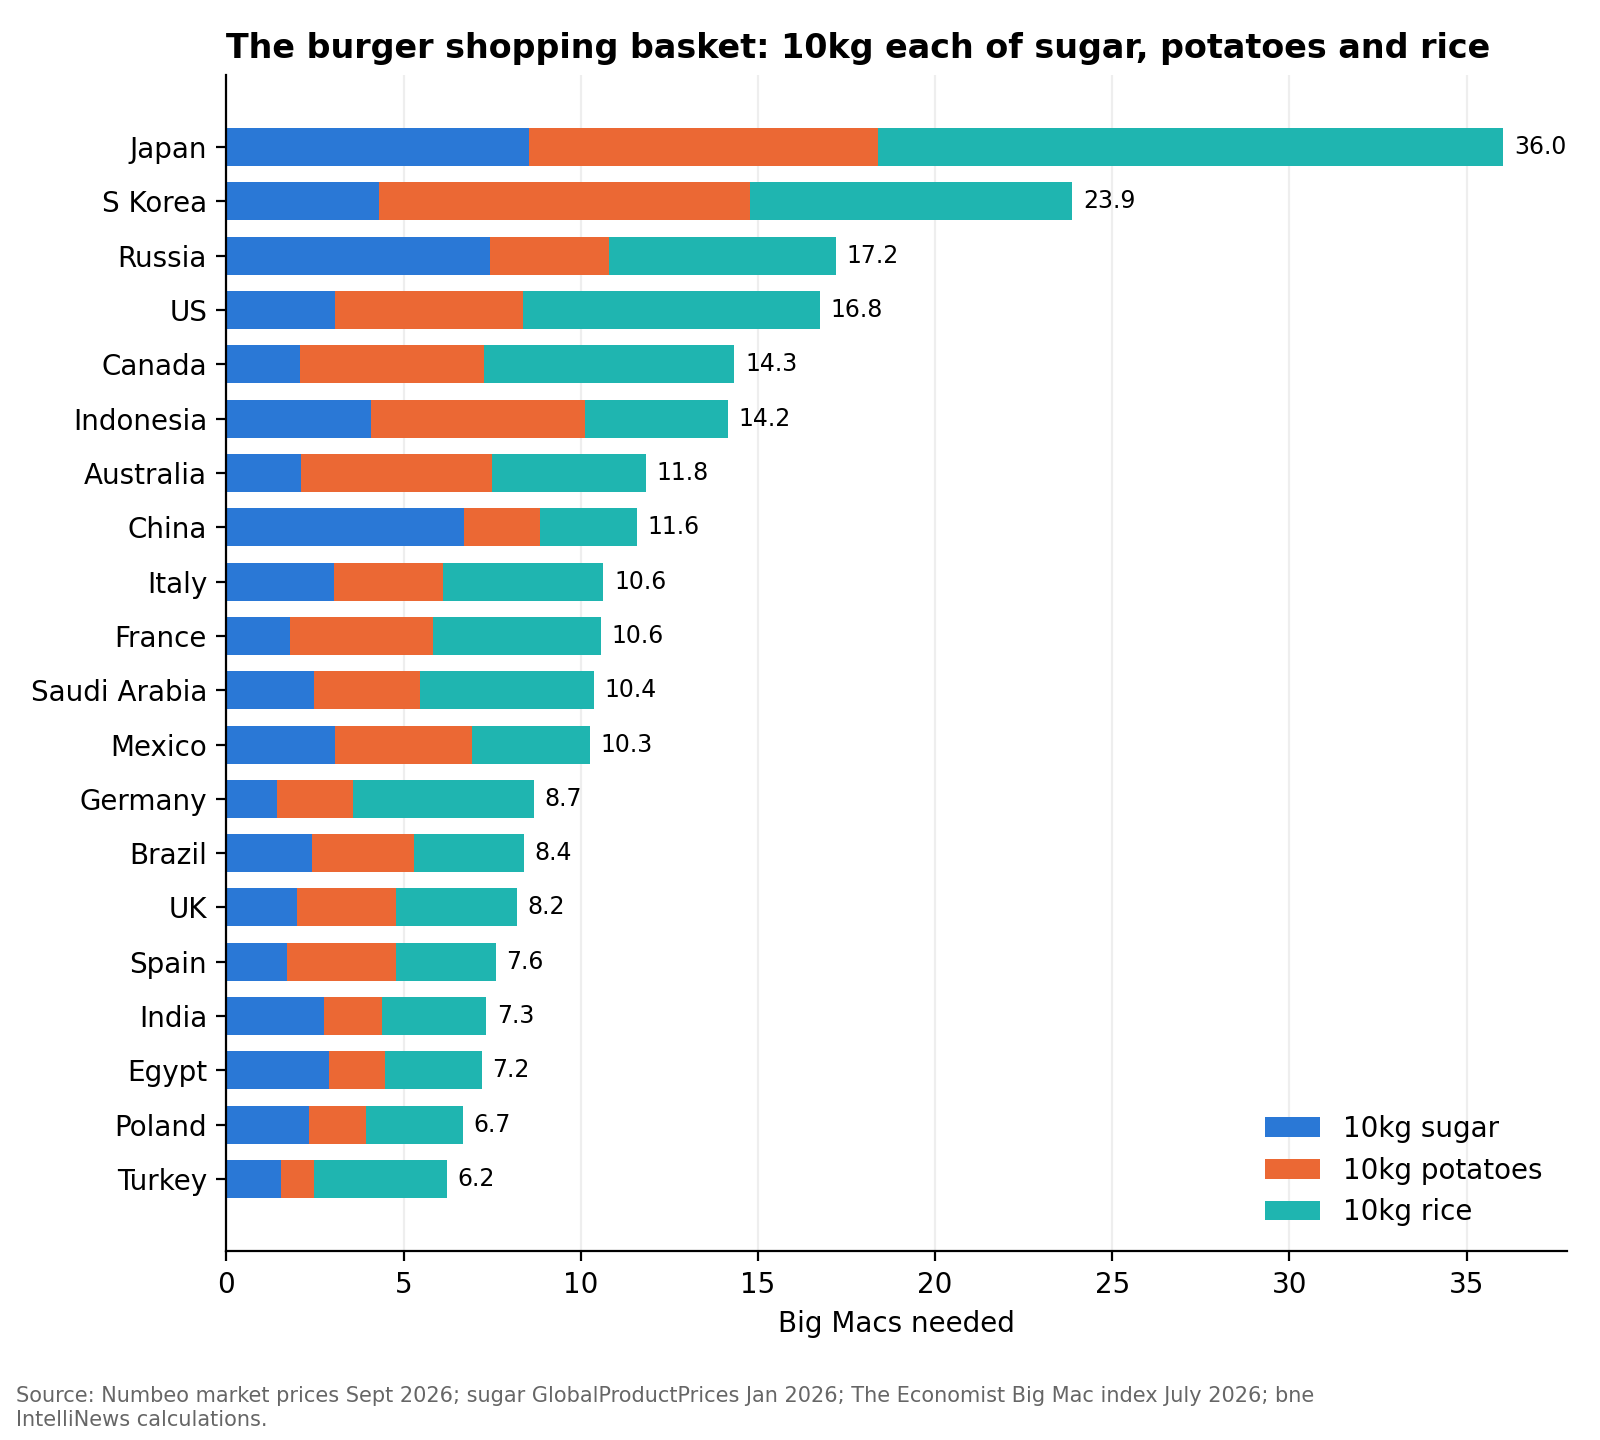
Chart 3. Japan’s expensive rice makes its burger basket the dearest; Turkey’s cheap potatoes make its basket the cheapest.
The iPhone test: where burger money runs out
Imported manufactured goods are where the burger world becomes brutal. An iPhone 17 with 256GB of storage costs between $929, in the US after Apple raised the price by $100 on September 9, and about $2,044 in Turkey, where taxes and duties push the price up. That is barely a twofold range, narrower even than for sugar. Apple sets what is in effect a world price.
In burger money it is anything but uniform. An American pays 149 Big Macs for the phone and a German 157. An Indian pays 423 Big Macs, an Indonesian 413 and an Egyptian 534, three and a half times as many burgers as an American. Measured against the average monthly salary the gap is starker still: the iPhone costs a US worker a fifth of a month’s take-home pay, a Brazilian 2.7 months, an Indonesian 3.3 months and an Egyptian almost nine months. A Nigerian on the average net wage would have to work for more than 11 months.
Russia offers the exception that proves the rule. Apple left in 2022, but iPhones still arrive through “parallel imports” via Central Asia and the Gulf. The street price of about RUB55,000 ($652) is well below the US list price, because grey importers pay no Apple margin and little duty. Even so, the phone costs 249 Big Hits, two-thirds more burgers than in America.
Cars: the best-seller in burgers
Cars give the clearest split between what a country makes for itself and what it has to buy abroad. China’s best-selling car at retail in 2025 was the Wuling Hongguang Mini EV, a tiny electric runabout made in Liuzhou that costs CNY44,800. That is 1,691 Big Macs, the cheapest best-seller in burger money in our sample. China’s fourth-most popular car, the Tesla Model Y, costs 9,770 burgers, nearly six times as much. It is built in Shanghai, but its price is set with one eye on world markets. In South Korea the locally built Kia Sorento costs 6,281 Big Macs against 8,770 for the imported Model Y, which in May became the first import ever to top Korea’s monthly sales chart.
The world price shows up most clearly when the same car is sold in two countries. The Renault Clio is the best-selling car in both France and Turkey, and every one is built at the Oyak-Renault plant in Bursa. In France the new Clio starts at EUR19,900, or 3,554 Big Macs. In Turkey it starts at TRY1.83mn, which at the current rate is $37,400, some $14,700 more than in France, largely because of Turkey’s heavy special consumption tax on cars. That is 5,631 burgers: the Turks pay 60% more burgers for a car they make themselves.
The most expensive best-seller in burger money is Indonesia’s Toyota Kijang Innova, a family people-carrier built locally that costs IDR437.7mn, or 10,179 Big Macs. Russia’s Lada Granta, still the country’s most popular car, costs RUB771,000, or 3,489 Big Hits, cheaper in burger money than a Ford Puma in Britain (4,944) or an F-150 pickup in America (6,445). Mexico offers a twist: the Chinese-built Chevrolet Aveo, which overtook the locally made Nissan Versa as the country’s best-seller in March, costs 2,890 Big Macs against 3,513 for the Nissan. Chinese exports are now undercutting the local industry on price.
Table 7. Imports and cars in burger money
Country | iPhone 17 256GB, Big Macs | iPhone, months of avg net salary | Best-selling car 2025 | Made | List price | Car, Big Macs |
US | 149 | 0.2 | Ford F-Series pickup | local | $40,085 | 6,445 |
China | 257 | 0.8 | Wuling Hongguang Mini EV | local | CNY44,800 | 1,691 |
Germany | 157 | 0.3 | VW Golf | local | EUR29,835 | 4,268 |
Japan | 320 | 0.4 | Honda N-Box kei car | local | JPY1,768,800 | 3,538 |
UK | 164 | 0.3 | Ford Puma | imported | GBP27,145 | 4,944 |
India | 423 | 2.1 | Maruti Suzuki Dzire | local | INR630,600 | 2,669 |
France | 200 | 0.4 | Renault Clio 5 | imported | EUR19,900 | 3,554 |
Italy | 172 | 0.6 | Fiat Panda/Pandina | local | EUR15,950 | 2,431 |
Russia | 249 | 0.6 | Lada Granta | local | RUB771,000 | 3,489 |
Brazil | 347 | 2.7 | Fiat Strada pickup | local | BRL111,990 | 4,686 |
Canada | 167 | 0.3 | Ford F-Series | imported from US | CAD55,485 | 6,791 |
Australia | 182 | 0.2 | Ford Ranger ute | imported | AUD49,230 | 5,792 |
Mexico | 202 | 1.4 | Nissan Versa | local | MXN382,900 | 3,513 |
Spain | 188 | 0.6 | Dacia Sandero | imported | EUR15,490 | 2,625 |
South Korea | 254 | 0.4 | Kia Sorento | local | KRW35,800,000 | 6,281 |
Turkey | 308 | 1.7 | Renault Clio | local | TRY1,830,000 | 5,631 |
Indonesia | 413 | 3.3 | Toyota Kijang Innova | local | IDR437,700,000 | 10,179 |
Saudi Arabia | 226 | 0.5 | Toyota Camry | imported | SAR106,950 | 5,629 |
Egypt | 534 | 8.8 | Nissan Sunny | reported locally assembled | EGP765,000 | 5,276 |
Poland | 191 | 0.6 | Toyota Corolla | imported | PLN114,100 | 4,855 |
Source: Apple country stores and retailers, August-September 2026 (Russia: parallel-import street price, June 2026); Numbeo average net salary, September 2026; best-selling-cars.com, bestsellingcarsblog.com, national associations and dealer list prices, 2026; bne IntelliNews calculations. Where made to be checked before publication for Brazil, Poland, Egypt and Canada.
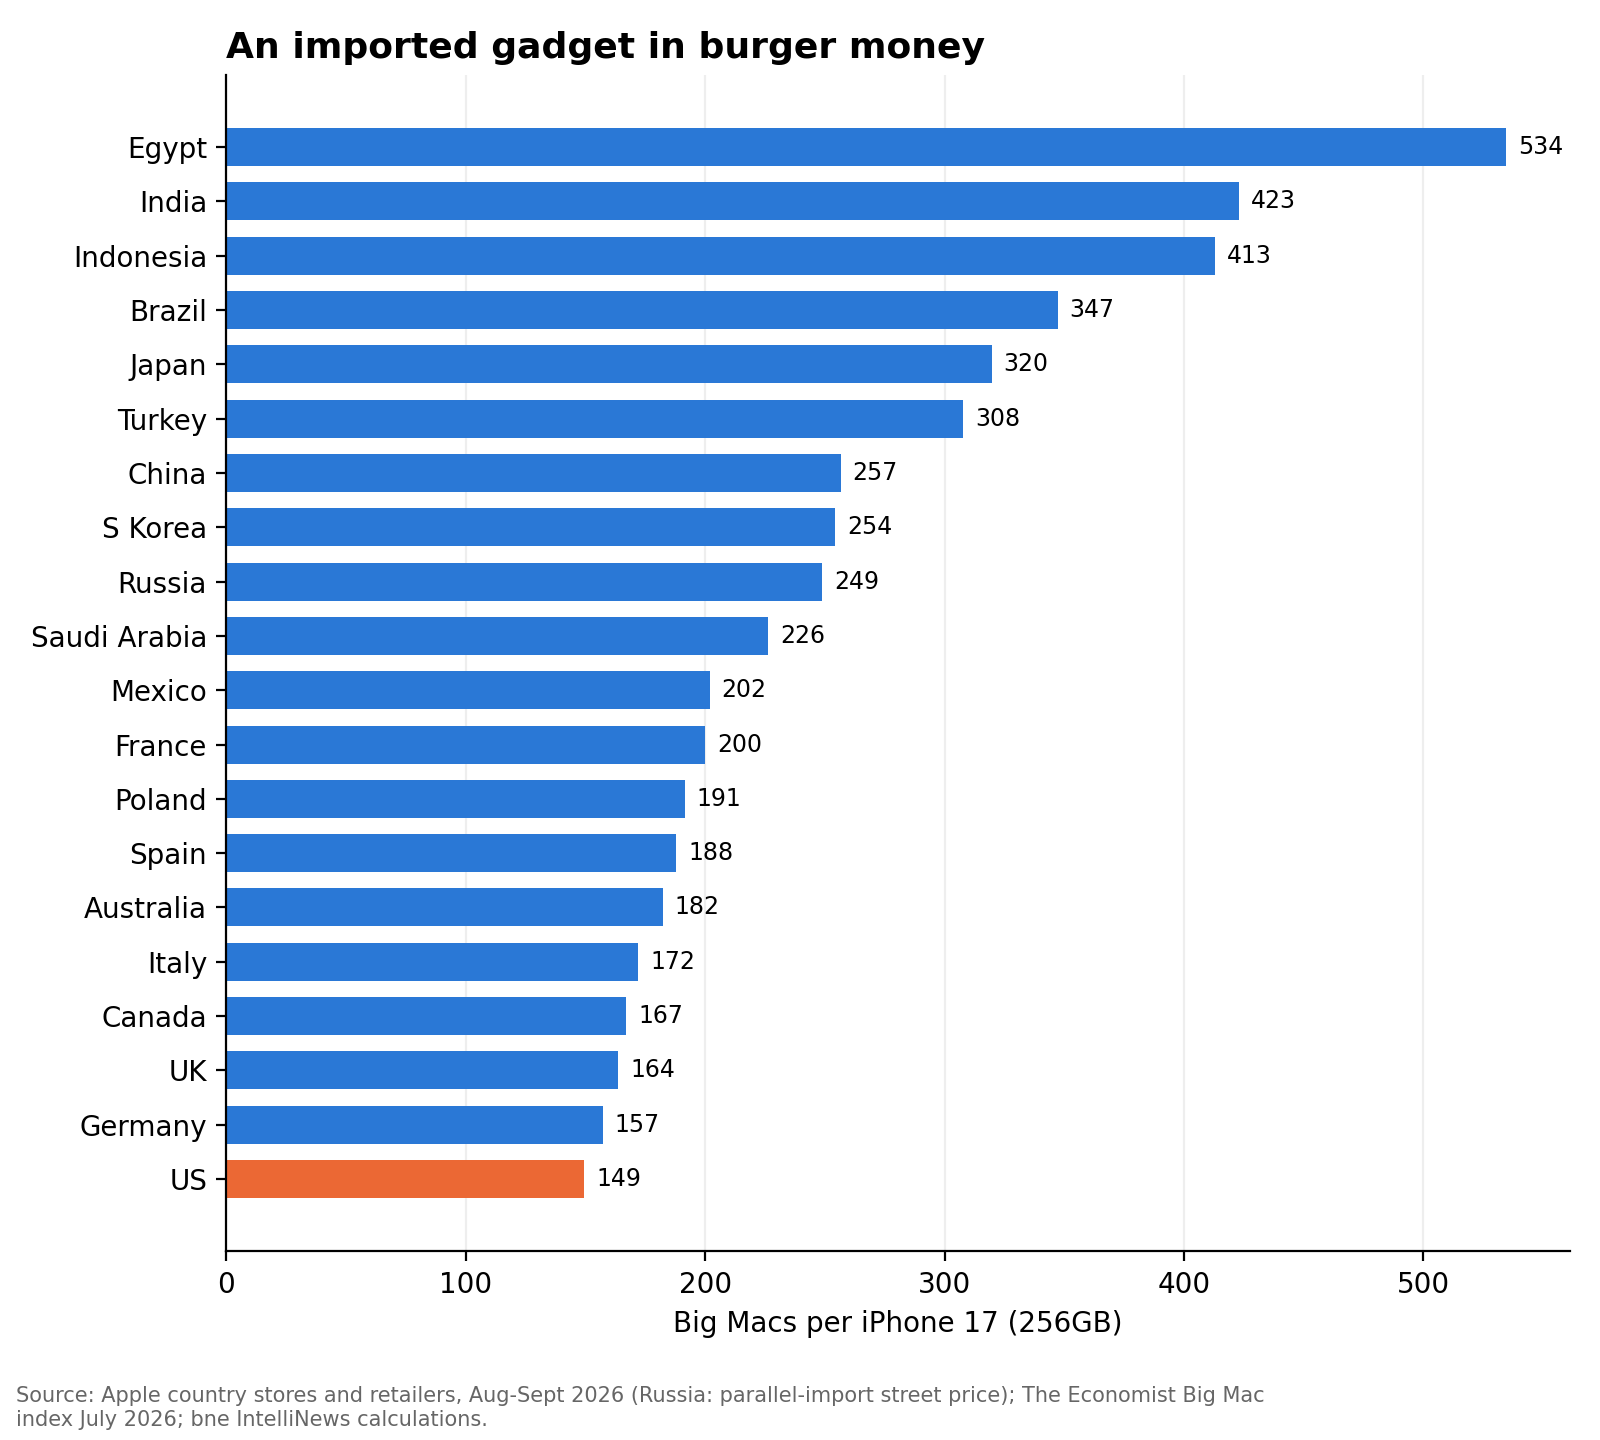
Chart 4. The iPhone costs roughly the same in dollars everywhere, so in burger money it is dearest where burgers are cheapest.
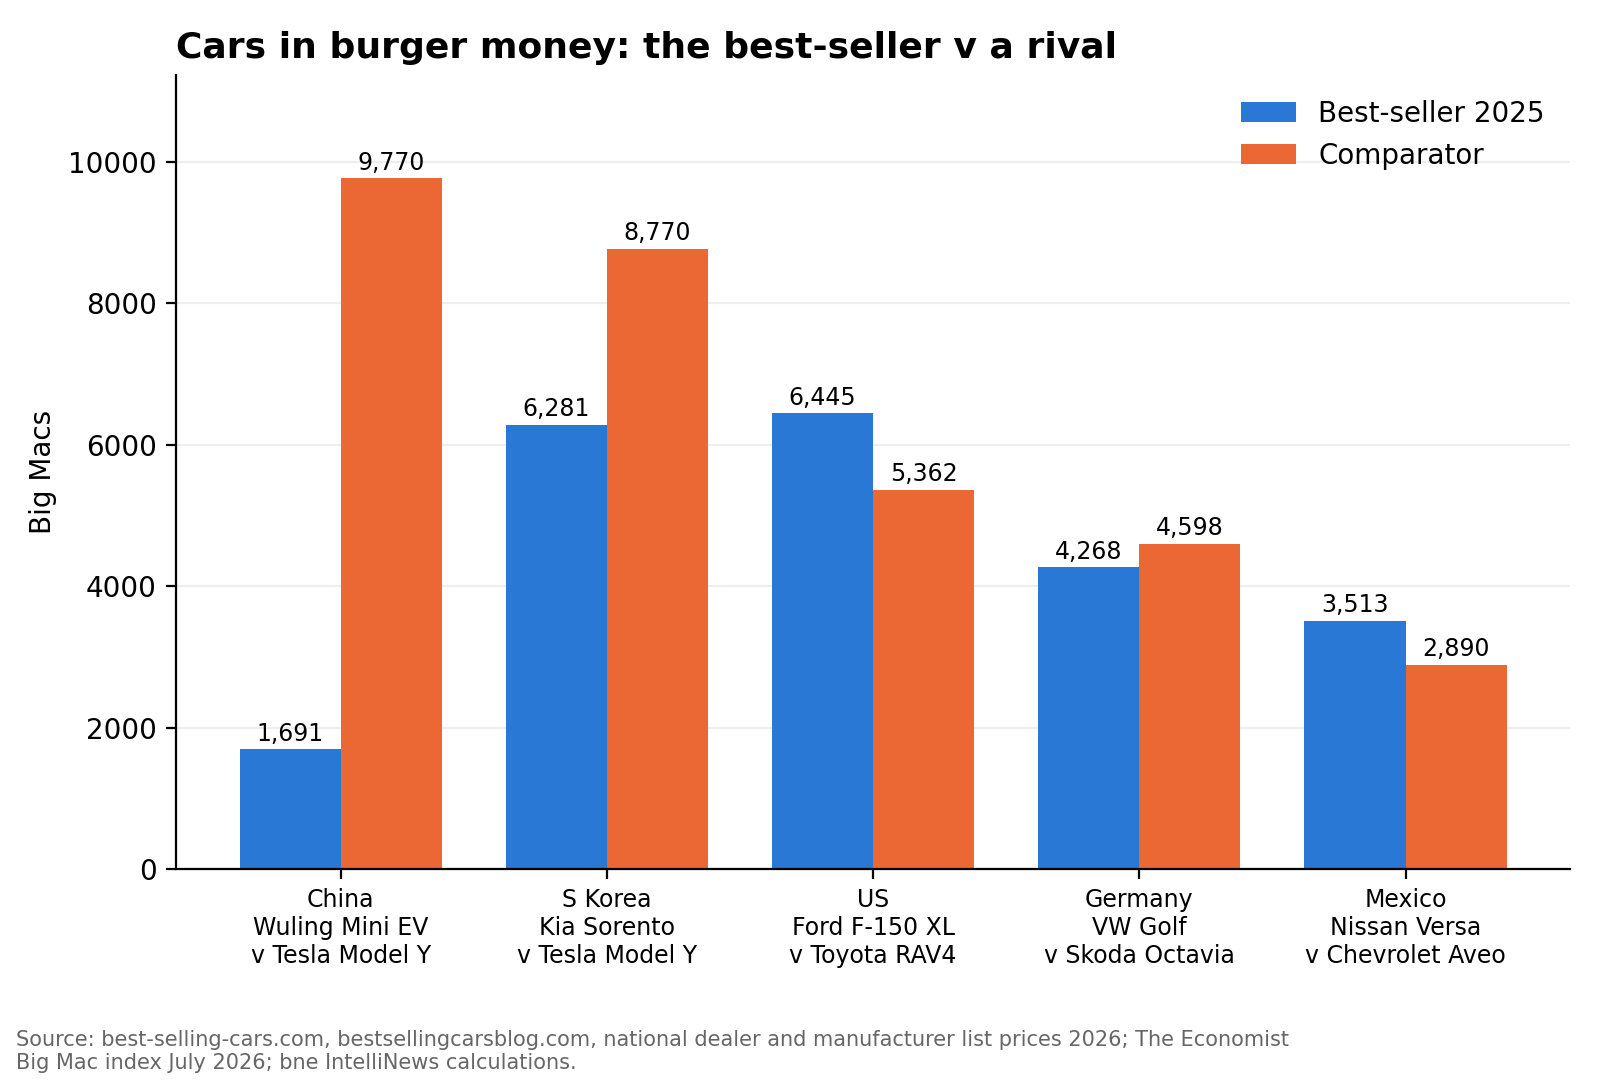
Chart 5. Locally made cars are cheap in burger money; imports and cars priced for world markets are not.
Paid in burgers
The final test is the pay packet. Table 8 converts each country’s minimum wage and its average net salary into burgers per month, and adds two other everyday measures: the rent on a one-bedroom flat in a city centre and the number of litres of petrol one Big Mac would buy.
A worker on Australia’s national minimum wage earns 512 Big Macs a month, and a British worker on the national living wage 401. An American on the federal minimum of $7.25 an hour, unchanged since 2009, earns just 202, about the same as a Pole. At the bottom, the Indian national floor wage buys only 20 Big Macs a month, although most states set higher rates, and the Egyptian private-sector minimum 55. On the average take-home salary, an American can buy a Big Mac with 13 minutes’ work; a Chinese worker needs 33 minutes, a Russian 26, a Brazilian 81, an Indonesian 83 and an Egyptian nearly three hours.
Rent works the other way from the iPhone. Housing cannot be imported, so in burger money a city-centre flat is cheapest where incomes are lowest: 63 Big Macs a month in Egypt and 67 in India, against 302 in the US. Russia is the outlier again: at 258 Big Hits a month, a flat in a Russian city costs almost as many burgers as one in America. Petrol reflects subsidies more than anything: in Saudi Arabia a Big Mac buys 7.2 litres, in India just 2.0.
Table 8. Wages, rent and petrol in burger money
Country | Minimum wage, Big Macs/month | Avg net salary, Big Macs/month | Minutes of work per Big Mac | 1-bed city-centre rent, Big Macs/month | Litres of petrol per Big Mac |
US | 202 | 792 | 13 | 302 | 5.4 |
Australia | 512 | 763 | 14 | 300 | 4.1 |
Japan | 389 | 749 | 14 | 211 | 2.5 |
South Korea | 378 | 622 | 17 | 159 | 2.8 |
Canada | 381 | 587 | 18 | 252 | 4.3 |
UK | 401 | 522 | 20 | 209 | 3.3 |
France | 333 | 494 | 21 | 158 | 2.7 |
Germany | 345 | 478 | 22 | 132 | 3.3 |
Saudi Arabia | 211 | 426 | 24 | 137 | 7.2 |
Russia | 123 | 402 | 26 | 258 | 2.8 |
Spain | 242 | 340 | 31 | 175 | 3.4 |
China | 103 | 312 | 33 | 113 | 2.8 |
Poland | 205 | 304 | 34 | 135 | 3.4 |
Italy | - | 293 | 36 | 126 | 3.2 |
India | 20 | 203 | 51 | 67 | 2.0 |
Turkey | 102 | 184 | 57 | 103 | 4.5 |
Mexico | 88 | 147 | 71 | 135 | 3.7 |
Brazil | 68 | 129 | 81 | 94 | 3.3 |
Indonesia | 133 | 125 | 83 | 140 | 2.8 |
Egypt | 55 | 61 | 171 | 63 | 5.7 |
Minimum wages: Trading Economics, September 2026 (US federal; China: Shanghai; India: national floor level; Indonesia: Jakarta; Saudi Arabia: nationals only; Italy has no statutory minimum). Hourly rates converted at 173.3 hours a month (South Korea 209). Salary, rent and petrol: Numbeo, September 2026. Minutes of work assume 173.3 hours a month. bne IntelliNews calculations.
Russia’s borscht index
Russians have their own version of the burger test, and it predates McDonald’s departure. The borscht index tracks the cost of the “borscht set” of vegetables: beetroot, cabbage, potatoes, carrots and onions. It is compiled from Rosstat’s weekly price survey by retailers’ associations, brokers and the press, and IntelliNews has called it Russia’s answer to the Big Mac index. Unlike the burger, it is made entirely of local produce, so it measures the harvest and the cost of living rather than the currency.
We have covered it several times. In August 2021 our analysis found that the number of borscht portions an average Russian income could buy had fallen in the first half of the year in 64 of the country’s 85 regions. By February 2022 the index had doubled in five years, and packet sizes were shrinking. In December 2025 the cost of the Olivier salad, the other Russian New Year staple, was up 4% on the year. In January we reported that a strong 2025 harvest would bring borscht prices down.
It did, spectacularly, and then prices came back. A poor 2024 harvest drove the potato price up by 166.5% year on year by spring 2025, with onions up 87% and cabbage up 57%. Farmers responded by planting more, a good 2025 harvest followed, and by May 2026 the borscht set was 24.8% cheaper than a year earlier, with potatoes down 38.7% and cabbage down 37.3%. Potato producer prices fell by more than 60%. Burned by the collapse, farmers cut their plantings this spring, and by late August retail prices were rising again, potatoes and cabbage both up 35% year on year according to Rosstat. The potato harvest is forecast to be 11.5% smaller. It is a textbook “cobweb” cycle, and its swings have dwarfed consumer price inflation of under 5%.
The index is also seasonal. According to Rosstat the national average cost of a borscht set rose from RUB205 in December 2025 to RUB320 in June 2026, up 56% in six months as the stored harvest ran down, against annual inflation of 4.64%. In burger money that is a jump from 0.9 to 1.4 Big Hits. In Moscow the set cost RUB370; in remote Chukotka, where everything is flown in, RUB1,675, or 7.6 Big Hits.
Table 9. The borscht index: boom, bust and boom
Period | Borscht set | Source |
2024 full year | Beef borscht set RUB90.5 per portion, +28%; chicken +31.6% | AKORT via Kommersant |
Spring 2025 | Potatoes +166.5% y/y, onions +87.2%, cabbage +56.8%, beets +11.9% | Rosstat via The Moscow Times |
Dec 2025 | Borscht set RUB205; Olivier salad for four RUB618 (Rosstat), +4% y/y | Rosstat; TASS |
May 2026 | Borscht set -24.8% y/y: potatoes -38.7%, cabbage -37.3%, onions -34.3%, beets -33.4% | Rusprodsoyuz via TASS |
Jun 2026 | Borscht set RUB320, +56% since December; Moscow RUB370; Chukotka RUB1,675 | Rosstat via NeMoskva |
Late Aug 2026 | Potatoes and cabbage +35.3% y/y, onions +27.2%, beets +20.4%, carrots +17.7% | Rosstat via Kommersant |
Methods differ: Rosstat national retail averages, retail-chain minimum prices (AKORT, Rusprodsoyuz) and producer prices are not strictly comparable.
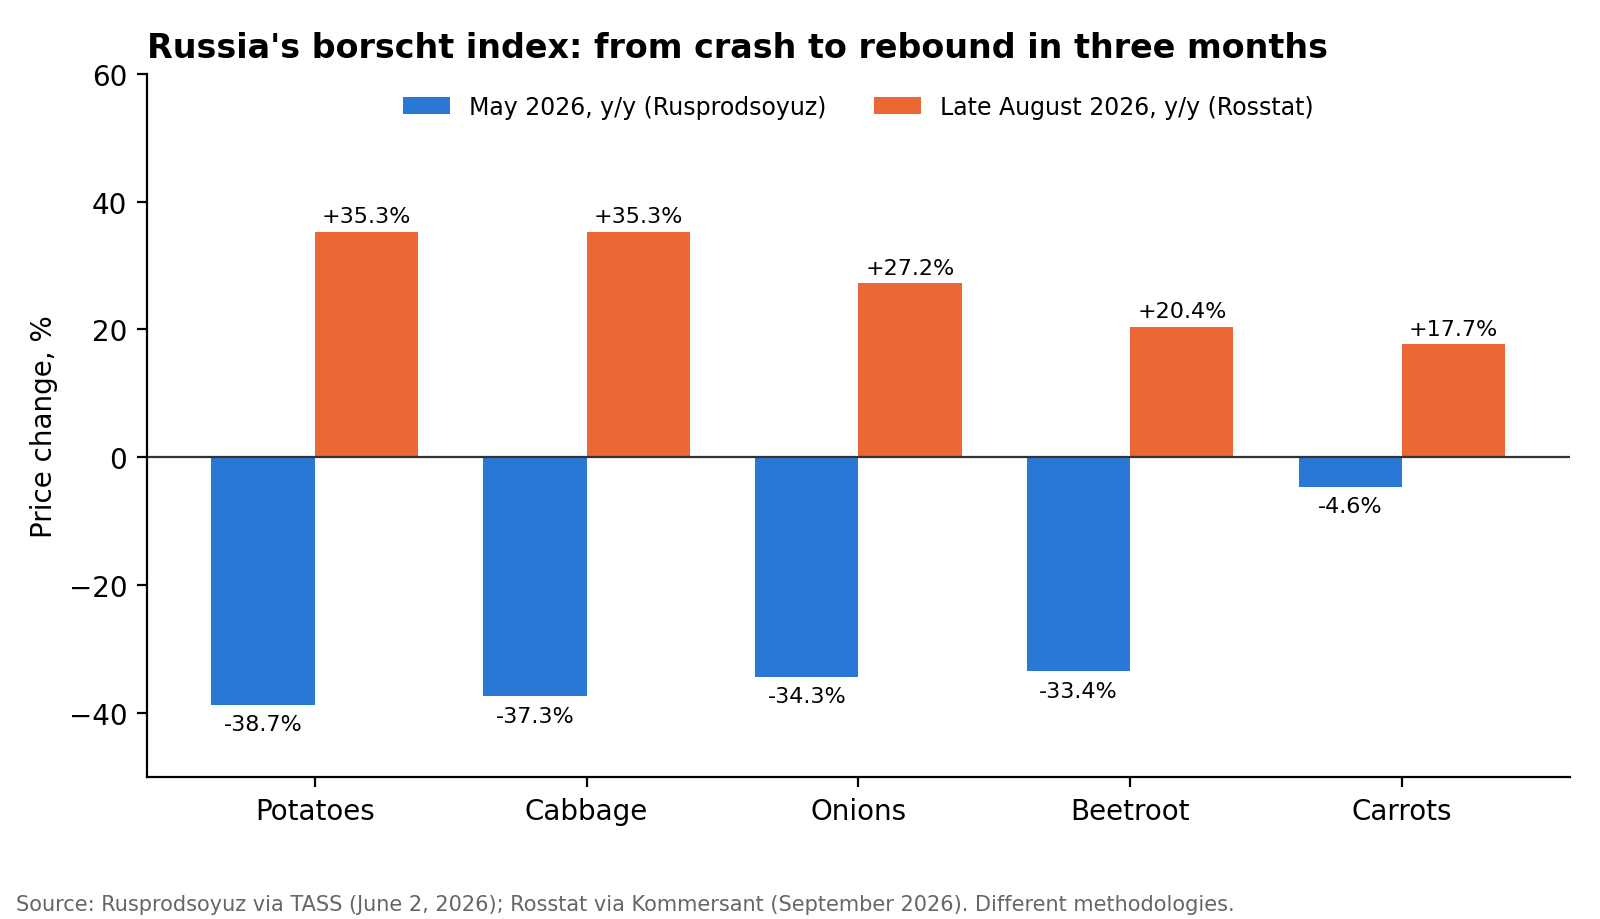
Chart 6. The borscht vegetables went from falls of up to 39% in May to rises of up to 35% by late August.
What about China?
China has no single folk index to rival the borscht set, and we found no evidence of a recognised “jianbing index” or “malatang index”, despite the popularity of both street foods. What Chinese households, officials and economists actually watch is pork. Pork makes up about an eighth of the food basket and around 2.5% of headline CPI, and the “pig cycle” (zhu zhouqi) of overbreeding, price collapse, culling and shortage has driven food inflation for two decades, most violently after African swine fever wiped out much of the herd in 2018-19.
The latest numbers show how weak demand remains. In August 2026 headline CPI rose just 0.8% year on year, with pork down 11.8% while eggs rose 15%. The breeding-sow herd stood at 37.8mn head at the end of June, 6.5% smaller than a year earlier and close to the government’s 37.5mn benchmark, so traders expect hog prices to recover in the autumn.
For a real-time read on consumer sentiment, Chinese commentators have also used instant-noodle sales and the price of a cup of coffee. The “9.9 yuan coffee” war between Luckin and Cotti became a byword for consumption downgrade until both chains scaled back their discounts from February 1 this year under pressure from anti-monopoly regulators. In burger money, a Chinese Big Mac at CNY26.50 now costs about as much as two cups of discounted coffee.
Other ways to measure a currency
Table 10. The alternative indices
Index | What it measures | Latest |
KFC index | Price of a KFC bucket in about 20 African countries, where McDonald’s is scarce | Sagaci Research; last edition found 2016: rand 48% undervalued |
IKEA Billy index | Price of the same bookcase worldwide | September 2026: $57 in Japan, $79 in the US, $141 in Morocco |
iPhone index | Apple’s price in dollars across about 50 countries | CommSec since 2007; see Table 7 for our 2026 update |
Starbucks latte index | Price of a tall latte | April 2026 aggregator data: US $5.45, Switzerland $6.70, Brazil $2.12 |
Minutes of work | Working time on the average wage needed to buy a Big Mac | UBS, 2009: 12 minutes in Chicago, Toronto, Tokyo; over 2 hours in Nairobi. See Table 8 |
Borscht index | Cost of the Russian borscht vegetable set | See above |
Is the Big Mac the right burger?
The Big Mac was chosen because it is the closest thing to an identical product sold almost everywhere. It is not a perfect yardstick, and its flaws explain most of our results. Most of what goes into a burger’s price is not beef and bread but rent, wages and local taxes, which are cheap in poor countries. That is why burgers cost less there, a pattern economists call the Balassa-Samuelson or Penn effect, and it means a cheap Big Mac does not by itself prove a currency is undervalued. The Economist has published a GDP-adjusted version of the index since 2011 to correct for this. On that measure the yuan is 24% undervalued rather than 37%, while the Turkish lira looks 39% overvalued rather than 11%.
Taxes and politics matter too. Russia’s Big Hit jumped from RUB165 to RUB180 overnight when VAT on restaurant food rose from 10% to 20% in October 2023, with no change in the ruble. McDonald’s positions itself as a premium brand in poor countries and a budget one in rich ones. And the burger simply is not available in Russia, Iran or Nigeria. A basket of staples, like the borscht set, measures real living costs better; a single burger measures them more memorably. Forty years on, that is still why the Big Mac wins.

No comments:
Post a Comment