Sunday, December 05, 2021


Growing carbon footprint for plastics
plastic
Credit: CC0 Public Domain

Plastics are useful, cheap and extremely popular. Global demand has quadrupled in the last forty years and is expected to continue to rise, with correspondingly negative consequences for the environment and human health. The public is generally aware of the environmental harm caused by plastics at the end of their life cycle in particular, such as when they release greenhouse gasses and air pollutants when burned, or pollute water and soil in the form of microplastics.

Research into the global environmental impact of plastics has also focused primarily on the disposal phase. There are few studies into the production of plastics, which also affects the climate and air quality. In-depth analysis, however, requires detailed information on supply chains and processes in order to trace the relevant material and energy flows.

Assessing the global footprint of plastics

"So far, the simplistic assumption has been that the production of  requires roughly the same amount of fossil fuel as is contained in the  in plastic—above all petroleum," says Livia Cabernard, a doctoral student at the Institute of Science, Technology and Policy (ISTP) at ETH Zurich. The problem here, however, is that the relative significance of production versus disposal has been significantly underestimated.

Cabernard is part of a team of researchers led by Stephan Pfister, Senior Scientist at ISTP, and Stefanie Hellweg, ETH Professor of Ecological Systems Design at the Institute of Environmental Engineering. Through painstaking detective work, the team analyzed the climate and health impact of the global plastics  over a 20-year period.

In a study recently published in Nature Sustainability, the researchers show that the global carbon footprint of plastics has doubled since 1995, reaching 2 billion tons of CO2 equivalent (CO2e) in 2015. This represents 4.5 percent of , and is more than previously thought. Over the same period, the global health footprint of plastics from fine particulate air pollution has increased by 70 percent, causing approximately 2.2 million disability-adjusted life years (DALYs) in 2015.

Coal for process heat, electricity and as a raw material

For their study, the team determined the greenhouse gas emissions generated across the life cycle of plastics—from fossil resource extraction, to processing into product classes and use, through to end of life, including recycling, incineration and landfill.

The researchers identify booming plastic production in coal-based newly industrialized countries such as China, India, Indonesia and South Africa as the main cause of the growing greenhouse gas footprint of plastics. The energy and process heat for the production of plastics in these countries comes primarily from the combustion of coal. A small amount of coal is also used as a raw material for plastics.

"The plastics-related carbon footprint of China's transport sector, Indonesia's electronics industry and India's construction industry has increased more than 50-fold since 1995," explains Cabernard. Globally, carbon-based emissions in plastics production have quadrupled since 1995 and now account for nearly half of the global carbon footprint of plastics.

When coal is burned, it produces extremely fine particles that accumulate in the air. Such particulate matter is highly harmful to health and can cause asthma, bronchitis and cardiovascular disease. As more and more coal is used for process heat, electricity and as a raw material in plastic production, the negative consequences for health are also increasing.

Underestimated plastic production

In contrast to earlier estimates, which assumed equal amounts of fuel and raw material for the production of plastics, the ETH researchers have now proven that twice as much fossil energy is burned for plastic production as is contained as a raw material in plastic.

This affects the assessment of the environmental consequences. "Even in a  in which all plastics are incinerated, their production accounts for the lion's share of total greenhouse gas and particulate matter emissions," says Cabernard. The overall production phase of plastics is responsible for the vast majority (96 percent) of the carbon footprint of plastics.

Insights thanks to new methodology

There had previously only been one publication that examined the global carbon footprint of plastics production. "This underestimated the , however, because it did not take into account the increasing dependence on coal due to the outsourcing of production processes to coal-based countries," Cabernard explains.

The researchers used a new method for their study that Cabernard had previously developed in her doctoral thesis under the supervision of Pfister and Hellweg. This approach involves a multi-regional input-output analysis that can accurately map global supply chains from production to consumption across industries, countries and regions.Researchers suggest a way to achieve net-zero emission plastics

More information: Livia Cabernard, Growing environmental footprint of plastics driven by coal combustion, Nature Sustainability (2021). DOI: 10.1038/s41893-021-00807-2. www.nature.com/articles/s41893-021-00807-2

Journal information: Nature Sustainability 

Provided by ETH Zurich 
Growing environmental footprint of plastics driven by coal combustion


Abstract

Research on the environmental impacts from the global value chain of plastics has typically focused on the disposal phase, considered most harmful to the environment and human health. However, the production of plastics is also responsible for substantial environmental, health and socioeconomic impacts. We show that the carbon and particulate-matter-related health footprint of plastics has doubled since 1995, due mainly to growth in plastics production in coal-based economies. Coal-based emissions have quadrupled since 1995, causing almost half of the plastics-related carbon and particulate-matter-related health footprint in 2015. Plastics-related carbon footprints of China’s transportation, Indonesia’s electronics industry and India’s construction sector have increased more than 50-fold since 1995. In 2015, plastics caused 4.5% of global greenhouse gas emissions. Moreover, 6% of global coal electricity is used for plastics production. The European Union and the United States have increasingly consumed plastics produced in coal-based economies. In 2015, 85% of the workforce required for plastics consumed by the European Union and the United States was employed abroad, but 80% of the related value added was generated domestically. As high-income regions have outsourced the energy-intensive steps of plastics production to coal-based economies, renewable energy investments throughout the plastics value chain are critical for sustainable production and consumption of plastics.

Main

The global demand for plastics has quadrupled over the past four decades1 and is projected to further increase in the future, intensifying the impacts on the environment and human health2,3,4,5. Strategies for the sustainable production and consumption of plastics require information on the value chain of plastics6,7,8,9, such as fossil resource extraction and processing, resin production, manufacturing into plastics products, plastics use and end-of-life treatments. Many studies have addressed the environmental impacts of (micro)plastics pollution2,4,5,6,8,10,11,12,13,14 and plastics incineration7,15,16. Less attention has been paid to plastics production, which also has substantial environmental impacts, such as those caused by the release of greenhouse gas (GHG)17,18,19,20 emissions. Furthermore, plastics production induces health impacts, such as through the release of particulate-matter (PM) emissions, and socioeconomic impacts, such as by employing a workforce and creating value added.

Since the value chain of plastics spans the entire globe, plastics are often produced in a different country from the one in which they are ultimately consumed21. Therefore, the environmental, health and socioeconomic impacts resulting from one country’s plastics consumption can occur elsewhere around the globe. Multiregional input-output (MRIO) analysis allows these impacts to be assessed along the global value chain22,23,24,25,26,27,28. However, the accuracy of results from standard MRIO analysis has been limited when analysing the cumulative impacts of materials such as plastics due to double counting29,30,31,32. For example, when assessing cumulative GHG emissions (including upstream emissions) of primary plastics production and plastics recycling, double counting occurs because some primary plastics are ultimately recycled. In standard MRIO analysis32, the emissions of these primary plastics are counted again as upstream emissions in plastics recycling (a detailed explanation is provided in Cabernard et al.31).

In this article, we apply an enhanced method based on MRIO analysis that prevents double counting29,30,31,33 to assess the environmental impacts of global plastics production from 1995 to 2030 and extend this method to evaluate the role of coal combustion (Methods). We assess GHG emissions that occur in the global plastics value chain, called the carbon footprint of plastics. In this context, the study highlights the importance of plastics production, including resin production, manufacturing into plastics products and related upstream activities. Moreover, we analyse fossil resources used as a fuel and feedstock for plastics production, called here the fossil resource footprint of plastics. To evaluate the role of trade, the link between plastics-producing and consuming regions is mapped. Further, we analyse the future evolution of the global carbon footprint of plastics assuming that the world follows the International Energy Agency’s (IEA’s) projection for a 2 °C or 6 °C scenario34,35. Finally, this study analyses the PM health impacts, the workforce employed and value added created in the global plastics production chain to provide an overview of the health and socioeconomic impacts (Methods).

Results

Global carbon footprint of plastics and value-chain analysis

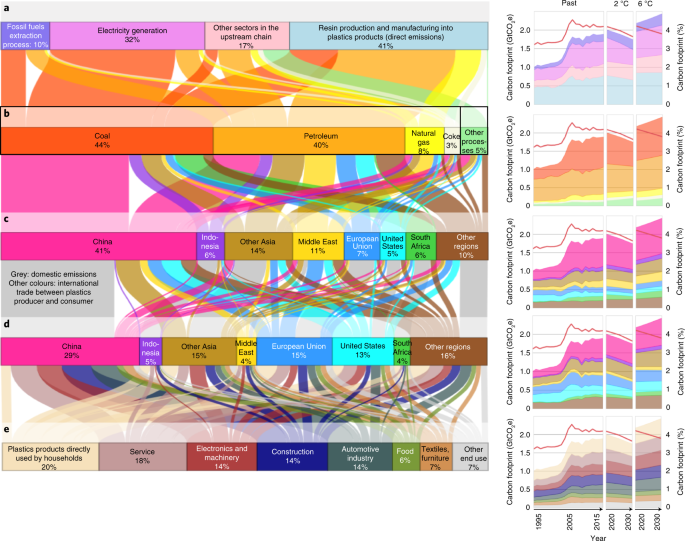
Since 1995, the carbon footprint of plastics has doubled, reaching 2 GtCO2-equivalent (CO2e) in 2015, accounting for 4.5% of global GHG emissions (Extended Data Fig. 1). The major driver of the rising carbon footprint of plastics has been the increased combustion of coal for plastics production, including resin production, manufacturing into plastics products and related upstream activities (Fig. 1a,b). As coal-based emissions for plastics production have quadrupled since 1995, plastics production accounted for the majority (96%) of the carbon footprint of plastics, while the end-of-life stages, including recycling, incineration and landfills, induced a minor fraction (6%, year 2015, Extended Data Fig. 1). Consequently, coal-based emissions caused almost half of the carbon footprint of global plastics production in 2015, due mainly to electricity and heat supply from coal for resin production and manufacturing into plastics products (Fig. 1a,b). In total, 6% of global coal electricity was used for plastics production in 2015.

Fig. 1: Global value-chain analysis of the carbon footprint (GHG emissions) of global plastics production in 2015.
figure1

ae, The sum of each horizontal bar of the flow chart refers to the carbon footprint of global plastics production in 2015 (1.9 GtCO2e, 100%) and allocates it to the different perspectives in the global value chain: the sectors where GHG emissions are released (a); the processes that release GHG emissions, that is, combustion (88%) and non-combustion (7%) processes of fossil fuels (left side: 95% in total) and other processes (right side: 5 % in total): biogenic emissions (2.7%), hydrofluorocarbon emissions (1.7%) and cement production (0.8%) (b); the regions where GHG emissions are released (production perspective) (c); the regions where plastics are finally used (consumption perspective) (d); and the end products or sectors where plastics are finally used: plastics packaging material is allocated to the end product or sector where it is used (for example, food packaging in the food sector) (e). The flows show the linkages between the perspectives. To enhance clarity, linkages contributing to less than 0.1% of the plastics-related carbon footprint are not shown. The small graphs on the right show the temporal evolution of the carbon footprint of global plastics production for each perspective (ae) over the past two decades (1995–2015) and in the future (2020–2030) if the world follows the IEA’s projection for a 2 °C or 6 °C scenario34,35 (but not accounting for the decrease in global GHG emissions in 2020 due to the COVID-19 pandemic, as in Liu et al.66). The colours of the graphs on the right correspond to the bars of the flow chart. The red line in each graph represents the global share. The end-of-life stages of plastics (recycling, incineration and landfills) contributed another 120 MtCO2e in 2015, not illustrated in this figure. A detailed value-chain analysis of the carbon footprint of global plastics recycling is shown in Extended Data Fig. 2.

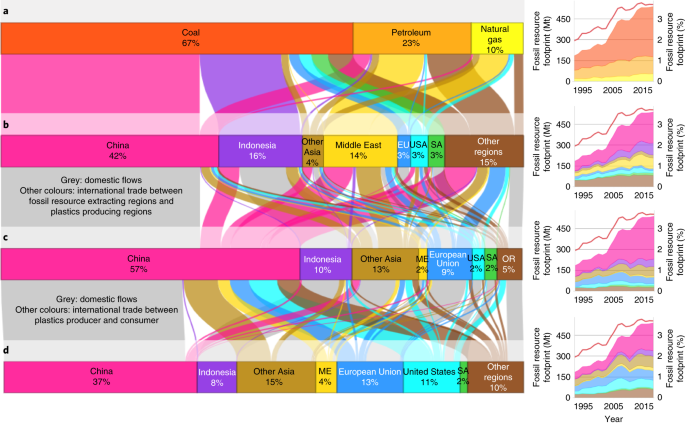
Due to the increased reliance on coal, the fossil resource footprint of plastics, including fossil resources used as fuel and feedstock for plastics production, has tripled since 1995 (Fig. 2a). Fossil fuels combusted for global plastics production released a total of 1.7 GtCO2e in 2015 (Fig. 1b, 88%). The carbon contained in fossil resources used as feedstock for plastics production accounted for another 890 MtCO2e (meaning this amount would be released if all plastics produced in 2015 were combusted without credits from energy recovery). Thus, twice as much fossil carbon is combusted as fuel for plastics production (1.7 GtCO2e) than contained as feedstock in plastics (890 MtCO2e). Our results further indicate that if all plastics produced in 2015 were incinerated, this would increase the annual carbon footprint of plastics by 19% (350 MtCO2e, subtracting credits from energy recovery36). While the GHG emissions of plastics incineration are commonly known7,8,15, our results show that even in a worst-case scenario in which all plastics were combusted, the major share of GHG emissions would still occur in the production phase.

Fig. 2: Value-chain analysis of the fossil resource footprint of global plastics production, including the extraction of fossil resources used as a fuel and feedstock for plastics production.
figure2

ad, The sum of each horizontal bar of the flow chart on the left refers to the fossil resource footprint of global plastics production in 2015 (540 Mt in 2015, 100%) and allocates it to the different perspectives in the global value chain: type of extracted fossil resource (a); region where fossil resources are extracted (b); region where fossil resources are used for plastics production (as fuel or feedstock) (c); region where plastics are consumed (d). The small graphs on the right show the temporal evolution of the fossil fuel footprint of global plastics production for each perspective (ad) over the past two decades. The colours of the graphs on the right correspond to the bars of the flow chart. The red line in each represents the global share. EU, European Union; ME, Middle East; SA, South Africa; USA, United States; OR, other regions.

Growth in plastics production in coal-based emerging economies, such as China, Indonesia and South Africa, was the major driver of the increasing carbon footprint of plastics (Fig. 1). Since 1995, China’s plastics-related carbon footprint has more than tripled from both a production and a consumption perspective (Fig. 1b–d). In 2015, 40% of the global plastics-related carbon footprint and more than 60% of the related coal-based emissions were caused in China. In Indonesia, coal mining for plastics production has increased by a factor of 300 since 1995 (Fig. 2b). In 2015, 15% of Indonesia’s totally mined coal was used for plastics production, either domestically or abroad. More than 10% of Indonesia’s total domestic GHG emissions were attributed to plastics production in 2015. South Africa’s plastics-related carbon footprint has increased tenfold since 1995, and 95% of it was caused by domestic coal consumption in 2015. The reason for this is that South Africa uses coal not only to supply electricity and heat but also as a feedstock for plastics production37. Almost half of the plastics produced in China and South Africa were exported, such as to the European Union and to the United States (Fig. 1c,d).

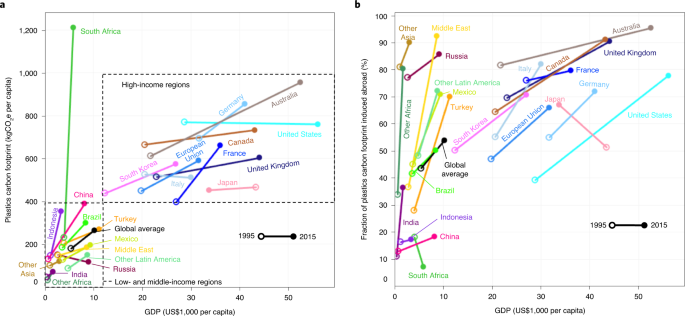
High-income regions, such as the European Union and the United States, contributed substantially to the increasing global carbon footprint of plastics by their rising demand for plastics produced in lower-income regions, particularly in coal-based economies such as China (Figs. 1 and 3 and Extended Data Fig. 3). Due to the outsourcing of plastics production to lower-income regions, the European Union’s plastics-related carbon footprint increased although their domestic plastics-related GHG emissions decreased (Extended Data Fig. 4). In 2015, two-thirds of the European Union’s plastics-related carbon footprint was emitted abroad, mainly in lower-income regions with less-stringent environmental policies. The fraction of the plastics-related carbon footprint caused abroad was even higher for Australia, Canada and the United States (>80% in 2015, Fig. 3b). Since 1995, the United States’ plastics-related carbon footprint generated abroad quadrupled, while their plastics-related domestic GHG emissions decreased (Extended Data Fig. 5). Consequently, the fraction of the United States’ plastics-related carbon footprint induced abroad increased from 39% in 1995 to 78% in 2015. One-third of the United States’ plastics-related carbon footprint in 2015 occurred in China (Fig. 1c,d; see Supplementary Results 1 for further results on the Middle East and Supplementary Results 2 and Supplementary Fig. 2 for results on the carbon intensity of plastics resin production per region).

Fig. 3: Plastics-related carbon footprints of nations and the role of imports in 1995 and 2015.
figure3

a, Change in the per capita carbon footprints of plastics from a consumption perspective. b, Change in the fraction of the carbon footprint of plastics induced abroad due to imports plotted against the GDP and grouped by income67 from 1995 to 2015 (as single data points for these two years). The carbon footprints of plastics shown in this figure allocate the GHG emissions to the region where the plastics were finally used (consumption perspective). Net traded GHG emissions of plastics (production-based minus consumption-based GHG emissions) are shown in Extended Data Fig. 3.

In addition to increased plastics exports, emerging economies contributed to the rising global carbon footprint of plastics by their growing plastics demand, due mainly to their growing infrastructures, transportation systems and digitalization. Since 1995, the plastics-related carbon footprint of China’s transportation system, Indonesia’s electronics industry and India’s construction sector has increased more than 50-fold. In 2015, 15% of the global carbon footprint of plastics was attributed to plastics used for construction, and almost half of these emissions were attributed to China’s construction (Fig. 1d,e). In addition, plastics are responsible for 15% of the carbon footprint of the global automotive industry, and more than one-third of these GHG emissions were attributed to China’s automotive industry. While China also manufactured most of the plastics embodied in electronics (65%), a smaller portion (42%) was used by China itself, and the majority (58%) was exported to other regions.

Climate change scenarios

If the world follows the IEA’s projection for a 6 °C scenario34,35, the global carbon footprint of plastics would grow by 31% from 2015 to 2030, and thus almost at the same speed as projected plastics production (+40%, Fig. 1, see Extended Data Fig. 6 for per capita projections). The strongest increase is expected for coal-based economies, such as China, India and South Africa, while the largest international customers of plastics produced in these coal-based economies continue to be the European Union and the United States. Following the IEA’s projection for a 2 °C scenario34,35 would reduce the global carbon footprint of plastics by 10% from 2015 to 2030, while plastics production would increase by 40%. This would be attributed to investment in renewable energy production, mainly clean electricity, and improved energy efficiency in resin production. However, coal combustion would still contribute more than a third of the carbon footprint of plastics in 2030 if the world followed the IEA’s projection for a 2 °C scenario34,35. This highlights the potential of a rapid phase-out of coal to further reduce the carbon footprint of plastics in the future, as keeping global warming below 1.5 °C is critical for preventing major climate-related hazards38.

Despite the growing demand for plastics in emerging economies, the carbon footprints of plastics remain distinctly higher in high-income regions on a per capita level (Fig. 3a), and this imbalance is projected to persist into the future (Extended Data Fig. 6). Taking into account the projected reduction in plastics-related carbon footprints per region if the IEA’s measures for a 2 °C scenario34,35 were implemented, high-income regions in particular would have a high saving potential at the per capita level, which would also reduce income-related differences in the carbon footprints of plastics.

Health and socioeconomic impacts of plastics production

Since 1995, the global PM health footprint of plastics has increased by 70%, causing the loss of 2.2 million disability-adjusted life years (DALY) and representing 2.8% of global PM health impacts in 2015 (based on EXIOBASE322 and Cabernard et al.31, Extended Data Figs. 7 and 8). Similar to GHG emissions, plastics production accounted for the majority (96%) of the plastics-related PM health footprint, half of which was attributed to coal combustion (year 2015, Fig. 4a,b). Moreover, the majority (75%) of PM health impacts were caused in China, India, Indonesia and other Asia, while high-income regions increasingly consumed plastics produced in these regions (Fig. 4c,d). In 2015, the majority of the European Union’s (80%) and the United States’ (91%) plastics-related PM health footprint was caused abroad, mainly in Asia. Thus, only 8% of the global plastics-related PM health footprint effectively occurred in high-income regions (Extended Data Fig. 9c), although one-third of global plastics was consumed in high-income regions.

CONTINUE READING HERE Growing environmental footprint of plastics driven by coal combustion | Nature Sustainability