It’s possible that I shall make an ass of myself. But in that case one can always get out of it with a little dialectic. I have, of course, so worded my proposition as to be right either way (K.Marx, Letter to F.Engels on the Indian Mutiny)
Saturday, December 16, 2023
People, not the climate, caused the decline of the giant mammals
For years, scientists have debated whether humans or the climate have caused the population of large mammals to decline dramatically over the past several thousand years. A new study from Aarhus University confirms that climate cannot be the explanation
PREHISTORIC PEOPLE ARE ATTACKING AN ELEPHANT. NEW RESEARCH SHOWS THAT HUMANS AND NOT THE CLIMATE CAUSED A SHARP DECLINE IN ALMOST ALL MEGAFAUNA ON EARTH 50.000 YEARS AGO.
CREDIT: FIRST PRINTED IN BRYANT & GAY, 1883. WOOD CARVING BY E. BAYARD.
About 100,000 years ago, the first modern humans migrated out of Africa in large numbers. They were eminent at adapting to new habitats, and they settled in virtually every kind of landscape - from deserts to jungles to the icy taiga in the far north.
Part of the success was human's ability to hunt large animals. With clever hunting techniques and specially built weapons, they perfected the art of killing even the most dangerous mammals. But unfortunately, the great success of our ancestors came at the expense of the other large mammals.
It is well-known that numerous large species went extinct during the time of the world-wide colonization by modern humans. Now, new research from Aarhus University reveals that those large mammals that survived, also experienced a dramatic decline.
By studying the DNA of 139 living species of large mammals, the scientists have been able to show that abundances of almost all species fell dramatically about 50,000 years ago. This is according to Jens-Christian Svenning, a professor and head of the Danish National Research Foundation's Center for Ecological Dynamics in a Novel Biosphere (ECONOVO) at Aarhus University, and the initiator of the study.
"We’ve studied the evolution of large mammalian populations over the past 750,000 years. For the first 700,000 years, the populations were fairly stable, but 50,000 years ago the curve broke and populations fell dramatically and never recovered,” he says, and continues:
"For the past 800,000 years, the globe has fluctuated between ice ages and interglacial periods about every 100,000 years. If climate was the cause, we should see greater fluctuations when the climate changed prior to 50.000 years ago. But we don't. Humans are therefore the most likely explanation.”
Who killed the large mammals?
For decades, scientists have debated what is behind the extinction or rapid decline of large mammals over the past 50,000 years.
On one side are scientists who believe that rapid and severe fluctuations in the climate are the main explanation. For example, they believe that the woolly mammoth went extinct because the cold mammoth steppe largely disappeared.
On the opposite side are a group who believe that the prevalence of modern humans (Homo sapiens) is the explanation. They believe that our ancestors hunted the animals to such an extent that they either became completely extinct or were severely decimated.
The new study presents brand new data that sheds new light on the debate. By looking at the DNA of 139 large living mammals – species that have survived for the past 50,000 years without becoming extinct – the researchers can show that the populations of these animals have also declined over the period. This development seems to be linked to the spread of humans and not climate change.
DNA contains the long-term history of the species
In the past 20 years, there has been a revolution within DNA sequencing. Mapping entire genomes has become both easy and inexpensive, and as a result the DNA of many species has now been mapped.
The mapped genomes of species all over the globe are freely accessible on the internet – and this is the data that the research group from Aarhus University has utilized, explains assistant professor Juraj Bergman, the lead researcher behind the new study.
“We’ve collected data from 139 large living mammals and analysed the enormous amount of data. There are approximately 3 billion data points from each species, so it took a long time and a lot of computing power,” he says and continues:
"DNA contains a lot of information about the past. Most people know the tree of life, which shows where the different species developed and what common ancestors they have. We’ve done the same with mutations in the DNA. By grouping the mutations and building a family tree, we can estimate the size of the population of a specific species over time.
The larger the population of an animal, the more mutations will occur. It’s really a question of simple mathematics. Take elephants, for example. Every time an elephant is conceived, there’s a chance that a number of mutations will occur, and it will pass these on to subsequent generations. More births means more mutations.”
The large mammals
The 139 large mammals examined in the study are all species that exist today. They include elephants, bears, kangaroos and antelopes among others.
It is estimated that there are 6,399 species of mammals on the Earth, but the 139 extant megafauna were selected in this study to test how their populations changed over the past 40,000 to 50,000 years, when similar large animals went extinct.
The large mammals are also called megafauna – and are defined as animals weighing more than 44 kg when fully grown. Humans are therefore also considered megafauna. In the study, however, the researchers examined species weighing as little as 22 kg, so that all continents have been represented - except Antarctica.
However, the size of the elephant population is not the only thing that affects the number of mutations.
If the area in which elephants live suddenly dries up, the animals come under pressure – and this affects the composition of mutations. The same applies if two isolated groups of elephants suddenly meet and mix genes.
If not only the size of the population affects how many mutations occur, you would think that the results are rather uncertain. But this is not the case, explains Juraj Bergman.
"Only 10 per cent of mammalian genomes consist of active genes. Great selection pressure from the environment or migration will primarily lead to mutations in the genes. The remaining 90 percent, on the other hand, are more neutral,” he says, and continues:
"We have therefore examined mutations in those parts of the genome that are least susceptible to the environment. These parts primarily indicate something about the size of the population over time.”
The woolly mammoth is an atypical case
Much of the debate about what caused the large animals to either become extinct or decline has centered around the woolly mammoth. But this is a bad example because the majority of the megafauna species that went were associated with temperate or tropical climates, as Jens-Christian Svenning explains.
“The classic arguments for the climate as an explanatory model are based on the fact that the woolly mammoth and a number of other species associated with the so-called "mammoth steppe" disappeared when the ice melted and the habitat type disappeared,” he says, and continues:
"This is basically an unsatisfactory explanatory model, as the vast majority of the extinct megafauna species of the period did not live at all on the mammoth steppe. They lived in warm regions, such as temperate and tropical forests or savannahs. In our study, we also show a sharp decline during this period in populations of the many megafauna species that survived and come from all sorts of different regions and habitats.”
The final full stop in the debate has probably yet to be set, but Jens-Christian Svenning finds it difficult to see how the arguments for the climate as an explanation can continue.
"It seems inconceivable that it is possible to come up with a climate model that explains how, across all continents and groups of large animals, there have been extinctions and continuous decline since about 50,000 years ago. And how this selective loss of megafauna is unique for the past 66 million years, despite huge climate change
Given the rich data we now have, it’s also hard to deny that instead it is because humans spread across the globe from Africa and subsequently grew in population.”
About the research
Type of study: Statistical modelling
External funding: The study is supported by the Villum Foundation (grant 16549), the Danish National Research Foundation (DNRF173) and the EU Horizon 2020 programme.
Conflicts of interest: The researchers declare that there are no conflicts of interest in connection with this research.
The eastern gorilla is one of the mammals that have declined the most. Today it's only living in small areas in DR Congo.
CREDIT
Michalsloviak
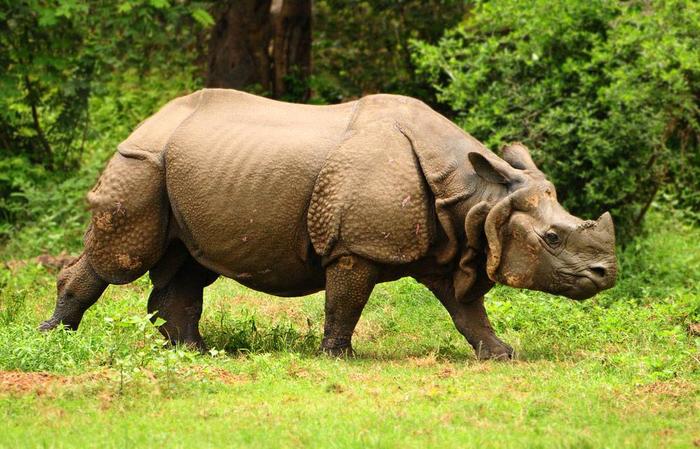
Another large mammal severely decimated is the greater one horned rhinoceros. It lives in India and is one of five species of rhinos left.
CREDIT
Mayank1704
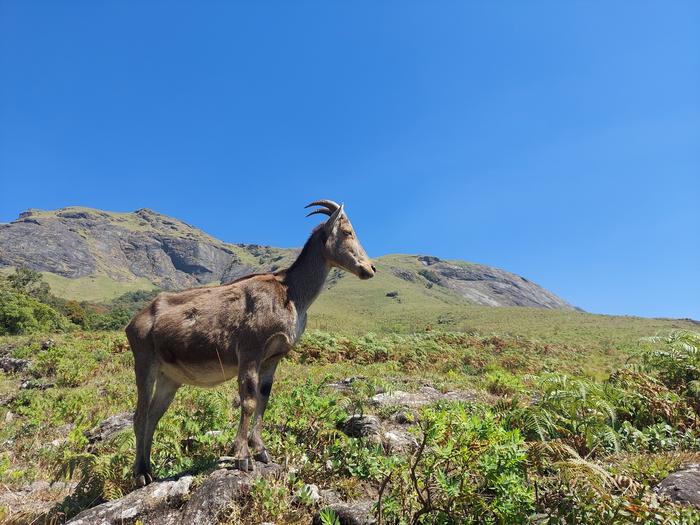
Nilgiritahr is closely related to the goat, but is actually an antelope. It lives in the mountains of southern India. Once the population of Nilgiritahr was much larger.
CREDIT
AMESHSHENAON
Peré Davids deer, shown in this picture, does not live in the wild anymore. The only animals left today is living in Zoos and animal parks.
CREDIT
Tim Felce
In the water here is the Sitatunga. It's an antelope, which lives in several African countries. The sitatunga lives in swamp-areas and was once found in greater numbers.
CREDIT
Kennyannydenny
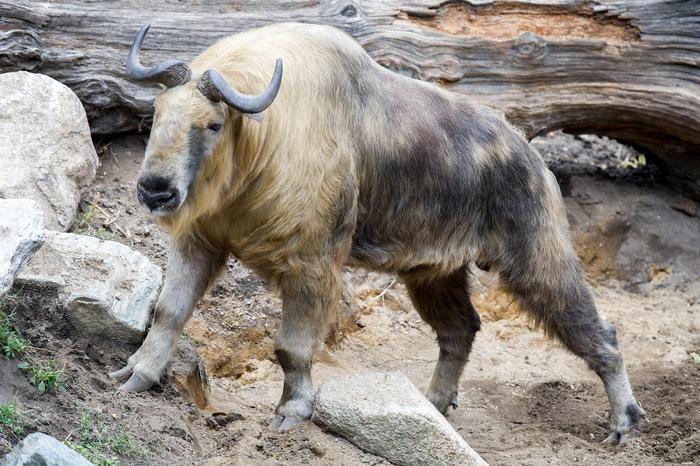
In the Himalaya mountains lives the Takin. It can be found in bamboo forests where it feeds on fresh leaves and grass. 50.000 years ago much the population died out.
Worldwide Late Pleistocene and Early Holocene population declines in extant megafauna are associated with Homo sapiens expansion rather than climate change
Reaching for the (invisible) stars
Uncovering the missing precursors of hydrogen-poor supernovae
Supernovae–stellar explosions as bright as an entire galaxy–have fascinated us since time immemorial. Yet, there are more hydrogen-poor supernovae than astrophysicists can explain. Now, a new Assistant Professor at the Institute of Science and Technology Austria (ISTA) has played a pivotal role in identifying the missing precursor star population. The results, now published in Science, go back to a conversation the involved professors had many years ago as junior scientists.
Some stars do not simply die down, but explode in a stellar blast that could outshine entire galaxies. These cosmic phenomena, called supernovae, spread light, elements, energy, and radiation in space and send galactic shock waves that could compress gas clouds and generate new stars. In other words, supernovae shape our universe. Among these, hydrogen-poor supernovae from exploding massive stars have long puzzled astrophysicists. The reason: scientists have not been able to put their finger on their precursor stars. It is almost as if these supernovae appeared out of nowhere.
“There are many more hydrogen-poor supernovae than our current models can explain. Either we can't detect the stars that mature on this path, or we must revise all our models,” says ISTA Assistant Professor Ylva Götberg. She pioneered this work together with Maria Drout, an Associated Faculty Member of the Dunlap Institute for Astronomy & Astrophysics, University of Toronto, Canada. “Single stars would typically explode as hydrogen-rich supernovae. Being hydrogen-poor indicates that the precursor star must have lost its thick hydrogen-rich envelope. This happens naturally in a third of all massive stars through envelope stripping by a binary companion star,” says Götberg. Now, Götberg and Drout combined their areas of expertise in theoretical modeling and observation to hunt down the missing stars. Their quest is successful: they document a first-of-its-kind star population that finally bridges a large knowledge gap and sheds light on the origin of hydrogen-poor supernovae.
Binary stars and envelope stripping The stars that Götberg and Drout search for go in pairs: interlocked in a binary star system. Some binary systems are well-known to us Earthlings: these include the brightest star in our night sky, Sirius A, and its faint companion star Sirius B. The Sirius binary system is located only 8.6 light-years away from Earth–a stone’s throw in cosmic terms. This explains Sirius A’s observed brightness in our night sky.
Astrophysicists expect the missing stars to be initially formed from massive binary systems. In a binary system, the stars would orbit around one another until the more massive star’s thick, hydrogen-rich envelope expands. Eventually, the expanding envelope experiences a stronger gravitational pull to the companion star than to its own core. This causes a transfer of mass to begin, which eventually leads the entire hydrogen-rich envelope to be stripped off, leaving the hot and compact helium core exposed–more than 10 times hotter than the Sun’s surface. This is precisely the type of stars that Götberg and Drout are looking for. “Intermediate mass helium stars stripped through binary interaction are predicted to play important roles in astrophysics. Yet, they were not observed until now,” says Götberg. In fact, there is an important mass gap between the known classes of helium stars: the more massive Wolf-Rayet (WR) stars have more than 10 times the Sun’s mass, and the low-mass subdwarf stars could have around half the Sun’s mass. However, models have predicted the precursors of hydrogen-poor supernovae to lie between 2 and 8 solar masses following stripping.
Not just a needle in the haystack Before Götberg and Drout’s study, only one star was found to fulfill the expected mass and composition criteria and was called “Quasi-WR” (or “Almost Wolf-Rayet”). “Yet, the stars that follow this path have such a long lifetime that many must be scattered all over the observable universe,” says Götberg. Did the scientists simply not “see” them? Thus, Götberg and Drout drew on their complementary expertise. With the help of UV photometry and optical spectroscopy, they identified a population of 25 stars that are consistent with the expectations for intermediate-mass helium stars. The stars are located in two well-studied neighboring galaxies, the Large and the Small Magellanic Clouds. “We showed that these stars were bluer than the stellar birthline, the bluest phase in a single star’s lifetime. Single stars mature by evolving towards the redder region of the spectrum. A star only shifts in the opposite direction if its outer layers are removed–something that is expected to be common in interacting binary stars and rare among single massive stars,” explains Götberg.
The scientists then verified their candidate star population using optical spectroscopy: they showed that the stars had strong spectral signatures of ionized helium. “Strong ionized helium lines tell us two important things: first, they confirm that the stars’ outermost layers are dominated by helium and, second, that their surface is very hot. This is what happens to stars left as an exposed, compact, helium-rich core following stripping,” says Götberg. Yet, both stars in a binary system contribute to the observed spectra. Thus, this technique allowed the researchers to classify their candidate population depending on which star contributed the most to the spectrum. “This work allowed us to find the missing population of intermediate-mass, stripped helium stars, the predicted progenitors of hydrogen-poor supernovae. These stars have always been there and there are probably many more out there. We must simply come up with ways to find them,” says Götberg. “Our work may be one of the first attempts, but there should be other ways possible.”
From graduate students at a conference to group leaders The idea behind this project sparked in a discussion following a talk by Götberg at a conference that she and Drout attended during their graduate studies. Both scientists, then Early Career Researchers reaching for the stars, are now group leaders in their field. Götberg joined ISTA in September following her research at the Carnegie Observatories in Pasadena, California, as a NASA Hubble postdoctoral fellow. At ISTA, Götberg joins the Institute’s growing ranks of young group leaders in astrophysics and leads her own group focused on studying the binary interactions of stars.
This work, led by Maria R. Drout (Dunlap Institute for Astronomy & Astrophysics, University of Toronto, Canada) and Ylva Götberg (Institute of Science and Technology Austria, ISTA), was done in collaboration with The Observatories of the Carnegie Institution for Science (Pasadena, USA), and the Max Planck Institute for Astrophysics (Garching, Germany), among others.
A three-panel artist’s impression of a star being stripped by a binary companion. The third panel depicts the stage when these stars are observed in the present work. Stills from a movie.
Study authors at the Magellan telescopes at Las Campanas Observatory in Chile. LTR: Bethany Ludwig, Anna O’Grady, and co-first authors Maria Drout and Ylva Götberg.
THIS ARTIST'S IMPRESSION SHOWS HOW HOT, BRILLIANT AND HIGH-MASS STARS EVOLVE. THE MORE MASSIVE BRIGHTER STAR EXPANDS FIRST, UNTIL THE OUTER LAYERS START TO STRONGLY FEEL THE GRAVITATIONAL PULL OF THE COMPANION. THE COMPANION THEN STARTS TO SUCK MATERIAL FROM THE PRIMARY STAR. WHEN THE PRIMARY HAS BEEN STRIPPED FROM ITS ENTIRE HYDROGEN-RICH ENVELOPE IT SHRINKS.
CREDIT: NAVID MARVI, COURTESY OF THE CARNEGIE INSTITUTION FOR SCIENCE
Astronomers at the University of Toronto have discovered a population of massive stars that have been stripped of their hydrogen envelopes by their companions in binary systems. The findings, published today in Science, shed light on the hot helium stars that are believed to be the origins of hydrogen-poor core-collapse supernovae and neutron star mergers.
For over a decade, scientists have theorized that approximately one in three massive stars are stripped of their hydrogen envelope in binary systems. Yet, until now, only one possible candidate had been identified.
“If it turned out that these stars are rare, then our whole theoretical framework for all these different phenomena is wrong, with implications for supernovae, gravitational waves, and the light from distant galaxies,” Drout says. “This finding shows these stars really do exist.”
“Going forward, we are going to be able to do much more detailed physics with these stars,” Drout says. “For example, predictions for how many neutron star mergers we should see are dependent on the properties of these stars, such as how much material comes off of them in stellar winds. Now, for the first time, we’ll be able to measure that, whereas people have been extrapolating it before.”
Binary stripped stars have been previously evoked to explain why a third of core-collapse supernovae contain much less hydrogen than a typical explosion of a Red Supergiant star. Drout and her colleagues propose that these newly discovered stars will eventually explode as hydrogen-poor supernovae. These star systems are also thought to be necessary to form neutron star mergers, like those that emit gravitational waves detected from Earth by the LIGO experiment.
In fact, the researchers believe that a few objects in their current sample are stripped stars with neutron star or blackhole companions. These objects are at the stage immediately before they become double neutron star or neutron star plus blackhole systems that could eventually merge.
“Many stars are part of a cosmic dance with a partner, orbiting each other in a binary system. They're not solitary giants but part of dynamic duos, interacting and influencing each other throughout their lifetimes,” says Bethany Ludwig, a PhD student in in the David A. Dunlap Department of Astronomy & Astrophysics at the University Toronto and the third author on this paper. “Our work sheds light on these fascinating relationships, revealing a universe that is far more interconnected and active than we previously imagined.”
“Just as humans are social beings, stars too, especially the massive ones, are rarely alone,” Ludwig says.
As stars evolve and expand to become red giants, the hydrogen at the outer edges of one can be stripped by the gravitational pull of its companion—leaving a very hot helium core exposed. The process can take tens of thousands, or even hundreds of thousands, of years.
Stripped stars are difficult to find because much of the light they emit is outside of the visible light spectrum and can be obstructed by dust in the universe or outshone by their companion stars.
Drout and her collaborators began their search in 2016. Having studied hydrogen-poor supernovae during her PhD, Drout set out to find the stripped stars thought to be at the heart of them during a NASA Hubble Postdoctoral Fellowship at the Observatories of the Carnegie Institution for Science. She met fellow co-author Ylva Götberg, now Assistant Professor at the Institute of Science and Technology Austria (ISTA), at a conference, who had recently built new theoretical models of what these stars should look like.
Drout, Götberg, and their collaborators designed a new survey to look in the ultraviolet part of the spectrum where extremely hot stars emit most of their light. While invisible to the naked eye, ultraviolet light can be detected by specialized instruments and telescopes.
Using data from the Swift Ultra-Violet/Optical Telescope, the researchers collected brightnesses for millions of stars in the Large and Small Magellanic Clouds, two of the closest galaxies to Earth. Ludwig developed the first wide-field UV catalog of the Magellanic Clouds and used UV photometry to detect systems with unusual UV emissions, signaling the possible presence of a stripped star.
They carried out a pilot study of 25 objects, obtaining optical spectroscopy with the Magellan Telescopes at Las Campanas Observatory between 2018 and 2022. They used these observations to demonstrate that the stars were hot, small, hydrogen-poor, and in binary systems—all consistent with their model predictions.
Currently, the researchers are continuing to study the stars identified in this paper and expanding their search to find more. They will be looking both within nearby galaxies and within our own Milky Way with approved programs on the Hubble Space Telescope, the Chandra X-Ray Telescope, the Magellan Telescopes, and the Anglo-Australian Telescope. As part of this publication, all theoretical models and data used to identify these stars have been made public and available to other scientists.
Collaborating institutions include the University of Toronto, the Observatories of the Carnegie Institution for Science, Max-Planck-Institut für Astrophysik, Anton Pannekoek Institute for Astronomy, Dunlap Institute for Astronomy & Astrophysics, and Steward Observatory.
About the Dunlap Institute for Astronomy & Astrophysics
The Dunlap Institute for Astronomy & Astrophysics in the Faculty of Arts & Science at the University of Toronto is an endowed research institute with over 80 faculty, postdocs, students, and staff, dedicated to innovative technology, groundbreaking research, world-class training, and public engagement.
The research themes of its faculty and Dunlap Fellows span the Universe and include: optical, infrared and radio instrumentation, Dark Energy, large-scale structure, the Cosmic Microwave Background, the interstellar medium, galaxy evolution, cosmic magnetism and time-domain science.
The Dunlap Institute, the David A. Dunlap Department of Astronomy & Astrophysics, and other researchers across the University of Toronto’s three campuses together comprise the leading concentration of astronomers in Canada, at the leading research university in the country.
This artist's impression shows how hot, brilliant and high-mass stars evolve. Most such stars are in pairs. The more massive brighter star expands first, until the outer layers start to strongly feel the gravitational pull of the companion. The companion then starts to suck material from the primary star. When the primary has been stripped from its entire hydrogen rich envelope it shrinks. At this point the secondary star is now rotating very fast and has an oblate shape. The hot compact star continues to fuse heavier and heavier elements in its centre until it explodes as a supernova. During the explosion a neutron star is born which probably escapes. The secondary is left behind alone. It swells up and becomes a red supergiant with a radius a few times larger than the orbit of the Earth around the Sun. Eventually the second star also explodes as a supernova.
CREDIT
ESO/L. Calçada/M. Kornmesser/S.E. de Mink
UV view of the nearest galaxies
UNIVERSITY OF TORONTO
Surveys conducted by NASA's Swift-UVOT telescope provide the most detailed overviews ever captured in ultraviolet light of the Large and Small Magellanic Clouds, the two closest major galaxies to our own. The researchers use this ultraviolet dataset to identify the candidate systems that they targeted for this paper.
CREDIT
NASA/Swift/S. Immler (Goddard) and M. Siegel (Penn State)
Lead co-author Maria Drout (University of Toronto) with the Magellan Telescope at Las Campanas Observatory.
LIGHT FROM MANY DIFFERENT MOLECULES REVEALS THE SECRETS OF DISTANT STAR FACTORIES. THE ILLUSTRATION SHOWS REPRESENTATIONS OF THE MOLECULES FOUND IN THE DISTANT GALAXY NCV1.143, SUPERIMPOSED ON AN IMAGE OF A SIMILAR GALAXY IN THE NEARBY UNIVERSE – NGC 572 – TAKEN IN VISIBLE LIGHT BY THE HUBBLE TELESCOPE.
CREDIT: ESA/HUBBLE, NASA, L. HO; JMOL (MOLECULES); R. CUMMING (MONTAGE).
Two galaxies in the early universe, which contain extremely productive star factories, have been studied by a team of scientists led by Chalmers University of Technology in Sweden. Using powerful telescopes to split the galaxies’ light into individual colours, the scientists were amazed to discover light from many different molecules – more than ever before at such distances. Studies like this could revolutionise our understanding of the lives of the most active galaxies when the universe was young, the researchers believe.
When the universe was young, galaxies were very different from today’s stately spirals, which are full of gently-shining suns and colourful gas clouds. New stars were being born, at rates hundreds of times faster than in today’s universe. Most of this however, was hidden behind thick layers of dust, making it a challenge for scientists to discover these star factories’ secrets – until now. By studying the most distant galaxies visible with powerful telescopes, astronomers can get glimpses of how these factories managed to create so many stars.
In a new study, published in the journal Astronomy & Astrophysics, a team of scientists led by Chalmers astronomer Chentao Yang, used the telescopes of NOEMA (NOrthern Extended Millimetre Array) in France to find out more about how these early star factories managed to create so many stars. Yang and his colleagues measured light from two luminous galaxies in the early universe – one of them classified as a quasar, and both with high rates of star formation.
“We knew these galaxies were prodigious star factories, perhaps amongst the biggest the universe has ever seen. To be able to find out how they work, we measured their light at wavelengths around one millimetre, hoping to collect new clues,” says Chentao Yang.
Dramatic chemistry in the distant galaxies excites the astronomers
The measurements proved to be successful beyond the scientists’ expectations. In the light they recorded from both galaxies, they identified traces of many different kinds of molecules. From deep within these galaxies, light is emitted in many different wavelengths from the clouds of gas and dust where new stars are born.
“It’s an amazing explosion of colour, in shades that the human eye can’t see. But by combining our observations with our knowledge of physics and chemistry, we can understand what the colours mean, and see what differences there are between different galaxies,” explains Sergio Martín, astronomer at ESO and Joint ALMA Observatory, Chile, and member of the research team.
By analysing each galaxy’s spectrum – the individual colours of their light – the scientists were able to identify 13 molecules, several of which have never been seen before in such distant galaxies. Each molecule gives different clues about the temperature, pressure, and density in the space between the stars, and about how starlight, radiation and matter interact – providing key new information on the physical and chemical conditions in these galaxies.
“Interpreting the signals is a challenge. We are seeing part of the electromagnetic spectrum that is hard to observe in nearby galaxies. But thanks to the expansion of the universe, the light from distant galaxies like these is shifted to longer wavelengths that we can see with radio telescopes observing in the sub-millimetre”, says Chentao Yang.
More like a neon-lit city than a night under the stars
The two galaxies studied by the team are so far away that their light takes almost 13 billion years to reach us.
“Looking at these galaxies is less like a night under the stars and more like seeing a city lit with neon lights”, says Susanne Aalto, Chalmers astronomer and team member.
Astronomers are used to taking pictures of our galaxy’s star factories, like the Orion Nebula and the Carina Nebula, she explains.
“In these two distant galaxies, we are instead seeing star factories that are bigger, brighter, full of dust, and different in many ways. The Orion and Carina nebulae are lit up thanks to ultraviolet light from hot, newborn stars. In these two distant galaxies, ultraviolet light can’t get past the layers of dust. Much of the illumination is instead thanks to cosmic rays – high energy particles that can be created by exploding stars, or close to a supermassive black hole”, says Susanne Aalto.
The galaxies in the early universe can now tell their stories
While galaxies like these two are rare, the scientists have plans to study more of them, using both NOEMA and its even bigger sister telescope, ALMA (the Atacama Large Millimetre/Submillimetre Array) in Chile. Both telescopes are sensitive to light with wavelengths of around one millimetre.
“Our results show how NOEMA, with its broadband receivers and powerful correlator computer, has opened up new opportunities for studying extreme galaxies like these in the northern sky. From the southern hemisphere, ALMA’s planned wideband sensitivity upgrades will offer even more exciting prospects. The most remarkable galaxies in the early universe are finally able to tell their stories through their molecules”, says Pierre Cox, astronomer at CNRS and Sorbonne Université, France.
More about the research results:
Over a hundred different molecules have been detected in interstellar space. In this study, the astronomers identified molecules of carbon monoxide (CO), the cyano radical (CN), the ethynyl radical (CCH), hydrogen cyanide (HCN), the formyl cation (HCO+), hydrogen isocyanide (HNC), carbon monosulphide (CS), water (H2O), the hydronium ion (H3O+), nitric oxide (NO), diazenylium (N2H+), the methylidyne radical (CH), and cyclopropenylidene (c-C3H2). Several of these (CH, CCH, c-C3H2, N2H+, and H3O+) have never been seen before at such large distances.
The two galaxies in the study have catalogue numbers APM 08279+5255 and NCv1.143. Previous studies have shown that they are so far away that their light has been traveling towards us for nearly 13 billion years, corresponding to redshifts of 3.911 and 3.565, respectively. Redshift means that the expansion of the universe stretches the light from distant galaxies to longer wavelengths, which can be observed with radio telescopes.
Despite their distance, the galaxies shine brightly at radio wavelengths. Their signals are amplified thanks to clusters of other galaxies that lie along the light's path – an effect known as gravitational lensing. One of the galaxies, APM 08279+5255, is also a quasar, a galaxy whose centre glows brightly all the way from radio waves to X-rays, due to material swirling around a supermassive black hole. NCv1.143 may also contain a central black hole.
More about the research group:
The team is composed of: Chentao Yang (Chalmers University of Technology, Sweden), Alain Omont (CNRS and Sorbonne Université, France), Sergio Martín (ESO and Joint ALMA Observatory, Chile), Thomas G. Bisbas (Zhejiang Laboratory, China), Pierre Cox (CNRS and Sorbonne Université, France), Alexandre Beelen (Aix Marseille University, France), Eduardo González-Alfonso (Universidad de Alcalá, Spain), Raphaël Gavazzi (Aix Marseille University), Susanne Aalto (Chalmers University of Technology), Paola Andreani (ESO), Cecilia Ceccarelli (Université Grenoble Alpes, CNRS), Yu Gao (Xiamen University, China), Mark Gorski (Chalmers University of Technology), Michel Guélin (IRAM, France), Hai Fu (University of Iowa, USA), Rob J. Ivison (ESO, Macquarie University, Dublin IAS, University of Edinburgh), Kirsten K. Knudsen (Chalmers University of Technology), Matthew Lehnert (Centre de Recherche Astrophysique de Lyon, CRAL, France), Hugo Messias (ESO and Joint ALMA Observatory), Sebastien Muller (Chalmers University of Technology), Roberto Neri (IRAM), Dominik Riechers (Universität zu Köln), Paul van der Werf (Leiden University, Netherlands) and Zhi-Yu Zhang (Nanjing University, China).
More about NOEMA:
NOEMA, the Northern Extended Millimetre Array, is the most powerful millimetre observatory in the Northern Hemisphere, located on 2500 metres above sea level on the Plateau de Bure in the French Alps and run by IRAM. It consists of an array of 12 individual 15-metre antennas. During observations, the antennas function as a single telescope by using a technique called interferometry.
Light from many different molecules reveals the secrets of distant star factories. The illustration shows representations of the molecules found in the distant galaxy APM 08279+5255, superimposed on an image of a similar galaxy in the nearby universe – IC 5063 – taken in visible light by the Hubble telescope. Both of these galaxies have an active supermassive black hole at their centre.
CREDIT
NASA, ESA & W. P. Maksym (CfA); Jmol (molecules); R. Cumming (montage)
Light from two distant galaxies showing signs of many different molecules. The sharp peaks in these graphs, known as spectral lines, tell astronomers about the gas clouds that emit the light. The horizontal axis shows both wavelength and frequency of the light; the vertical axis shows relative brightness. The top spectrum has been shifted upwards for clarity. In red, the graph shows the galaxy NCv1.143 and in purple, APM 08279+5255.