Wednesday, July 28, 2021


Global project observes rare meteor showers and meteorite falls
Global project observes rare meteor showers and meteorite falls
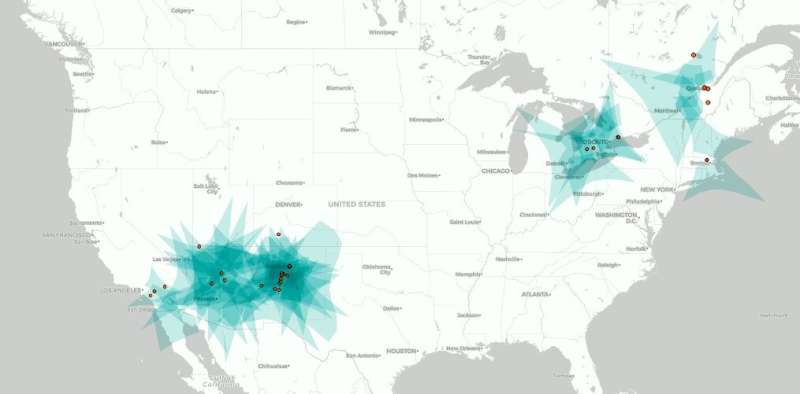
GMN station locations in North America and coverage area at the height of 100 km. 
Credit: University of Western Ontario

As billionaires battle it out in a space race that only a handful of the world's richest persons can play, a highly inclusive international project is looking in the other direction–what's flying towards Earth–and all are welcome.

Led by Western University's Denis Vida, the Global Meteor Network (GMN) is a collection of more than 450 video meteor cameras hosted by amateur astronomers and professionals alike in 23 countries across the globe.

That's a lot of cameras and more, much more, are on the way. The massive array, working collectively and connectively, is needed to achieve GMN's mission prime: ensuring that no unique space events, such as rare meteor showers or meteorite-dropping fireballs, are missed.

"The main operational goal of the project is to establish a decentralized, science-grade instrument which observes the night sky every night of the year from as many locations around the world as possible," said Vida, a postdoctoral associate in Western's department of physics and astronomy.

A new paper, soon-to-be published by Monthly Notices of the Royal Astronomical Society and currently available at arXiv, details the project and also shares some of GMN's impressive preliminary findings.

Meteor astronomers, like Vida and Western's Canada Research Chair in Planetary Small Bodies Peter Brown, have a unique challenge to get their data. Unlike other fields of astronomy, where the objects of interest, like planets or distant galaxies, are usually so far away that they can be observed from virtually any point on the globe,  occur much closer to Earth, and most burn up in the atmosphere at heights of around 100 km.

Video showing the aurora captured by a GMN camera in Alaska. Credit: Bill Witte.

"Other astronomers can pool their resources to build a big telescope on top of a mountain where the skies are dark and clear year-round, but meteor astronomers need spatial coverage most of all," said Vida.

A bright, meteorite-dropping fireball can occur anywhere in the world, and can only be well observed from within a distance of 300 km. To get the exact fall location and the orbit, it needs to be observed by at least two cameras in two different locations. That's exactly what GMN provides.

Just a few months ago, the Winchcombe meteorite made international headlines. Several GMN cameras in the UK tracked the fireball together with other meteor networks, leading to important data retrieval and its eventual discovery on Earth. Spurred by the Winchcombe event, more than 150 meteor enthusiasts in the UK now want to install GMN cameras.

"There are already more than 100 existing ones in the UK, so that's really exciting," said Vida. "Its role in the recovery and analysis of the Winchcombe meteorite fall is proof positive that GMN works."

GMN started when Vida was an undergraduate student. The first system was installed at Western in 2017, and GMN has continued to grow since with cameras now in Ontario, Quebec and Alberta, as well as the United States, the UK, Spain, Belgium, Croatia and Brazil.

"A few friends and I realized that we can use low-cost Raspberry Pi single-board computers and reduce the cost of a single meteor observing system by 10 times, allowing us to install many more cameras than was previously possible," said Vida.

Raspberry Pi computers are considered the most popular single-board systems and are often used in DIY projects or as a cost-effective system for learning to code.

An animated gif of a meteorite dropping fireball observed in Ontario in January 2020. Credit: University of Western Ontario

Beyond the thrilling visuals, GMN provides the world's meteor community with real-time awareness of the near-Earth meteoroid environment by publishing orbits of all observed meteors from around the globe within 24 hours of observation. The network also observes meteor showers in an effort to better understand flight patterns, flux capacities, and even predict future events.

The location of all the cameras and the latest data is available for anyone to explore, via the GMN website.
Large meteor lights up skies in Norway

More information: Denis Vidaet al, The Global Meteor Network—Methodology and First Results, arXiv:2107.12335 [astro-ph.EP] arxiv.org/abs/2107.12335


Ensuring sea turtles in rehab get a proper diet

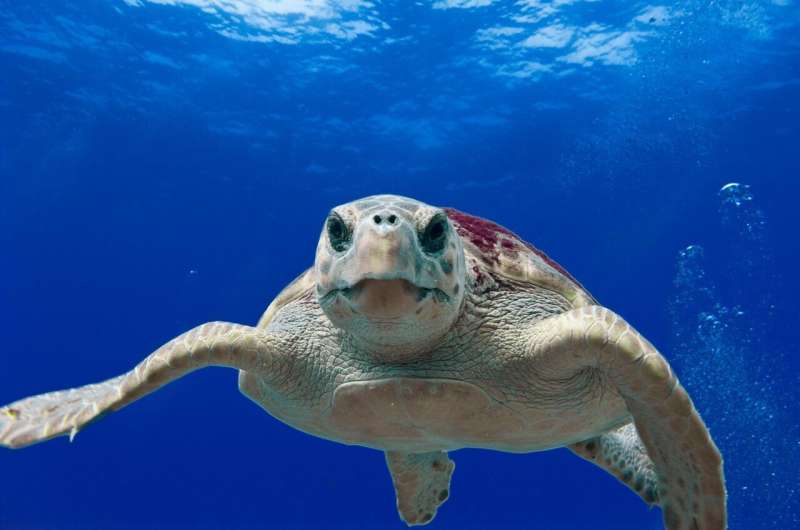
Loggerhead sea turtle
Loggerhead sea turtle. Credit: Pixabay

Loggerhead sea turtles (Caretta caretta) are opportunistic carnivores that primarily feed on invertebrates and fish. In the wild, they eat a variety of food items depending on their life stage and geographic location. For debilitated sea turtles in rehabilitation, part of the healing process is to provide a species-specific, balanced diet that provides nutrition similar to that of a wild diet to allow injured, ill, malnourished and incapacitated turtles to gain weight and improve body condition. However, developing the right nutritionally balanced formula is challenging.

To find answers, a team of scientists led by Florida Atlantic University's Harbor Branch Oceanographic Institute followed their 'gut' instinct. They hypothesized that analyzing the stomach contents and clinical pathology data of wild loggerhead turtles would enable development of nutritional indices that could be applied to better address the dietary needs of captive loggerheads.

For the study, published in the Journal of Animal Physiology and Animal Nutrition, they examined the stomach contents of 153 deceased loggerheads that stranded in coastal Georgia. Stomach contents information was used to determine common local prey items, which were then evaluated for nutritional content. They also compared hematology and plasma biochemistry profiles (including proteins, , and vitamins) between four cohorts of loggerhead turtles, including free-ranging subadults and adults, nesting females, and loggerheads undergoing rehabilitation at the Georgia Sea Turtle Center on Jekyll Island.

Comparisons from the study will enable scientists and clinicians to relate different life history stages to differences in blood health analytes, including several nutritional parameters not previously reported for loggerheads in this region. Results were also used to formulate a regionally specific, formulated  for tube feeding, and a supplement containing vitamins and minerals for captive loggerheads, to more closely approximate the nutritional content of their natural diet. A vitamin/mineral supplement and a critical care diet were designed based on these data (Mazuri 5B48 Sea Turtle Supplement and Mazuri 5S94 Sea Turtle Meal Diet for Carnivorous Turtles).

"Data from our study can be used to enable caretakers to more closely approximate a 'normal' diet for captive loggerhead turtles, including providing vitamin and mineral supplementation when appropriate," said Annie Page-Karjian, D.V.M., Ph.D., senior author, clinical veterinarian and an assistant research professor, FAU Harbor Branch. "Of course, understanding the current nutrient profile of diet items being fed is of critical importance as fish and other  for aquatic species can vary dramatically with regards to micronutrient and macronutrient content."

The research team from FAU Harbor Branch and the University of California, Davis; Georgia Sea Turtle Center; Georgia Aquarium; Marine Resources Division, South Carolina Department of National Resources, Marine Resource Research Institute; and EnviroFlight, identified a total of 288 different forage items. Crabs were by far the most common prey item, followed by fish, shrimp, gastropods such as snails and slugs, horseshoe crabs, bivalve mollusks such as clams, oysters, and mussels, and other invertebrates including tunicates, sponges, sea cucumbers, and soft coral.

The proportion of certain prey items differed significantly with turtle size; adult turtles ate proportionately more gastropods, and subadults ate proportionately more fish. None of the other proportions significantly differed between size classes. No gastropods, bivalve mollusks, or mixed invertebrates were identified in stomach contents of turtles in "poor" body condition, and  in "good" body condition ate proportionately more gastropods.

Of the 153 loggerheads, 76 (49.7 percent) had only one kind of identifiable forage item in their gastrointestinal tract, 42 (27.4 percent) had two, 22 (14.4 percent) had three, five (3.2 percent) had four, four (2.6 percent) had five, two (1.3 percent) had six, one (0.7 percent) had seven, and one (0.7 percent) had eight different kinds of forage items.

Seasonal effects were apparent in relative abundance of certain prey items, such as crabs in cooler months and bivalve mollusks in warmer months. Assessing the regional and temporal variability in loggerhead diets is an important component in their effective conservation because resultant data also can be used to help understand the impacts of environmental perturbations on benthic food webs.

"Results from our study support the hypothesis that loggerhead diet composition shifts and adapts over time to changing prey availability," said Page-Karjian. "In turn, such fluctuations in the food web may be related to environmental shifts such as  and also to human activities such as trawl fishing, which alters the food web composition by removing benthic crustaceans along with bycatch, and dredging, a practice that totally destroys benthic habitats."

Differences identified in the clinical pathology data from the study also highlight the need to develop baseline blood parameter reference intervals that are specific to the life history stage, which can be applied in a rehabilitation setting to help interpret clinical data for stranded loggerheads in various physiological states.

Mediterranean turtles recovering at different rates

More information: Christine M. Molter et al, Health and nutrition of loggerhead sea turtles ( Caretta caretta ) in the southeastern United States, Journal of Animal Physiology and Animal Nutrition (2021). DOI: 10.1111/jpn.13575


Complex marine forests collapsing into flat turf seascapes

marine
Credit: CC0 Public Domain

An international study led by The University of Western Australia has found that temperate marine ecosystems dominated by marine forests are collapsing into flattened seascapes of short turf algae across the globe.

The study, published in Global Change Biology, reveals that in Western Australia alone, thousands of hectares of underwater forests have collapsed into short carpets of seaweed .

Some of the other worst affected areas globally include southern Norway, eastern North America, the Mediterranean Sea and southern parts of Japan.

Lead author Albert Pessarrodona, from the UWA Oceans Institute and School of Biological Sciences, said marine forests were formed by large seaweeds that towered up above the , forming underwater canopies that house many species of fish, invertebates and algae.

"Although many studies have reported the local decline of these forests, ours is the first to quantify its global consequences," Mr Pessarrodona said.

"Not only is seaweed turf replacing  in many areas of the globe, but once turfs are able to expand, the seascape structure of those areas converges into very similar and simpler habitats, stripping oceans of the rich diversity of habitats supporting sea life."

Mr Pessarrodona said the results of the study were concerning, and could be attributed to a variety of impacts that varied from place to place, but humans were often the root cause.

"It's like your local woodland turning into garden turf—that is essentially what is happening under water."

Co-author Dr. Karen Filbee-Dexter, from the UWA Oceans Institute, said once turf algae was established, their carpets acted as sediment traps, retaining sediment in between the short algal filaments.

"In the affected areas in Western Australia, turf habitats now additionally retain approximately 242 million tons of sediment, which is 1,000 times more than what is delivered through the rivers every year," Dr. Filbee-Dexter said.

Co-author Professor Thomas Wernberg said all this sediment on the reef had been shown to limit the re-establishment of -forming species and feeding by fishes.

The scientists are currently working on ways to restore forests in the face of this global phenomenon, including the devolopment of "green gravel," an innovative new restoration tool.

The rise of turfs—flattening of global kelp forests

More information: Albert Pessarrodona et al, Homogenization and miniaturization of habitat structure in temperate marine forests, Global Change Biology (2021). DOI: 10.1111/gcb.15759
Journal information: Global Change Biology 


What will happen to sediment plumes associated with deep-sea mining?

sea floor
Credit: CC0 Public Domain

In certain parts of the deep ocean, scattered across the seafloor, lie baseball-sized rocks layered with minerals accumulated over millions of years. A region of the central Pacific, called the Clarion Clipperton Fracture Zone (CCFZ), is estimated to contain vast reserves of these rocks, known as "polymetallic nodules," that are rich in nickel and cobalt—minerals that are commonly mined on land for the production of lithium-ion batteries in electric vehicles, laptops, and mobile phones.

As demand for these batteries rises, efforts are moving forward to mine the ocean for these mineral-rich nodules. Such deep-sea-mining schemes propose sending down tractor-sized vehicles to vacuum up nodules and send them to the surface, where a ship would clean them and discharge any unwanted sediment back into the ocean. But the impacts of deep-sea mining—such as the effect of discharged sediment on marine ecosystems and how these impacts compare to traditional land-based mining—are currently unknown.

Now oceanographers at MIT, the Scripps Institution of Oceanography, and elsewhere have carried out an experiment at sea for the first time to study the turbulent sediment plume that mining vessels would potentially release back into the ocean. Based on their observations, they developed a model that makes realistic predictions of how a sediment plume generated by mining operations would be transported through the ocean.

The model predicts the size, concentration, and evolution of sediment plumes under various marine and mining conditions. These predictions, the researchers say, can now be used by biologists and environmental regulators to gage whether and to what extent such plumes would impact surrounding sea life.

"There is a lot of speculation about [deep-sea-mining's] environmental impact," says Thomas Peacock, professor of mechanical engineering at MIT. "Our study is the first of its kind on these midwater plumes, and can be a major contributor to international discussion and the development of regulations over the next two years."

The team's study appears today in Nature Communications: Earth and Environment.

Peacock's co-authors at MIT include lead author Carlos Muñoz-Royo, Raphael Ouillon, Chinmay Kulkarni, Patrick Haley, Chris Mirabito, Rohit Supekar, Andrew Rzeznik, Eric Adams, Cindy Wang, and Pierre Lermusiaux, along with collaborators at Scripps, the U.S. Geological Survey, and researchers in Belgium and South Korea.

Out to sea

Current deep-sea-mining proposals are expected to generate two types of sediment plumes in the ocean: "collector plumes" that vehicles generate on the seafloor as they drive around collecting nodules 4,500 meters below the surface; and possibly "midwater plumes" that are discharged through pipes that descend 1,000 meters or more into the ocean's aphotic zone, where sunlight rarely penetrates.

In their new study, Peacock and his colleagues focused on the midwater plume and how the sediment would disperse once discharged from a pipe.

"The science of the plume dynamics for this scenario is well-founded, and our goal was to clearly establish the dynamic regime for such plumes to properly inform discussions," says Peacock, who is the director of MIT's Environmental Dynamics Laboratory.

Credit: Massachusetts Institute of Technology

To pin down these dynamics, the team went out to sea. In 2018, the researchers boarded the research vessel Sally Ride and set sail 50 kilometers off the coast of Southern California. They brought with them equipment designed to discharge sediment 60 meters below the ocean's surface.

"Using foundational scientific principles from fluid dynamics, we designed the system so that it fully reproduced a commercial-scale plume, without having to go down to 1,000 meters or sail out several days to the middle of the CCFZ," Peacock says.

Over one week the team ran a total of six plume experiments, using novel sensors systems such as a Phased Array Doppler Sonar (PADS) and epsilometer developed by Scripps scientists to monitor where the plumes traveled and how they evolved in shape and concentration. The collected data revealed that the sediment, when initially pumped out of a pipe, was a highly turbulent cloud of suspended particles that mixed rapidly with the surrounding ocean water.

"There was speculation this sediment would form large aggregates in the plume that would settle relatively quickly to the deep ocean," Peacock says. "But we found the discharge is so turbulent that it breaks the sediment up into its finest constituent pieces, and thereafter it becomes dilute so quickly that the sediment then doesn't have a chance to stick together."

Dilution

The team had previously developed a model to predict the dynamics of a plume that would be discharged into the ocean. When they fed the experiment's initial conditions into the model, it produced the same behavior that the team observed at sea, proving the model could accurately predict plume dynamics within the vicinity of the discharge.

The researchers used these results to provide the correct input for simulations of ocean dynamics to see how far currents would carry the initially released plume.

"In a commercial operation, the ship is always discharging new sediment. But at the same time the background turbulence of the ocean is always mixing things. So you reach a balance. There's a natural dilution process that occurs in the ocean that sets the scale of these plumes," Peacock says. "What is key to determining the extent of the plumes is the strength of the ocean turbulence, the amount of sediment that gets discharged, and the environmental threshold level at which there is impact."

Based on their findings, the researchers have developed formulae to calculate the scale of a plume depending on a given environmental threshold. For instance, if regulators determine that a certain concentration of sediments could be detrimental to surrounding sea life, the formula can be used to calculate how far a plume above that concentration would extend, and what volume of ocean water would be impacted over the course of a 20-year nodule mining operation.

"At the heart of the environmental question surrounding deep-sea  is the extent of sediment plumes," Peacock says. "It's a multiscale problem, from micron-scale sediments, to turbulent flows, to ocean currents over thousands of kilometers. It's a big jigsaw puzzle, and we are uniquely equipped to work on that problem and provide answers founded in science and data."

The team is now working on collector plumes, having recently returned from several weeks at sea to perform the first environmental monitoring of a nodule collector vehicle in the deep ocean in over 40 years.

This research was supported in part by the MIT Environmental Solutions Initiative, the UC Ship Time Program, the MIT Policy Lab, the 11th Hour Project of the Schmidt Family Foundation, the Benioff Ocean Initiative, and Fundación Bancaria "la Caixa."

Understanding the impact of deep-sea mining

More information: Carlos Muñoz-Royo et al, Extent of impact of deep-sea nodule mining midwater plumes is influenced by sediment loading, turbulence and thresholds, Communications Earth & Environment (2021). DOI: 10.1038/s43247-021-00213-8
Journal information: Communications Earth & Environment 
This story is republished courtesy of MIT News (web.mit.edu/newsoffice/), a popular site that covers news about MIT research, innovation and teaching.


Deforestation only 'displaced' under community monitoring schemes

forest
Credit: CC0 Public Domain

Community-led monitoring of deforestation might not reduce forest use overall, but merely displace it to unmonitored areas, a new study finds.

The peer-reviewed study, by researchers including Dr. Sabrina Eisenbarth from the University of Exeter Business School, measured the impact of community-led forest  on activities such as tree felling, domestic animal grazing and charcoal production in community managed forest in Uganda.

The year-long research project paid six  from 60 communities to patrol the communal forest surrounding the village once a month.

The community monitors reported any threats to the forest every month and shared information with the wider community in village meetings, providing an opportunity for discussion around forest use and sustainability.

The research team evaluated the effect of this monitoring activity on forest use in both monitored and unmonitored areas.

They looked at a combination of detailed forest measurement on the ground and satellite data from the 60 communities and compared it to equivalent forest measurement in 50 control communities without systematic community-led monitoring.

The researchers found that community-led forest monitoring did not affect forest use overall. While forest loss decreased slightly in the monitored villages, amounting to 450 m2 of forest per village, forest use in areas adjacent to those villages, where there was no or less monitoring, rose by 300% and 150% respectively—totalling an extra 12,600 m2 of forest loss.

Nearly a third of forests across Africa, Asia and Latin America are now managed by local people and community forest management has been hailed as a powerful policy tool that could reduce deforestation—one of the main drivers of climate change.

Previous research has shown that communities can successfully manage their forests, but only if certain institutional features are in place—one of those features is community-led forest monitoring.

Monitoring helps communities find out how much forest is being cut down, punish those who cut too much and adjust norm and rules on forest use.

The research team had initially hypothesized that community monitoring would decrease forest use, with potential rule-breakers deterred by the fear of being caught and the information provided to community members driving a shift in norms over forest use, leading to a change in the official forest-use rules.

But one of the authors, Dr. Sabrina Eisenbarth, a Lecturer in Economics at the University of Exeter Business School's Land, Environment, Economics and Policy (LEEP) Institute, said the fear of being caught was potentially moving the deforestation to other areas.

"We suspect that the increase in forest loss in unmonitored areas is, at least to some extent, driven by displacement of forest use by members of treatment villages due to fear of sanctions.

"If reductions in forest use are driven by a fear of being caught rather than self-restraint, community members could merely displace forest use outside of the monitored areas and accelerate deforestation in adjacent areas."

The research team say more attention is needed to the design of conservation programs based on community monitoring in order to avoid displacement.

"If displacement is driven by a fear of sanctions, the design of a monitoring intervention might be improved if monitoring was more widespread or if community members could not predict which parts of the forest were unmonitored," said Dr. Eisenbarth.

The researchers said the success of community-monitoring schemes ultimately depends on 'community self-restraint', which might require changes in the norms and rules around  use. The one-year community monitoring intervention did not lead to such norm-shifts.

Rise in Southeast Asia forest clearance increasing greenhouse gases

More information: Sabrina Eisenbarth et al, Can community monitoring save the commons? Evidence on forest use and displacement, Proceedings of the National Academy of Sciences (2021). DOI: 10.1073/pnas.2015172118
Provided by University of Exeter 


Global warming will result in stronger and more frequent heatwaves in Southeast Asia

sun
Credit: Pixabay/CC0 Public Domain

Scientists have been informing people that the frequency and intensity of extreme events will increase in the future with the increased global mean temperature.

The Intergovernmental Panel on Climate Change (IPCC) Fifth Assessment Report (AR5) suggested that the increases in the seasonal and annual mean temperature are expected to be more prominent in the tropics and subtropics than in mid-latitudes. It implies that Southeast Asia may suffer more from global warming than other regions of Asia. However, it is not clear how heatwaves in Southeast Asia will change under global warming.

Ph.D. student Dong Zizhen and Prof. Wang Lin from the Institute of Atmospheric Physics (IAP) of the Chinese Academy of Sciences gave the answer to the question. Their study was published in Earth's Future.

Based on the bias-corrected model outputs from the Community Earth System Model Large Ensemble project, they estimated the changes in Southeast Asian heatwaves under different global warming levels.

According to their study, the projected warmer future tends to be associated with more frequent heatwaves, longer heatwave duration, and higher extreme temperature in Southeast Asia. The changes in heatwave characteristics have distinct regional differences in response to  between the Maritime Continent and Indochina Peninsula due to the different heat content of lower atmospheric boundaries.

Wang Lin, the corresponding author of the work, warned, "The extreme heatwave event, such as the heatwave that happens only once-in-50-years and is rare in the current climate, will become more frequent in a warmer future, and may happen once a year in Southeast Asia."

The world endured 2 extra heatwave days per decade since 1950 – but the worst is yet to come

More information: Zizhen Dong et al, Heatwaves in Southeast Asia and Their Changes in a Warmer World, Earth's Future (2021). DOI: 10.1029/2021EF001992


Small climate changes can have devastating local consequences–it happened in the Little Ice Age

Small climate changes can have devastating local consequences – it happened in the Little Ice Age
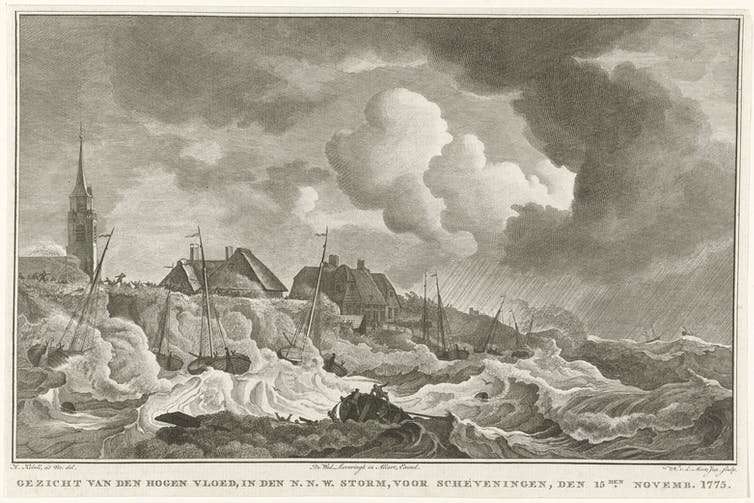
Disastrous storms, like one in 1775 in the Netherlands, were documented by engravers 
and other artists. Credit: Noach van der Meer II, after Hendrik Kobell

In recent weeks, catastrophic floods overwhelmed towns in Germany and the Netherlands, inundated subway tunnels in China, swept through northwestern Africa and triggered deadly landslides in India and Japan. Heat and drought fanned wildfires in the North American West and Siberia, contributed to water shortages in Iran, and worsened famines in Ethiopia, Somalia and Kenya.

Extremes like these are increasingly caused or worsened by human activities heating up Earth's climate. For thousands of years, Earth's climate has not changed anywhere near as quickly or profoundly as it's changing today.

Yet on a smaller scale, humans have seen waves of extreme weather events coincide with temperature changes before. It happened during what's known as the Little Ice Age, a period between the 14th and 19th centuries that was marked by  and bitter cold spells in parts of the world.

The  is believed to have cooled by less than a half-degree Celsius (less than 0.9 F) during even the chilliest decades of the Little Ice Age, but locally, extremes were common.

In diaries and letters from that period, people wrote about "years without a summer," when wintry weather persisted long after spring. In one such summer, in 1816, cold that followed a massive volcanic eruption in Indonesia ruined crops across parts of Europe and North America. Less well known are the unusually cold European summers of 1587, 1628 and 1675, when unseasonal frost provoked fear and, in some places, hunger.

"It is horribly cold," author Marie de Rabutin-Chantal wrote from Paris during the last of these years; "the behavior of the sun and of the seasons has changed."

Winters could be equally terrifying. People reported 17th-century blizzards as far south as Florida and the Chinese province of Fujian. Sea ice trapped ships, repeatedly enclosed the Chesapeake Bay and froze over rivers from the Bosporus to the Meuse. In early 1658, ice so completely covered the Baltic Sea that a Swedish army marched across the water separating Sweden and Denmark to besiege Copenhagen. Poems and songs suggest people simply froze to death while huddling in their homes.

These were cold snaps, not heat waves, but the overall story should seem familiar: A small global change in climate dramatically altered the likelihood of extreme local weather. Scholars who study the history of climate and society, like me, identify these changes in the past and find out how human populations responded.

Small climate changes can have devastating local consequences – it happened in the Little Ice Age
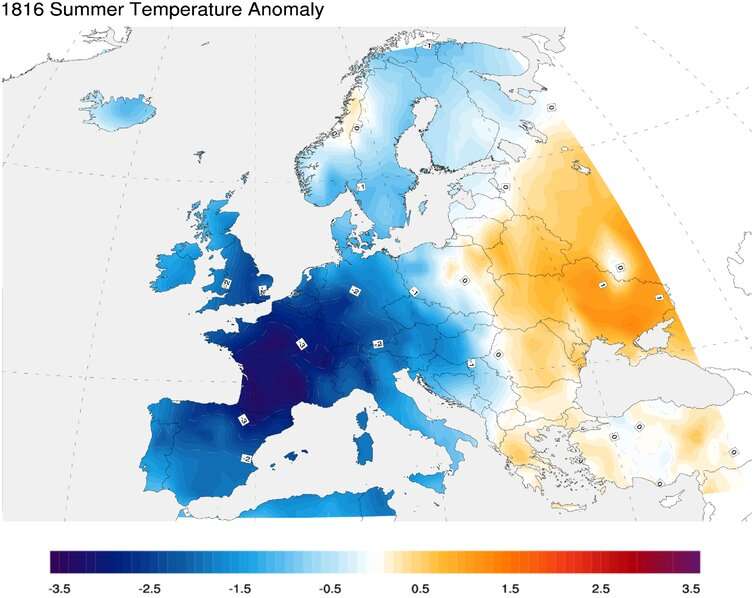
Temperatures fell well below normal in parts of Europe in 1816. Credit: Dagomar Degroot, 
CC BY-ND

What's behind the extremes

We know about the Little Ice Age because the natural world is full of things like trees, stalagmites and ice sheets that respond to weather while growing or accumulating gradually over time. Specialists can use past fluctuations in their growth or chemistry as indicators of fluctuations in climate and thereby create graphs or maps—reconstructions—that show historical climate changes.

These reconstructions reveal that waves of cooling swept across much of the world. They also suggest likely causes—including a series of explosive volcanic eruptions that abruptly released sunlight-scattering dust into the stratosphere; and slow, internal variability in regional patterns of atmospheric and oceanic circulation.

These causes could only cool the Earth by a few tenths of a degree Celsius during the chilliest waves of the Little Ice Age, however. And the cooling was not nearly as consistent as present-day warming.

Small global trends can mask far bigger local changes. Studies have suggested that modest cooling created by volcanic eruptions can reduce the usual contrast between temperatures over land and sea, because land heats and cools faster than oceans. Since that contrast powers the monsoons, the African and East Asian summer monsoons can weaken after big eruptions. That likely disturbed atmospheric circulation all the way into the North Atlantic, reducing the flow of warm air into Europe. This is why parts of Western Europe, for example, may have cooled by more than 3 C (5.4 F) even as the rest of the world cooled far less during the 1816 year without a summer.

Feedback loops also amplified and sustained regional cooling, similar to how they amplify regional warming today. In the Arctic, for example,  can mean more, longer-lasting sea ice. Ice reflects more sunlight back into space than water does, and that feedback loop leads to more cooling, more ice and so on. As a result, the comparatively modest climate changes of the Little Ice Age likely had profound local impacts.

Changing patterns of atmospheric circulation and pressure also led in many regions to remarkably wet, dry or stormy weather.

Heavy sea ice in the Greenland Sea may have diverted the North Atlantic storm track south, funneling severe gales toward the dikes and dams of what are today the Netherlands and Belgium. Thousands of people succumbed in the 1570 All Saints' Day Flood along the German and Dutch coast, and again in the Christmas Flood of 1717. Heavy precipitation and water pooling behind dams of melting ice repeatedly overwhelmed inadequate flood defenses and inundated central and Western Europe. "Who would not take pity on the city?" one chronicler lamented after seeing his town under water and then on fire in 1602. "One storm, one flood, one fire destroyed it all."

Small climate changes can have devastating local consequences – it happened in the Little Ice Age
Visualizing temperature anomalies over 2,000 years, with colder temperatures in darker
 blues and hotter temperatures in darker reds, shows the chilly periods of the Little Ice Age
 and the extreme warming of today. Credit: Ed Hawkins

Cooling sea surface temperatures in the North Atlantic Ocean probably also diverted the rain-giving winds around the equator to the south, provoking droughts that undermined the water infrastructure of 15th-century Angkor.

Owing perhaps to the modest cooling of volcanic dust veils, disrupted patterns of atmospheric circulation led in the 16th century to severe droughts that contributed to food shortages across the Ottoman Empire. In 1640, the grand canal that supplied Beijing with food simply dried up, and a short but profound drought in 1666 primed the wooden infrastructure of European cities for a wave of catastrophic urban fires.

How does it apply to today?

Today, the temperature shift is going in the other direction—with global temperatures already 1 C (1.8 F) higher than before the industrial era, and local, sometimes devastating, extremes occurring around the world.

New research has found that extreme , those that don't just break records but shatter them, become more common when temperatures change rapidly.

These serve as a warning to governments to redouble their efforts to limit warming to 1.5 C (2.7 F), relative to the 20th-century average, while also investing in the development and deployment of technologies that filter greenhouse gases out of the atmosphere.

Restoring the chemistry of the atmosphere will still take many decades after countries bring down their greenhouse gas emissions, and so communities must adapt to a hotter and less habitable planet. Nations andcommunities might learn from some of the success stories of the Little Ice Age: Populations that prospered were often those that provided for their poor, established diverse trade networks, migrated from vulnerable environments, and above all adapted proactively to new environmental realities.

People who lived through the Little Ice Age lacked perhaps the most important resource available today: the ability to learn from the long global history of human responses to climate change.

What was the Medieval warm period?
Provided by The Conversation 
This article is republished from The Conversation under a Creative Commons license. Read the original article.The Conversation


CYBERWAR

S.Africa's port terminals still disrupted days after cyber-attack

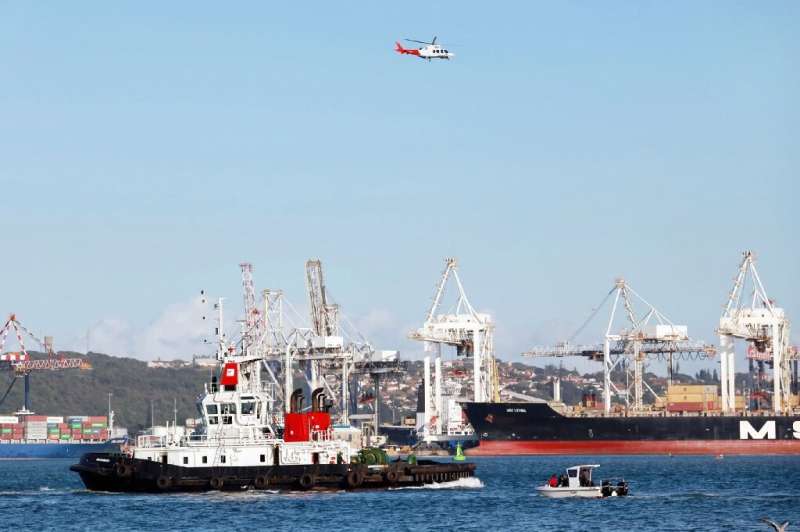
Durban is the biggest cargo port in sub-Saharan Africa
Durban is the biggest cargo port in sub-Saharan Africa.

South Africa's state-owned logistics firm said Tuesday it was working to restore systems following a major cyber-attack last week that hit the country's key port terminals.

The attack began on July 22 but continued, forcing Transnet to switch to manual systems, it said.

In a letter to its customers dated Monday, the company declared a force majeure—a clause that prevents a party from fulfilling a contract because of external and unforeseen circumstances.

It said it had "experienced an act of cyber-attack, security intrusion and sabotage, which resulted in the disruption of... normal processes and functions."

The attack has affected ports in Durban—the busiest in sub-Saharan Africa—as well as Cape Town, Port Elizabeth and Ngqura, Transnet said in the "confidential" notice seen by AFP on Tuesday.

In a statement later on Tuesday, the firm said it expected to lift the force majeure "soon" following "significant progress in restoring" its systems.

"It is expected that some applications may continue to run slowly over the next few days," it said.

The outage came on the heels of civil unrest sparked by the jailing of ex-president Jacob Zuma that halted operations for several days.

"The last few days have been the nail in the coffin," said Dave Watts, a consultant to the South African Association of Freight Forwarders.

"Up to this morning nothing is moving out of the ports, zero, since Thursday," he told AFP.

"It's a nightmare. It's just a catastrophe, frankly," he said, noting that the disruption had occurred at the peak of the citrus export season, when South African farmers were rushing to get their produce to foreign markets. "It's a perfect storm".


Explore further

S.Africa's Aspen releases first batch of Johnson vaccine

© 2021 AFP