Wednesday, April 15, 2026

Federal Spending Rises To Post-Covid High In Wake Of DOGE Failure – OpEd


April 15, 2026 
MISES
By Ryan McMaken


The US Treasury Department last week released its monthly report on federal spending and revenue. March spending for the US federal government was up by more than $20 billion, or by nearly four percent, from March of last year. In spite of the administration’s claims last year that Trump would implement hundreds of billions in spending cuts, the US federal government is now spending at higher levels than anything seen since 2021 when covid-related spending surged above all previous historical peacetime levels.

Meanwhile, the US is on track to spend more than a trillion dollars on interest on the debt this year, and this number will only go up as interest rates on federal Treasurys look poised to rise further. Moreover, recent numbers reflect only a small amount of the true war costs coming out of the war with Iran. The full brunt of the runaway spending that will come out of this war have yet to be felt. Indeed, the war with Iran, with no end in sight, is now estimated to be on track to cost more than a trillion dollars above and beyond the current $900 billion pentagon budget, going into 2027. If current trends continue, federal spending in 2027’s fiscal year will make 2026 spending look mild by comparison.
Federal Spending in 2026 Fiscal Year

According to the Treasury’s report, the US federal government spent $548 billion during March, an increase of $20.7 billion, or 3.9 percent over March of 2025. The total federal deficit for the month was up as well, with a total March deficit of $164.1 billion. That’s up from March 2025’s deficit of $160.5 billion.

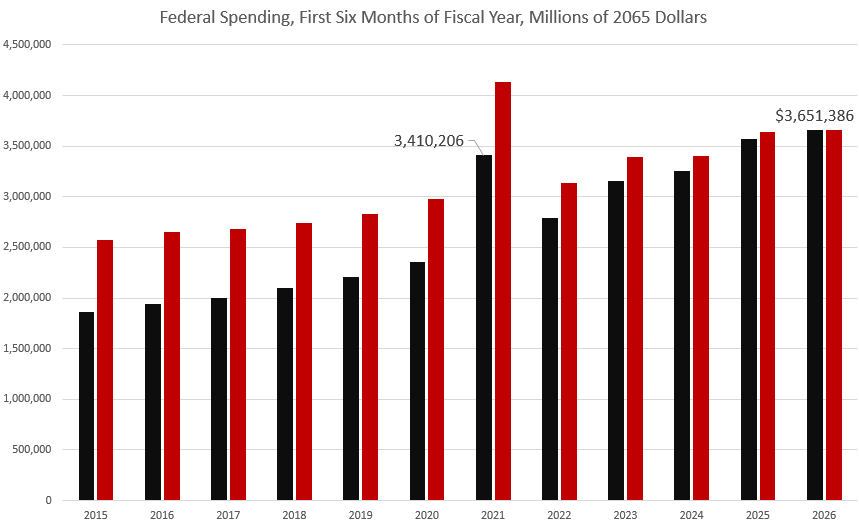
Looking at the first six months of the current fiscal year combined—a period which began on October 1, 2025—federal spending was up by $83.9 billion, or 2.3 percent. At $3.6 trillion for the fiscal year so far, that’s the highest level of spending ever, and is now even higher than spending during the days of juiced-up covid-panic outlays. Even when adjusted for inflation, 2026’s spending for the first six months of this fiscal year is at the highest level for every year except for 2021. In other words, the only other year with higher spending was the year when Trump ratcheted up spending toward the end of the 2020 calendar year—which was an election year. Trump continued to push historically high spending levels for the first four months of the 2021 fiscal year, until he finally left office at the end of January 2021.


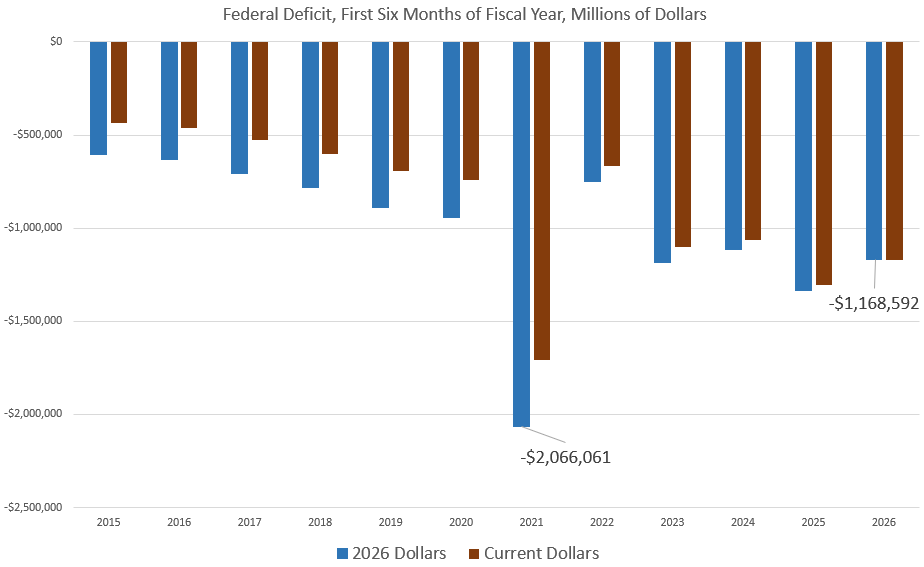
For the first six months of this fiscal year, the total deficit grew to the second-largest total since 2021, climbing to $1.17 trillion. Last year, the deficit for the first half of the year was $1.31 trillion. Adjusted for CPI inflation, the deficit during the first six months of this fiscal year came in behind 2021, 2023, and 2025. This year, however, as war expenses climb, and as Treasury yields rise, US federal spending is on track to top two trillion for the first time since 2021.


War Costs Mount

It is likely that the US had already spent at least $16 billion on the Iran war in just the first three to five days. Overall, estimates suggest the war costs the US taxpayer approximately $2 billion per day. Most official estimates of the war’s cost greatly underestimate the total because official estimates are usually based on the original costs for munitions and ships. Replacement costs are likely to be much higher than the cost of the initial production. Moreover, official costs in recent decades have reliably underestimated the total price tags for wars.

For example, during the Iraq war, when George W. Bush’s economic advisor, Larry Lindsey, suggested the war might cost as much as $200 billion, he was fired. Defense Secretary Donald Rumsfeld said that number was “baloney.” The true cost of the war ended up being over $5 trillion. In other words, US government estimates of war costs are not to be taken seriously.

In any case, at current spending levels, the Iran war will likely cost US taxpayers at least $100 billion by early May. The war will greatly add to the total deficit by the end of the current fiscal year, and this will further add to the federal debt, which, as of the end of March, stood at $39.1 trillion. Since Trump was sworn in for his second term 14 months ago, the total federal debt has increased by $2.9 trillion Indeed, if we combine the total debt accumulated during Trump’s first term and his second term, so far, the US has added more than $10.4 trillion, or more than 26 percent of the entire national debt.


Interest Payments on the Federal Debt

With debt levels rising rapidly, and with Treasury yields no longer falling, interest payments on the national debt have become a substantial part of federal outlays. In March, for example, the US paid more than $102 billion, just for interest on the debt. For the first six months of this fiscal year, the total has been more than $622.5 billion. Nearly one dollar for every dollar spent now goes to interest on the debt. The Treasury department estimates that the total paid out in interest by the end of this year will be $1.3 trillion.

That number is likely to increase going forward, since there is good reason to believe that yields on Treasurys will go up, and this will drive up overall debt service costs as the US must refinance trillions of its debt at higher interest rates. During 2026, more than $10 trillion of US debt will mature. Naturally, the US does not have the money to pay off these Treasurys, so the US will have to refinance these costs with new bond issuance. Yet, Treasury yields are higher now than they were when most Treasurys were initially issued, so this will further increase the cost of the debt. The ten-year yield, for example, has been near a nineteen-year high for the past six months.

Rising yields are partly due to the fact that rising deficits mean the US Treasury must continue to issue hundreds of billions in new Treasurys every few months. As the market is flooded with these Treasurys, prices go down, which means yields go up. Recent Treasury auctions have indeed hinted that demand for Treasurys is weak. On March 28, Fortune reported:

President Donald Trump’s war on Iran is colliding with U.S. debt investors, who demonstrated less appetite for Treasury securities as hopes for a quick end to the conflict evaporate …The short end of the yield curve is under extra pressure as soaring oil prices boost the inflation outlook and put additional rate cuts from the Federal Reserve on hold, with odds of a rate hike also increasing.

(The odds of a rate hike are rising because price inflation remains stubbornly near three percent, well above the Fed’s two-percent target. This is all in spite of the Fed’s repeated assurances in recent years that price inflation was headed rapidly toward the target level.)

Rising war costs, coupled with growing debt levels, will further encourage volatility:

The U.S. Treasury market has entered a period of intense volatility this April, marked by a dramatic steepening of the yield curve that has caught many institutional investors off guard. For the first time in over two years, the benchmark 10-year Treasury yield has surged past the 4.30% threshold, reaching as high as 4.39% in mid-April 2026. This shift signals a fundamental “re-pricing” of long-term risk as the market grapples with a resurgent inflation narrative and a geopolitical energy shock that has dismantled hopes for a “soft landing” in the second half of the year.

Thanks to rising debts, deficits, and yields, we can expect the central bank to intervene to monetize the debt and bring down yields. In fact, the Fed has been intervening to do exactly this since December when the Fed announced that it would begin buying up $40 billion of Treasurys per month. Since December, the Fed has added $163 billion to its portfolio, meaning the Fed has essentially created 163 billion new dollars in an effort to reduce Treasury yields. This will fuel more price inflation—either in assets or in consumer goods. This all comes in spite of years of Fed promises to eliminate the Fed’s stockpile of Treasurys which peaked at $5.7 trillion in 2022. The persistence of this easy-money financed purchasing of Treasurys has been a major factor in the 40-year highs in price inflation reached in 2022, and has reduced American’s purchasing power by nearly 25 percent since 2020.

We’ve come a long way from early 2025 when the Trump administration was claiming that it would slash federal spending with cuts through the so-called “Department of Government Efficiency” (DOGE). That was clearly an immense failure, with no more than $33 billion in confirmed cuts to federal spending. That’s far less than a single month’s payment on the federal debt, and less than a single month’s cost of carrying on the Iran War.

At the same time it was pretending to cut federal spending, the Trump administration was claiming that it would cut spending so much that it could eliminate the federal income tax and rely on import taxes instead. Anyone who knew anything about US fiscal policy knew that was absurd, of course. Taxes on imports, even with recent growth in revenue, amount to a small percentage of the federal government’s immense receipts total. But many Trump supporters bought the idea. In the real world, however, there will be no spending cuts and the income tax is certainly not in danger. Instead of that, the Trump administration has subjected to the American taxpayers to even more federal spending and higher interest rates fueled by larger debts. 


About the author: Ryan McMaken (@ryanmcmaken) is editor in chief at the Mises Institute, a former economist for the State of Colorado, and the author of two books: Breaking Away: The Case of Secession, Radical Decentralization, and Smaller Polities and Commie Cowboys: The Bourgeoisie and the Nation-State in the Western Genre. He is also the editor of The Struggle for Liberty: A Libertarian History of Political Thought. Ryan has a bachelor’s degree in economics and a master’s degree in public policy, finance, and international relations from the University of Colorado. Send in your article submissions for the Mises Wire and Power and Market, but read article guidelines first.
 
Source: This article was published by the Mises Institute

The Mises Institute, founded in 1982, teaches the scholarship of Austrian economics, freedom, and peace. The liberal intellectual tradition of Ludwig von Mises (1881-1973) and Murray N. Rothbard (1926-1995) guides us. Accordingly, the Mises Institute seeks a profound and radical shift in the intellectual climate: away from statism and toward a private property order. The Mises Institute encourages critical historical research, and stands against political correctness.
Hydropower Generation Expected To Recover Despite Snow Drought In US West – Analysis

The Dalles Dam on the Columbia River between Oregon and Washington. Photo Credit: USGS, Wikipedia Commons


April 15, 2026 
By EIA


In our April Short-Term Energy Outlook (STEO), we expect U.S. hydropower generation will increase by 5% in 2026 but remain 1.8% below the 10-year average following snow drought conditions in some states. Hydropower generation in 2025 increased to 245 billion kilowatthours (BkWh), about 4 BkWh more than the record-low generation year 2024. In 2026, we expect generation will be 259 BkWh, which would represent 6% of U.S. electricity generation.

Seasonal precipitation in the form of rain and snowpack accumulation are the two main factors that help predict water supply and hydropower generation. Seasonal precipitation influences soil moisture, and moister soil helps to preserve the snowpack, which in turn acts as a natural reservoir.

According to data from the Western Regional Climate Center, precipitation levels across the western United States have been mostly normal. However, many states in this region have experienced record warm winter temperatures leading to snow drought conditions. A heat wave in March affecting much of the western United States also led to early snowmelt especially around California, the Southwest, and portions of the Northwest. These conditions will likely affect hydropower generation, as less water supply is expected in the spring and summer months.
Northwest

The Columbia River Basin in the Northwest region contains more than one-third of U.S. hydropower capacity and generates enough electricity to power over 4 million homes. Changes in water supply in the Northwest can affect the use of other electricity-generating fuels in the region, such as natural gas, and can affect electricity trade with neighboring areas.

We expect hydropower generation in the Northwest and Rockies region to be 125 BkWh, which is a 17% increase compared with 2025 and 4% less than the 10-year average. Hydropower generation in December 2025 and January 2026 was unusually high due to a series of atmospheric rivers that led to devastating flooding in the region. Our hydropower forecast is informed by the water supply outlook from the National Oceanic and Atmospheric Administration’s Northwest River Forecast Center.

Data source: U.S. Energy Information Administration, 
Short-Term Energy Outlook (STEO), April 2026


California

We forecast hydropower generation in California to be 28.5 BkWh in our April STEO, which is 6% less than last year’s generation but 15% more than the 10-year average.

As of April 1, reservoir levels in most major reservoirs in California were above the 30-year historical average for this time of year. The two largest reservoirs in the state, Shasta and Oroville, were at 114% and 124% of the historical average, respectively. The state of California also experienced three consecutive weeks of no drought or drier than normal conditions. However, according to the California Department of Water Resources, snowpack conditions as of April 1 were well below normal with Northern Sierra Nevada at 7%, Central Sierra at 25%, and Southern Sierra at 39%. Additionally, warmer-than-normal temperatures in March led to some early snowmelt across the state.

Principal contributor: Lindsay Aramayo

Source: This article was published by EIA

EIA

The U.S. Energy Information Administration (EIA) collects, analyzes, and disseminates independent and impartial energy information to promote sound policymaking, efficient markets, and public understanding of energy and its interaction with the economy and the environment.


After 9,000 Years Of Cultivation, Rice Has Reached Its Thermal Limit


By 

Rice has historically been a heat-loving plant. In fact, the wild ancestor of cultivated rice once grew primarily on the sweltering, rain-swept Malay and Indochina peninsulas as well as the islands of Southeast Asia. It wasn’t until Earth’s climate warmed after the last ice age that wild rice substantially spread into central China and South Asia, where it was independently domesticated by humans in two events that arguably rank among the most important in the history of our species.

Rice fueled many of the earliest civilizations and remains a virtually indispensable source of food in the modern world. Today, half of all humans get 20% of their calories from rice, and more than a billion people are reliant on the production and distribution of rice for their livelihoods.

That might be about to change. Scientists warn that over the next 50 years, global warming caused by the emission of greenhouse gases will accelerate to a pace that is 5,000 times faster than rice, and many other crop species, have ever had to contend with at any time during their evolutionary history.

Left to its own devices, even rice — with its proclivity for heat — would almost certainly be unable to keep up. With the help of humans, who carefully breed and genetically engineer new varieties, it’s possible rice will be able to cope. But, said Nicolas Gauthier, curator of artificial intelligence at the Florida Museum of Natural History, the best-case scenario is not something anyone’s looking forward to.

“These changes are going to be disruptive, and the process of adaptation doesn’t come for free. It has to be done with intention and might not be pleasant,” he said.

Gauthier is the lead author of a new study that combines data from multiple scientific disciplines to predict the possible future for rice — or lack thereof — in a rapidly warming world. The prognosis is grim.

“Regions in the south, such as Indonesia and Malaysia, are the ones that are going to be most heavily impacted, and the process of adapting is going to leave a lot of people out of the loop. Those who depend on rice for their subsistence today aren’t necessarily the ones who are going to be able to access the new genetic varieties that are developed.”

The threat to food security posed by global warming is multifaceted, and in the case of rice, it involves a long history of adaptation in the opposite thermal direction toward cooler climates.

Rice was initially domesticated in the Yangtze River basin in central China between 7,000 and 9,000 years ago, when balmy temperatures and frequent rain made it possible for humans to develop agricultural societies around the world. Trade networks connected these societies like hyphae, and early rice cultivars were among the many goods that streamed along them.  

Based on archaeological evidence, rice farms in China expanded to the north and east along the course of the Huang He River and westward into interior China beginning roughly 5,000 years ago and continuing for a millennium. Then, about 4,200 years ago, a period of abrupt cooling and drought struck much of Eurasia, causing several civilizations — including the Akkadian Empire and the Egyptian Old Kingdom — to wane.

Rice farmers in China adapted by cultivating new varieties of rice that could tolerate colder temperatures. The existence of these new cold-tolerant varieties eventually allowed rice production to spread to regions with more temperate climates, such as Korea and Japan.

In contrast, transitioning from cold to hot climates can involve more than just a plant expediting its developmental timeline.

“You don’t see that kind of flexibility on the hot end because at some point, the plant will physically stop working,” Gauthier said.

By way of analogy, if you were to move into a house north of the Arctic Circle, you might compensate for the longer winters by staying inside for a greater portion of the year and staying outdoors as long as possible during the 20-hour halcyon days of summer. But if you move to a place where summers get too hot, you might suffer from heat stroke. Spending the summer indoors might be an option for you, but rice gets all its nutrition from being out in the sun and doesn’t have that luxury.

Gauthier wanted to know the upper temperature threshold beyond which modern rice varieties are unable to extend. Working with colleagues from New York University and the University of Washington, Gauthier combined archaeological and botanical records, including satellite imagery, agricultural records and herbarium data, to figure out where rice was grown historically and where it grows now.

This resulted in a map to which they could add current, historical and future climate projections. Using this, they determined that rice today is grown almost entirely in areas with a mean annual temperature of less than 82° degrees Fahrenheit and an average monthly maximum of less than 104 F. This aligns well with data from other studies that demonstrate rice begins showing signs of heat stress at anything above 91 F

With this baseline in hand, the authors used artifacts from 803 archaeological sites to trace the historical movement of rice and determine how that coincided with past temperatures. The results indicate that at no point during its 9,000 years of cultivation has rice ever been grown in a region with a mean annual temperature of more than 82 F. There were a few archaeological sites in northern India and Pakistan in which the average monthly maximum temperature exceeded 104 F, but given the arid climate of these regions, the authors note that long-distance trade may be a more plausible explanation for how rice ended up at those locations rather than it having been grown there.

Thus, 104 F seems to be the cutoff, and anything with an annual average above 82 F is pushing it.

Finally, the authors projected future global temperatures using climate models to see where rice might have a chance of growing over the next century. By 2070, the results suggest that almost the entire southern distribution of rice, from India through Malaysia, will have mean annual temperatures of more than 82 F. A maximum monthly average temperature of more than 104 F during the hottest months of the year is expected for most of India, as well as parts of China and the Middle East.

India became the world’s top rice-producing country, a title previously held by China, after growing nearly 150 million metric tons of rice grain. Were anything to suddenly and negatively affect India’s ability to grow rice, ensuing mass starvation is a very real possibility. 

Under business-as-usual models of climate change, in which countries are collectively unable to significantly reduce the emission of fossil fuels, rice growers and consumers have about 50 years to prepare for the worst. Much of that preparation and adaptation will probably involve growing tropical varieties of rice in what are today more temperate regions and growing temperate varieties at higher latitudes than they are currently able to grow. But even if this averts famine, Gauthier warned, the process will still be unutterably difficult and its effects distributed unequally.

“On an aggregate scale, it could be that, pound for pound, all the rice that won’t be able to grow in Southeast Asia could be grown in China instead, but that doesn’t change the impact on the people in Southeast Asia who can’t just start growing a new crop from scratch.”

Drinking Water Near Coasts Is Under Threat Worldwide


By 

Coastal groundwater is a key source of drinking water in many regions of the world. However, it is threatened by over-abstraction and the potential for salinization. Rising sea levels are further exacerbating the situation. This is demonstrated by a recent study published in Nature Water by a research team led by Professor Robert Reinecke from the Institute of Geography at Johannes Gutenberg University Mainz (JGU) and Annika Nolte from the Climate Service Center Germany (GERICS) in Hamburg.

“Between 1990 and 2024, more than 20 percent of the coastal areas we studied showed significant changes in the groundwater level. In some cases, levels have dropped by more than 50 centimeters per year. This points to over-abstraction and, consequently, the potential intrusion of seawater and associated salinization,” explained Professor Robert Reinecke. The interaction between over-abstraction and rising global sea levels due to global warming is particularly critical: “If groundwater levels drop, seawater can intrude more easily.”

Data from about 480,000 wells 

The study is based on data from approximately 480,000 wells across different countries, compiled by the researchers, making it the largest global dataset of coastal groundwater measurements to date. “Our study makes three key contributions. First, it translates available measurement data from different locations into globally comparable metrics, enabling large-scale assessment for the first time. Second, it identifies areas at particular risk and highlights the changes occurring there. Third, it provides indicators that can be used to model developments along previously unmonitored coastlines,” said Reinecke.

Changes in groundwater levels in the affected areas vary considerably: levels have risen in some locations, while in others they have declined. However, since 2016, researchers have observed an overall increase in declining groundwater levels. “The extent of groundwater-level change varies significantly, even on a small scale within many regions,” said Reinecke. Falling levels have been observed primarily along the coasts of the United States and Central America, the Mediterranean region, South Africa, India, and southern Australia.

The study also examined where coastal groundwater is particularly vulnerable to saltwater intrusion.

“Coastal areas where the groundwater table is close to sea level are especially at risk, as are arid regions where populations rely heavily on groundwater. Our study provides global evidence that coastal groundwater is threatened by salinization and must be prioritized for monitoring and management,” emphasized Reinecke. “Over the next 50 years, drinking water shortages could arise in all coastal areas of the world.”

This poses risks not only to the water supply of coastal populations – accounting for more than 30 percent of the world’s population – but also to local food production and ecosystems.


Whales Go Quiet During Noisy Underwater Surveys


By 

A new study has shown that whale calls can reduce by as much as 50 per cent in response to seismic surveys, which are commonly used to find oil and gas reserves.

Researchers are worried that such surveys could impact vulnerable marine species, which rely on sound for communication, navigation and foraging.

The paper, published in Scientific Reports, reveals how fin whale calls dropped dramatically along a key migratory corridor off northwestern Spain during seismic surveying.

The technique involves air guns shooting compressed air in powerful, loud, repeated bursts. Sound waves travel through the water, into the seabed, and bounce back to create a picture of the geological structures below.

The sound is one of the loudest human-made noises in the ocean and can travel more than three thousand kilometres from ships conducting the surveys

“Fin whales exhibit a range of whale calls that we think are related to important mating and social behaviours,” says Amy Feakes, a postgraduate researcher at the University of Southampton who co-led the research with masters student Elodie Edwards.  

“Despite significant concern about how these surveys might disrupt their calls, there have been very few studies and limited evidence available until now.”  

Researchers studied underwater recordings from three sites over 63 days to investigate how whale calls differed during periods of ‘shooting’ compared to quiet intervals when the ship was in port for repairs.

Using machine learning to identify and log the whale calls, the team found the number of calls dropped by an average of 70 per cent across the three sites during shooting periods.

Some calls would have been masked by the sound of the shots, but even when accounting for this effect, the decrease was still 52 per cent.

“We don’t know whether the whales reduced their vocalisations, moved away from the survey area, or did a combination of both,” says Professor Tim Minshull, also from the University of Southampton.

“Given the widespread use of seismic surveys and their capacity to propagate sound over long distances, these findings start to illuminate the potential impacts on fin whale communication, energy expenditure and habitat use.”

Researchers say the timing, intensity, and coverage of seismic surveys in areas important for whales need to be carefully considered to aid conservation efforts.

Exclusion zones, seasonal restrictions or using quieter seismic exploration technologies could also help reduce disruption to whale populations.

How Black Holes Light Up The Dark

Artist’s depiction of a supermassive black hole tearing apart a star, with roughly half of the stellar debris flung back into space while the remainder forms a glowing accretion disk around the black hole. CREDIT: DESY, Science Communication Lab

April 15, 2026 
By Eurasia Review

Supermassive black holes are among the most enigmatic objects in the universe. They typically weigh millions or even billions of times the mass of the Sun and sit at the centers of most large galaxies. At the heart of the Milky Way lies Sagittarius A*, our Galaxy’s supermassive black hole, with a mass of about four million Suns. But these black holes do not emit light, so astronomers can only detect them indirectly through their effects on nearby stars and gas.

In a new study published in the The Astrophysical Journal Letters, Eric Coughlin, assistant professor of physics in Syracuse University’s College of Arts and Sciences, and colleagues clarify what happens when a star wanders too close to one of these black holes and is torn apart.

When Black Holes Capture Stars

A star “ingested” by a supermassive black hole does not simply vanish in a single gulp. Instead, the black hole’s gravity tears the star into a long, thin debris stream. Over time, the debris stream wraps around the black hole – an effect that ultimately arises from Einstein’s General Theory of Relativity; gravity according to Newton does not produce this effect. When parts of that circling stream crash into one another, they release a burst of energy and subsequently “accrete,” or slowly spiral into, the black hole. Both of these effects – the initial collision and the subsequent accretion – produce so much radiation that they briefly outshine the entire galaxy in which they occur (i.e., ~ 1 trillion Suns).

Astronomers refer to these events as tidal disruption events, or TDEs. TDEs offer one of the few ways to study supermassive black holes like Sagittarius A* in other galaxies.

“We can study tidal disruption events to learn more about black holes hidden from view,” says Coughlin.

For years, TDEs have fascinated researchers because each of these massive flares is like a fingerprint. By measuring how a flare rises, peaks and fades, scientists can infer properties of the black hole that produced it, including its mass and perhaps its spin. But the details of how these flares form have remain
ed difficult to pin down, in part because the process is hard to simulate accurately.


Seeing the Debris Clearly

That is where new high-resolution simulations are changing the picture. Recent work by a team led by Lucio Mayer at the University of Zurich, including Coughlin, uses a methodology known as smoothed particle hydrodynamics, which decomposes a star into “particles” that interact with one another hydrodynamically (i.e., according to the Navier-Stokes equations – the same fundamental equations that govern the flow of water through a pipe). Their study employed tens of billions of particles to model the disrupted star’s gas in unprecedented detail. The result is a superior view of what happens after a star gets ripped apart. Rather than dispersing chaotically, the debris forms a narrow, coherent stream that follows a predictable path around the black hole before crashing into itself.

Their finding supports a long-standing theoretical prediction. Earlier simulations often mis-characterized the stream’s structure because they lacked the resolution to capture such fine detail, leading to a “spraying” of the stellar debris and unexpectedly high levels of fluid-dynamical dissipation. With far more particles and through the exploitation of graphics processing units (GPUs) on powerful supercomputers, the shape of the debris becomes much easier to see.

But the new models also reveal something else.


The Spin Factor

Three properties of a supermassive black hole and the stellar orbit can influence the outcome of a given TDE: the black hole’s mass, how fast it “spins,” and the orientation of that spin relative to the orbital plane of the incoming debris. Together, they may determine when the flare begins, how bright it becomes and how long it lasts.

If the black hole is rotating, it induces additional variation in the spacetime around it compared to a non-spinning black hole and produces an effect known as “nodal precession.” This effect may shift the debris stream out of its original plane, meaning the stream may miss itself after one orbit, then miss again before finally colliding. In some cases, the flare may be delayed by several loops around the black hole.

That complication may help explain one of the enduring puzzles of TDE research. No two events look exactly alike. Some rise quickly and fade fast. Others unfold more slowly. Some are brighter, some dimmer. Some behave in ways that are still hard to classify. While differences in the mass of the black hole could account for some of these differences, these new simulations suggest that black hole spin may be one of the key reasons for that diversity.

TDEs turn invisible objects into readable signals. A star gets shredded, debris collides, light emerges and a previously hidden black hole is revealed. With better simulations and more powerful telescopes, astronomers are learning how to read those signals more clearly than ever before.
VIDEO

Lost 19th Century Film By Méliès Discovered At The Library Of Congress


Photographic portrait of Georges Méliès at 34, in 1895. Photo Credit: Wikipedia Commons, retouched


April 15, 2026
 Library of Congress
By Neely Tucker

The reels of film were old and battered and no one knew what was on them.

They were from before World War I and had been shuttled around from basements to barns to garages and had just been dropped off at the Library. There were about 10 of them and they were rusted. Some were misshapen. The nitrate film stock had crumbled to bits on some; other strips were stuck together.

The librarians peeled them apart and gently looked them over, frame by frame.

And there, on one film, was a black star painted onto a pedestal in the center of the screen. The action was of a magician and a robot battling it out in slapstick fashion. It took a bit, but then the gasp of realization: They were looking at “Gugusse and the Automaton,” a long-lost film by the iconic French filmmaker George Méliès at his Star Film company.

The 45-second film, made around 1897, was the first appearance on film of what might be called a robot, which had endeared it to generations of science fiction fans, even if they knew it only by reputation. It had not been seen by anyone in likely more than a century. The find, made last September but now being announced publicly, is a small but important addition to the legacy of world cinema and one of its founders.Gugusse et l’Automate English language title: Gugusse and the automaton

“This story is one that you see movies or television shows written about,” says Jason Evans Groth, curator of the Library’s moving image section.

“This is one of the collections that makes you realize why you do this,” said Courtney Holschuh, the archive technician who unraveled the film. (Here’s how they did it.)

Equally delighted was Bill McFarland, the donor who had driven the box of films from his home in Grand Rapids, Michigan, to the Library’s National Audio-Visual Conservation Center in Culpeper, Virginia, to have the cache evaluated.

His great-grandfather, William Delisle Frisbee, had been a potato farmer and schoolteacher in western Pennsylvania by day, but by night he was a traveling showman. He drove his horse and buggy from town to town to dazzle the locals with a projector and some of the world’s first moving pictures.

He set up shop in a local schoolroom, church, lodge or civic auditorium and showed magic lantern slides and short films with music from a newfangled phonograph. It was shocking.

“They must have been thrilled,” McFarland said. “They must have been out of their minds to see this motion picture and to hear the Edison phonograph.”

A Méliès film would have been an unforgettable experience to almost anyone in the 19th century.

A prominent French stage magician, he turned to filmmaking as soon as he saw the Lumière brothers’ world-first motion pictures in Paris in 1895. That a camera could rapidly project a series of still images on film and thus make them appear to move – “motion pictures” – was seen as a magic trick unto itself.

Méliès built his own camera and a glass studio (like a greenhouse) in Paris. He filmed ordinary scenes at first, but after accidentally discovering that a jump cut appeared on film as an astonishing transformation, he pioneered other tricks such as double exposure, black screens and forced perspective. All of these became staples of cinema. On screen, he could make a man appear to take off his head and flip it in the air, or a woman disappear, reappear and double.

He was also a devotee of the science fiction work of Jules Verne and H.G. Wells, and his films often featured surreal, fantastical sets and manic action. An image from his most famous film, “A Trip to the Moon” – that of a rocket landing in the eye of the man on the moon – became the image representing early cinema. It now plays at the Museum of Modern Art in New York. His 1896 short, “Le Manoir du Diable,” is considered to be the world’s first horror film.

More than a century later, his lasting impact was exemplified in Martin Scorsese’s 2011 film “Hugo,” about a boy and an automaton in 1931 Paris. An elderly Méliès – by then, as in real life, a toy-shop owner largely forgotten by the world – appears as the boy’s soft-spoken savior.


“Gugusse,” for its part, is a one-shot, one-reel short filmed in front of a painted screen made to look like a workshop in which clocks and automatons were being made. For centuries, inventors and engineers had made wind-up automatons – contraptions full of gears and levers with a shell that looked like a person – that could, as the gears unwound, do all sorts of things, even writing and drawing.

In “Gugusse,” the magician (Méliès), winds up an automaton dressed like the famous clown Pierrot, which is standing on a pedestal. Once wound up, the clown begins to beat the magician with his walking stick. The magician retaliates by getting a huge sledgehammer and bashing the automaton over the head, with each blow seeming to shrink it in half, until it is just a small doll. The magician then smashes it into the floor.


Méliès made more than 500 films but never progressed beyond his early technical achievements. The film world passed him by. In World War I, the negatives for most of his films were melted down for silver and celluloid, and he burned more himself after the war.

But because his work had once been so popular – and because of widespread pirating – duplicate copies remained, and today about 300 of his films are known to exist. The Library has about 60. The “Gugusse” print McFarland gave to the Library is a duplicate at least three times removed from the original.

Library technicians spent more than a week scanning and stabilizing it onto a digital format, so that it can now be seen by anyone online – in 4K, no less.

The cache of Frisbee’s exhibition films also contained another well-known Méliès film from 1900, “The Fat and Lean Wrestling Match,” as well as fragments of an early Thomas Edison film, “The Burning Stable.” They survived due to McFarland and his family preserving them for a century, if often in haphazard circumstances.

After Frisbee died in 1937, two small trunks of his old projectors and films, along with some of his diaries and papers, went to his daughter (McFarland’s grandmother), who passed them along to her son (McFarland’s dad), who passed them along to him.

McFarland didn’t know what was on the reels – they could no longer be safely run through a projector – and after years of searching for a home for them, a lab technician in Michigan suggested he contact the Library.


“The moment we set our eyes on this box of film, we knew it was something special,” said George Willeman, the Library’s nitrate film vault leader.

McFarland, relieved to have finally found a home for his family’s treasure chest, found it all fascinating, the films and the diaries of his wandering showman of a great-grandfather.

“He talks about full houses, and rowdy houses, and canceled shows, and he went all the way to the Pennsylvania-Maryland line, and I think into Ohio as well,” he said. “He made as much as $20 bucks a night, I see in his records, and sometimes he made $1.35 for the night, you know?”

It was, this deep dive into the old boxes and trunks in the attic, a magic trick known to researchers, historians and librarians – documents from another time drawing you back into a world gone by.


This article was published by the Library of Congress

The Library of Congress is the largest library in the world, with millions of books, films and video, audio recordings, photographs, newspapers, maps and manuscripts in its collections. The Library is the main research arm of the U.S. Congress and the home of the U.S. Copyright Office.


Inside the fireproof vault housing US movie history


By AFP
April 15, 2026


The highly combustible nitrate film used from the dawn of cinema in the 1890s until the early 1950s has a permanent home in a vault run by the Library of Congress - Copyright AFP/File Ina FASSBENDER


Matthew PENNINGTON

Once upon a time in the golden days of Hollywood, the movies were bigger, the stars brighter and the celluloid they were filmed on was, well, explosive.

Which is why the US Library of Congress maintains a special, fireproof vault in Virginia, near Washington, DC.

There, the highly combustible nitrate film used from the dawn of cinema in the 1890s until the early 1950s has a permanent home, rarely accessed by the public but toured by AFP.

Lost movies on the volatile but durable medium are still being discovered and preserved in the facility. And thanks to digitization, the lost treasures can also be safely viewed for the first time in decades.

Some 145,000 film reels are stored in strictly fireproof conditions in a vast, chilly vault at the library’s National Audio-Visual Conservation Center in Culpeper, Virginia.

It is crammed with cinematic treasures that rekindle warm memories of an era when movies ruled.

The vault’s leader, George Willeman, reeled off the names of classics with negatives there: “Casablanca,” Frank Capra-directed films like “Mr. Smith Goes to Washington,” and the grand-daddy of all action movies, “The Great Train Robbery” from 1903.

Down a spartan corridor so long it seemed to recede into the distance, he unlocked a series of cell-like steel doors.

Inside each of the 124 cells — there’s one dedicated just to the Disney archive — were floor-to-ceiling cubby holes.

Each one held film canisters containing negatives and prints, all arranged meticulously: packed tight to prevent canisters from opening, but far enough apart to prevent any fire from spreading.

Since being set up in 2007 in a former US Federal Reserve building in the foothills of the Blue Ridge Mountains, the vault has maintained a perfect no-fire record.

– Film nerds’ delight –

Nitrate film is just part of the center’s collection of more than six million items of moving images and recorded sound. They also have supporting scripts, posters and photos.

Willeman, who sports a button badge with the invocation to “Experience Nitrate,” said the Library of Congress began preserving the medium when in the 1960s, “it was discovered that so much film was being lost” due to fires and defunct companies throwing negatives away.

With the American Film Institute, the library began collecting and copying nitrate film, including the holdings of big Hollywood studios – RKO, Warner Brothers, Universal, Columbia and Walt Disney.

They also tapped the personal collections of film icons like movie impresario and silent era star Mary Pickford and motion pictures inventor Thomas Edison, whose early studio produced hundreds of films.

“We’re 50 some years in, and it (the collection) just keeps growing,” Willeman said.

With the arrival of digital media, the mission has expanded beyond preservation for purists and cinema historians — who say movies just look better on nitrate footage — to putting old films online.

“Now we can make them available for everybody, which to me, being the film nerd I’ve been since, like, third grade, is just amazing.”

Nitrate film made by early artisans often preserves better than the later safety film, said Courtney Holschuh, nitrate archive technician.

At a workstation with no light bulbs or exposed batteries — either of which could ignite dust or gas from vintage film — Holschuh recounted how last September she carefully peeled apart a cache of 10 vintage reels donated by a retired schoolteacher.

There were 42 different titles on the reels — only 26 of which have been identified. They included a lost film, “Gugusse and the Automaton,” by French cinema pioneer Georges Melies.

“So much of our early film history is still out there for us to see and to experience,” Willeman said.


Developing countries skip landlines and go straight to mobile phones - OWID

MOBILE COMPUTERS


Developing countries skip landlines and go straight to mobile phones - OWID
Many emerging markets are leapfrogging over landline telecoms networks and going straight to mobile phones / bne IntelliNewsFacebook
By Hannah Ritchie for Our World in Data April 14, 2026

The concept of “leapfrogging” is popular in development. It suggests that, as they develop, lower-income countries can skip intermediate technologies or systems and go straight to the modern equivalent, Our World in Data  (OWID) reports.

One example of this is the use of landlines and mobile phones.

The landline telephone was invented in 1876 and became a dominant form of communication across Europe and North America. As you can see in the chart, it was increasingly adopted in the United States and the United Kingdom throughout the 20th century.

However, mobile phone adoption increased rapidly in the 1990s, and landlines have declined since the millennium. Mobile phones have become a substitute.

But many countries have almost skipped landline adoption entirely. Ghana and Nigeria are good examples: landline subscriptions have remained extremely low, and instead, mobile phone adoption has exploded.

Explore landline and mobile subscriptions in more countries.