Wednesday, March 30, 2022

Invasive jorō spiders get huge and flashy — if they’re female

Males are the other half of the story, so tiny and drab they’re often missed in oversized webs


Out in the open, female jorō spiders look eye-smacking obvious, but they’re sneaky hitchhikers. They can hide in wheel wells and under car hoods, tricks that might facilitate their spread.


By Susan Milius

Some thumbnail-sized, brown male spiders in Georgia could be miffed if they paid the least attention to humans and our news obsessions.

Recent stories have made much of “giant” jorō spiders invading North America from eastern Asia, some large enough to span your palm. Lemon yellow bands cross their backs. Bright red bits can add drama, and a softer cheesecake yellow highlights the many joints on long black legs.

The showy giants, however, are just the females of Trichonephila clavata. Males hardly get mentioned except for what they’re not: colorful or big. A he-spider hulk at 8 millimeters barely reaches half the length of small females. Even the species nickname ignores the guys. The word jorō, borrowed from Japanese, translates to such unmasculine terms as “courtesan,” “lady-in-waiting” and even “entangling or binding bride.”

Mismatched sexes are nothing new for spiders. The group shows the most extreme size differences between the sexes known among land animals, says evolutionary biologist Matjaž Kuntner of the Evolutionary Zoology Lab in Ljubljana, Slovenia. The most dramatic case Kuntner has heard of comes from Arachnura logio scorpion spiders in East Asia, with females 14.8 times the size of the males.

With such extreme size differences, mating conflicts in animals can get violent: females cannibalizing males and so on (SN: 11/13/99). As far as Kuntner knows, however, jorō spiders don’t engage in these “sexually conflicted” extremes. Males being merely half size or thereabouts might explain the relatively peaceful encounters.

When it comes to humans, these spiders don’t bother anybody who doesn’t bother them. But what a spectacle they make. “I’ve got dozens and dozens in my yard,” says ecologist Andy Davis at the University of Georgia in Athens. “One big web can be 3 or 4 feet in diameter.” Jorō spiders have lived in northeastern Georgia since at least 2014.

A female jorō spider looms so much bigger that it’s easy to overlook the males of the species (inset, shown to scale) that often hang out in her big web.
J. HOWELL (FEMALE) AND B.J. FREEMAN (INSET MALE), 
E.R. HOEBEKE, W. HUFFMASTER AND B.J. FREEMAN/PEERJ 2015

These new neighbors inspired Davis and undergraduate Benjamin Frick to see if the newcomers withstand chills better than an earlier invader, Trichonephila clavipes, their more tropical relative also known as the golden silk orb-weaver. (The jorō also can spin yellow-tinged silk.) The earlier arrival’s flashy females and drab males haven’t left the comfy Southeast they invaded at least 160 years ago.

Figuring out the jorō’s hardiness involves taking the spider’s pulse. But how do you do that with an arthropod with a hard exoskeleton? A spider’s heart isn’t a mammallike lump circulating blood through a closed system. The jorō sluices its bloodlike fluid through a long tube open at both ends. “Think of a garden hose,” says Davis. He has measured heart rates of monarch caterpillars, and he found a spot on a spider’s back where a keen-eyed observer can count throbs.

Female jorō spiders packed in ice to simulate chill stress kept their heart rates some 77 percent higher than the stay-put T. clavipes, tests showed. Checking jorō oxygen use showed females have about twice the metabolic rate. And about two minutes of freezing temperatures showed better female survival (74 percent versus 50 percent). Lab tests used only the conveniently big jorō females, though male ability to function in random cold snaps could matter too.

Plus jorō sightings in the Southeast so far suggest the newer arrival needs less time than its relative to make the next generation, an advantage for farther to the north. The adults don’t need to survive deep winter in any case. Mom and dad die off, in November in Georgia, and leave their hundreds of eggs packed in silk to weather the cold and storms.

Reports on the citizen-observer iNaturalist site suggest that in Georgia, jorō spiders already cover some 40,000 square kilometers, Davis and Frick report February 17 in Physiological Entomology. Sightings now stretch into Tennessee and the Carolinas. But how far the big moms and tiny dads will go and when, we’ll just have to wait and see.


CITATIONS

A.K. Davis and B.L. Frick. Physiological evaluation of newly invasive jorō spiders (Trichonephila clavata) in the southeastern USA compared to their naturalized cousin, Trichonephila clavipes. Physiological Entomology. Published online February 17, 2022. doi: 10.1111/phen.12385.I

E.R. Hoebeke et al. Nephila clavata L. Koch, the jorō spider of East Asia, newly recorded from North America (Araneae: Nephilidae). PeerJ. Published online February 5, 2015. doi: 10.7717/peerj.763

M. Kuntner and J.A. Coddington. Sexual size dimorphism: Evolution and perils of extreme phenotypes in spiders. Annual Review of Entomolog. Vol. 65, January 2020, p. 57. doi: 10.1146/annurev-ento-011019-025032.


About Susan Milius
E-mail
Twitter
Susan Milius is the life sciences writer, covering organismal biology and evolution, and has a special passion for plants, fungi and invertebrates. She studied biology and English literature.

Spiders use webs to extend their hearing

Date: March 29, 2022
Source: Binghamton University

Summary:
A newly published study of orb-weaving spiders has yielded some extraordinary results: The spiders are using their webs as extended auditory arrays to capture sounds, possibly giving spiders advanced warning of incoming prey or predators.

Everyone knows that humans and most other vertebrate species hear using eardrums that turn soundwave pressure into signals for our brains. But what about smaller animals like insects and arthropods? Can they detect sounds? And if so, how?

Distinguished Professor Ron Miles, a Department of Mechanical Engineering faculty member at Binghamton University's Thomas J. Watson College of Engineering and Applied Science, has been exploring that question for more than three decades, in a quest to revolutionize microphone technology.

A newly published study of orb-weaving spiders -- the species featured in the classic children's book "Charlotte's Web" -- has yielded some extraordinary results: The spiders are using their webs as extended auditory arrays to capture sounds, possibly giving spiders advanced warning of incoming prey or predators.

The paper, "Outsourced Hearing in an Orb-Weaving Spider that Uses its Web as an Auditory Sensor," published March 29 in the Proceedings of the National Academy of Sciences, provides the first evidence that a spider can outsource hearing to its web.

It is well-known that spiders respond when something vibrates their webs, such as potential prey. In these new experiments, researchers for the first time show that spiders turned, crouched or flattened out in response to sounds in the air.

The study is the latest collaboration between Miles and Ron Hoy, a biology professor from Cornell, and it has implications for designing extremely sensitive bio-inspired microphones for use in hearing aids and cell phones.

Jian Zhou, who earned his PhD in Miles' lab and is doing postdoctoral research at the Argonne National Laboratory, and Junpeng Lai, a current PhD student in Miles' lab, are co-first authors. Miles, Hoy and Associate Professor Carol I. Miles from the Harpur College of Arts and Sciences' Department of Biological Sciences at Binghamton are also authors for this study. Grants from the National Institutes of Health to Ron Miles funded the research.

A single strand of spider silk is so thin and sensitive that it can detect the movement of vibrating air particles that make up a soundwave, which is different from how eardrums work. Ron Miles' previous research has led to the invention of novel microphone designs that are based on hearing in insects.

"The spider is really a natural demonstration that this is a viable way to sense sound using viscous forces in the air on thin fibers," he said. "If it works in nature, maybe we should have a closer look at it."

Spiders can detect miniscule movements and vibrations through sensory organs on their tarsal claws at the tips of their legs, which they use to grasp their webs. Orb-weaver spiders are known to make large webs, creating a kind of acoustic antennae with a sound-sensitive surface area that is up to 10,000 times greater than the spider itself.

In the study, the researchers used Binghamton University's anechoic chamber, a completely soundproof room under the Innovative Technologies Complex. Collecting orb-weavers from windows around campus, they had the spiders spin a web inside a rectangular frame so they could position it where they wanted.

The team began by using pure tone sound 3 meters away at different sound levels to see if the spiders responded or not. Surprisingly, they found spiders can respond to sound levels as low as 68 decibels. For louder sound, they found even more types of behaviors.

They then placed the sound source at a 45-degree angle, to see if the spiders behaved differently. They found that not only are the spiders localizing the sound source, but they can tell the sound incoming direction with 100% accuracy.

To better understand the spider-hearing mechanism, the researchers used laser vibrometry and measured over one thousand locations on a natural spider web, with the spider sitting in the center under the sound field. The result showed that the web moves with sound almost at maximum physical efficiency across an ultra-wide frequency range.

"Of course, the real question is, if the web is moving like that, does the spider hear using it?" Miles said. "That's a hard question to answer."

Lai added: "There could even be a hidden ear within the spider body that we don't know about."

So the team placed a mini-speaker 5 centimeters away from the center of the web where the spider sits, and 2 millimeters away from the web plane -- close but not touching the web. This allows the sound to travel to the spider both through air and through the web. The researchers found that the soundwave from the mini-speaker died out significantly as it traveled through the air, but it propagated readily through the web with little attenuation. The sound level was still at around 68 decibels when it reached the spider. The behavior data showed that four out of 12 spiders responded to this web-borne signal.

Those reactions proved that the spiders could hear through the webs, and Lai was thrilled when that happened: "I've been working on this research for five years. That's a long time, and it's great to see all these efforts will become something that everybody can read."

The researchers also found that, by crouching and stretching, spiders may be changing the tension of the silk strands, thereby tuning them to pick up different frequencies. By using this external structure to hear, the spider could be able to customize it to hear different sorts of sounds.

Future experiments may investigate how spiders make use of the sound they can detect using their web. Additionally, the team would like to test whether other types of web-weaving spiders also use their silk to outsource their hearing.

"It's reasonable to guess that a similar spider on a similar web would respond in a similar way," Ron Miles said. "But we can't draw any conclusions about that, since we tested a certain kind of spider that happens to be pretty common."

Lai admitted he had no idea he would be working with spiders when he came to Binghamton as a mechanical engineering PhD student.

"I've been afraid of spiders all my life, because of their alien looks and hairy legs!" he said with a laugh. "But the more I worked with spiders, the more amazing I found them. I'm really starting to appreciate them."

Video: https://youtu.be/PIrotdSIxG4

Journal Reference:
Jian Zhou, Junpeng Lai, Gil Menda, Jay A. Stafstrom, Carol I. Miles, Ronald R. Hoy, Ronald N. Miles. Outsourced hearing in an orb-weaving spider that uses its web as an auditory sensor. Proceedings of the National Academy of Sciences, 2022; 119 (14) DOI: 10.1073/pnas.2122789119
Wally Broecker divined how the climate could suddenly shift

The shutdown of an ocean conveyor belt could cause abrupt climate change


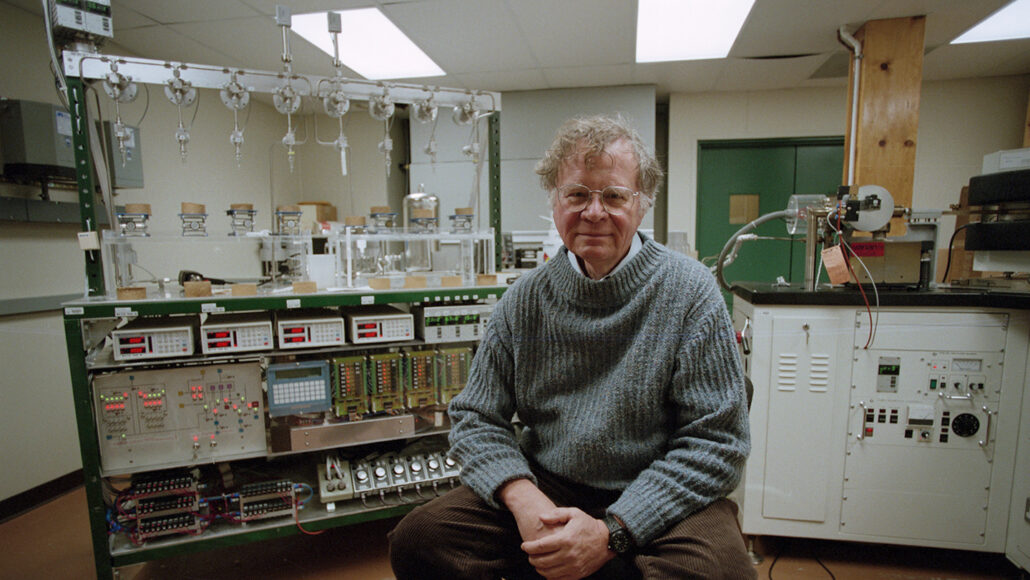
Wally Broecker, shown here in 1997, proposed that the shutdown of a major ocean circulation pattern could lead to abrupt climate change.


By Alexandra Witze

MARCH 29, 2022 

It was the mid-1980s, at a meeting in Switzerland, when Wally Broecker’s ears perked up. Scientist Hans Oeschger was describing an ice core drilled at a military radar station in southern Greenland. Layer by layer, the 2-kilometer-long core revealed what the climate there was like thousands of years ago. Climate shifts, inferred from the amounts of carbon dioxide and of a form of oxygen in the core, played out surprisingly quickly — within just a few decades. It seemed almost too fast to be true.

Broecker returned home, to Columbia University’s Lamont-Doherty Earth Observatory, and began wondering what could cause such dramatic shifts. Some of Oeschger’s data turned out to be incorrect, but the seed they planted in Broecker’s mind flowered — and ultimately changed the way scientists think about past and future climate.

A geochemist who studied the oceans, Broecker proposed that the shutdown of a major ocean circulation pattern, which he named the great ocean conveyor, could cause the North Atlantic climate to change abruptly. In the past, he argued, melting ice sheets released huge pulses of water into the North Atlantic, turning the water fresher and halting circulation patterns that rely on salty water. The result: a sudden atmospheric cooling that plunged the region, including Greenland, into a big chill. (In the 2004 movie The Day After Tomorrow, an overly dramatized oceanic shutdown coats the Statue of Liberty in ice.)

It was a leap of insight unprecedented for the time, when most researchers had yet to accept that climate could shift abruptly, much less ponder what might cause such shifts.

Broecker not only explained the changes seen in the Greenland ice core, he also went on to found a new field. He prodded, cajoled and brought together other scientists to study the entire climate system and how it could shift on a dime. “He was a really big thinker,” says Dorothy Peteet, a paleoclimatologist at NASA’s Goddard Institute for Space Studies in New York City who worked with Broecker for decades. “It was just his genuine curiosity about how the world worked.”

Broecker was born in 1931 into a fundamentalist family who believed the Earth was 6,000 years old, so he was not an obvious candidate to become a pathbreaking geoscientist. Because of his dyslexia, he relied on conversations and visual aids to soak up information. Throughout his life, he did not use computers, a linchpin of modern science, yet became an expert in radiocarbon dating. And, contrary to the siloing common in the sciences, he worked expansively to understand the oceans, the atmosphere, the land, and thus the entire Earth system.

By the 1970s, scientists knew that humans were pouring excess carbon dioxide into the atmosphere, through burning fossil fuels and cutting down carbon-storing forests, and that those changes were tinkering with Earth’s natural thermostat. Scientists knew that climate had changed in the past; geologic evidence over billions of years revealed hot or dry, cold or wet periods. But many scientists focused on long-term climate changes, paced by shifts in the way Earth rotates on its axis and circles the sun — both of which change the amount of sunlight the planet receives. A highly influential 1976 paper referred to these orbital shifts as the “pacemaker of the ice ages.”

Ice cores from Antarctica and Greenland changed the game. In 1969, Willi Dansgaard of the University of Copenhagen and colleagues reported results from a Greenland ice core covering the last 100,000 years. They found large, rapid fluctuations in oxygen-18 that suggested wild temperature swings. Climate could oscillate quickly, it seemed — but it took another Greenland ice core and more than a decade before Broecker had the idea that the shutdown of the great ocean conveyor system could be to blame.
Pulled from southern Greenland beginning in 1979, the Dye-3 ice core (the drill used to retrieve the core is shown) revealed that abrupt climate change had occurred in the past.
THE NIELS BOHR INSTITUTE

Broecker proposed that such a shutdown was responsible for a known cold snap that started around 12,900 years ago. As the Earth began to emerge from its orbitally influenced ice age, water melted off the northern ice sheets and washed into the North Atlantic. Ocean circulation halted, plunging Europe into a sudden chill, he said. The period, which lasted just over a millennium, is known as the Younger Dryas after an Arctic flower that thrived during the cold snap. It was the last hurrah of the last ice age.

Evidence that an ocean conveyor shutdown could cause dramatic climate shifts soon piled up in Broecker’s favor. For instance, Peteet found evidence of rapid Younger Dryas cooling in bogs near New York City — thus establishing that the cooling was not just a European phenomenon but also extended to the other side of the Atlantic. Changes were real, widespread and fast.

By the late 1980s and early ’90s, there was enough evidence supporting abrupt climate change that two major projects — one European, one American — began to drill a pair of fresh cores into the Greenland ice sheet. Richard Alley, a geoscientist at Penn State, remembers working through the layers and documenting small climatic changes over thousands of years. “Then we hit the end of the Younger Dryas and it was like falling off a cliff,” he says. It was “a huge change after many small changes,” he says.

 “Breathtaking.”

The new Greenland cores cemented scientific recognition of abrupt climate change. Though the shutdown of the ocean conveyor could not explain all abrupt climate changes that had ever occurred, it showed how a single physical mechanism could trigger major planet-wide disruptions. It also opened discussions about how rapidly climate might change in the future.

Broecker, who died in 2019, spent his last decades exploring abrupt shifts that are already happening. He worked, for example, with billionaire Gary Comer, who during a yacht trip in 2001 was shocked by the shrinking of Arctic sea ice, to brainstorm new directions for climate research and climate solutions.

Broecker knew more than almost anyone about what might be coming. He often described Earth’s climate system as an angry beast that humans are poking with sticks. And one of his most famous papers was titled “Climatic change: Are we on the brink of a pronounced global warming?”

It was published in 1975.


About Alexandra Witze
Twitter
Alexandra Witze is a contributing correspondent for Science News. Based in Boulder, Colo., Witze specializes in earth, planetary and astronomical sciences.
Marie Maynard Daly was a trailblazing biochemist, but her full story may be lost

Though her research contributions are clear, her own perspective on her work is missing


Marie Maynard Daly found experimental evidence that protein synthesis requires RNA.
ARCHIVES OF THE ALBERT EINSTEIN COLLEGE OF MEDICINE, TED BURROWS, PHOTOGRAPHER

By Megan Scudellari
MARCH 2, 2022 AT 9:00 AM

Marie Maynard Daly is known as the first African American woman to receive a Ph.D. in chemistry, earned in 1947 from Columbia University. It’s a superlative often repeated in the brief profiles of Daly that appear in anthologies of notable Black and female scientists — and an impressive achievement on its own.

But when I set out to discover more about Daly’s work and life, to bring her story to a wider audience, I found out I was two decades too late.

Daly published from 1949 to 1985, retired in 1986 and died in 2003 at the age of 82. Her husband predeceased her; she had no children. Most of Daly’s collaborators and colleagues have died in the last decade; her mentees are retired and unreachable; her former employers and professional organizations have minimal or no documents chronicling her life or research.

What we know about Daly comes primarily from her record of scientific publications. While working with biochemists Alfred Mirsky and Vincent Allfrey at Rockefeller Institute in New York City in the early 1950s, Daly found direct experimental evidence that protein synthesis requires RNA. James Watson cited that work in the lecture he gave after receiving the Nobel Prize for the discovery of the double-helix structure of DNA. Daly also identified a new type of histones and determined the distribution of different nitrogenous bases within nucleic acids (what we now call DNA and RNA). With Quentin Deming at Columbia University, she identified cholesterol as an underlying cause of heart attacks.

After she moved to Albert Einstein College of Medicine in New York City, Daly extensively studied hypertension and later analyzed how muscle cells use creatine to produce energy. She participated in a study that identified lesions in the lungs of a dog model of chronic cigarette smoking.

Daly’s studies were rigorous, her results important and her topics varied.

Various anthologies from the 1990s and online articles from the 2000s include some details about her personal life, but they largely reiterate the same handful of facts: Daly was born in Queens, N.Y., in 1921; she read microbiologist Paul de Kruif’s classic 1926 book Microbe Hunters as a child; she sought a doctorate in chemistry because she didn’t think she’d have luck getting a job during World War II. In addition to her research and teaching, Daly organized training programs to prepare minority undergraduates for medical school and graduate science programs.

In a letter from 1970, Abraham White of Albert Einstein College of Medicine, where Daly remained until her retirement in 1986, recommends Daly for promotion, citing her “high qualities of leadership,” valuable scientific contributions and administration of the Martin Luther King, Jr.–Robert F. Kennedy Program for Special Studies to recruit and prepare minority students for medical school. It’s one of only two primary documents the college had.

I couldn’t find anyone to speak about Daly — nor could I find any existing interviews. Sibrina Collins, a chemist, writer and executive director of the Marburger STEM Center at Lawrence Technological University in Southfield, Mich., encountered similar frustrations when she wrote about Daly in 2017. Collins found few existing details on Daly’s life aside from the oft-repeated headline about her Ph.D. in chemistry. “It’s wonderful to say that somebody is the first to do something — that’s a nice historical fact — but it’s really important to highlight what they actually did, not just that they were the first,” Collins says.

It’s wonderful to say that somebody is the first to do something … but it’s really important to highlight what they actually did, not just that they were the first.
Sibrina Collins

A profile by Janet P. Stamatel, originally written in 2002 for a book series called Contemporary Black Biography, includes actual quotes from Daly. Stamatel, now a sociologist at the University of Kentucky in Lexington, says she believes she interviewed Daly for that story, but any notes or recording from the interview are long lost.

And so Daly’s voice might also be lost. While we can read her papers and recite a few basic facts, there’s a whole wealth of her life missing. We know nothing of her motivations, convictions, failures and hopes for the future. We can imagine the great challenges she confronted as a woman and a Black scientist in the mid-1900s, but we don’t know how she approached and overcame them. Nor do we know the specifics that drove her to ask certain scientific questions. For instance, why did Daly work on a single study about smoking and lung cancer, a topic seemingly far-flung from her other work? Was she inspired by a loved one with cancer?

The whole research effort left me thinking about the stories society tells about science — whose stories are told, how and by whom. We need to prioritize documenting the stories of scientists, especially of scientists from historically marginalized groups, when and where they do their work. The media, historians, libraries, non-profit organizations, scientists, society as a whole — we can all do better to present opportunities for underrepresented scientists to share their voices and perspectives. Otherwise, we risk losing them altogether.

David Caruso, director of the Center for Oral History at the Science History Institute in Philadelphia, and colleagues have been working to collect those stories, and it takes a concerted effort, he says. Of 722 interviews within the center’s collections, for example, 96 participants identify as female and 20 identify as African American, Caruso says. Following a multiyear effort to correct the bias in its collections, the organization now makes sure its current efforts are representative of diversity in the scientific and engineering communities, he adds. “Our collection still needs work, but it is improved significantly from what it once was.”

I still think about Daly from time to time, and the questions I would have asked given the chance to interview her. She was a real, feeling scientist driven by passions and shaped by a particular time and place. Her achievement in chemistry is inspiring, but her deeper story is lost to students and scientists who might have learned from her experiences.

INTERSECTIONALITY
How climbers help scientists vibe with Utah’s famous red rock formations

The work provides new insights on the geologic structures’ seismic stability


Castleton Tower (right), a soaring sandstone formation near Moab, Utah, is among the most popular climbing destinations in the world. Researchers have enlisted rock climbers to help them assess the natural vibrations of Castleton and other similar geologic structures.
46053374@N05/FLICKR.COM (CC BY-2.0)


By Rachel Crowell
MARCH 21, 2022 

As Kathryn Vollinger prepared to climb Castleton Tower, a 120-meter-tall sandstone formation in the desert near Moab, Utah, the outdoor guide assessed her gear. Ropes? Check. Helmet and harnesses? Check. Climbing rack? Check. That day in March 2018, Vollinger’s checklist also included an unusual piece of equipment: a seismometer. The excursion wasn’t solely for pleasure; it was also for science.

Castleton Tower and its peers may appear still. But these soaring geologic structures are in constant motion, vibrating in response to earthquakes, human activity and even distant ocean waves. The same goes for fins, rock formations that are irregularly shaped instead of cylindrical or rectangular like towers, says geophysicist Riley Finnegan of the University of Utah in Salt Lake City.

The seismometers measure how much the towers and fins naturally vibrate. Those data are key to assessing the formations’ stability and could even help researchers search the rocks for possible signs of seismic activity in the distant past (SN: 3/15/06).

Such insights are important not just to scientists, but also to Native Americans, including the Eastern Shoshone, Hopi, Navajo, Southern Paiute, Ute and Zuni peoples. Many of the landforms, which are located on the traditional lands of these groups, hold cultural and religious significance, Finnegan says.

Finnegan’s team has been working with Vollinger for nearly five years to assemble the first dataset on the dynamic physical properties of 14 towers and fins, which the researchers published February 16 in Seismological Research Letters. Without experienced climbers like Vollinger on board, the project wouldn’t have been possible, Finnegan says.

Collecting the data was a tremendous challenge. Safely scaling the trickiest formations requires climbing chops, strength, endurance and a sizeable dose of planning. “There’s only so much risk I’m willing to take for getting those seismometers up,” Vollinger says. “When you’re hauling extra gear, that adds another element to it.”

Vollinger and her climbing partner, husband Nathan Richman, had to ensure that the rock faces were vertical enough to avoid dragging the equipment. Dragging would “likely knock loose rock off,” she says. Once Vollinger reached the top of a formation — after anywhere from one to six hours of climbing — she read books or chatted with her husband while a seismometer collected data. They then hauled the instrument and their other gear back down.

Back at the University of Utah, Finnegan and colleagues analyzed the data, finding that the structures’ lowest natural frequencies — called fundamental frequencies — range from 0.8 to 15 hertz. In other words, the towers sway roughly one to 15 times per second.

The team also used computer models to study the ways in which the formations bend and twist at a given frequency. Those simulations helped provide a more complete picture of how physics influences the behavior of towers and fins, Finnegan says.
Outdoor guide Kathryn Vollinger carries equipment through rough terrain on the way to climb one of Utah’s many red rock tower formations. Vollinger has been helping geophysicists study the geologic structures for nearly five years.
N. RICHMAN

What’s more, inputting the height, density, cross-sectional area and other material properties of the formations into the model predicted the formations’ fundamental frequencies.

The findings “strengthen our understanding of the dependence on height and width for the [fundamental frequencies] of these features,” says Ramon Arrowsmith, a geologist at Arizona State University in Tempe who wasn’t involved with the work. Finnegan and her colleagues have proven that “the geometry is sufficient to really talk about the dominant frequencies for the behavior of the pillars.”

Eventually, such a model could eliminate the need for climbers to deploy seismometers to measure frequency. And should future scientists require seismic measurements, Arrowsmith envisions robots putting seismometers in place and drones flying by to collect data later. But for now, Vollinger will continue scaling these formations for science.

sciencenews.org

CITATIONS

R. Finnegan et al. Ambient vibration modal analysis of natural rock towers and fins. Seismological Research Letters. Published online February 16, 2022. doi: 10.1785/0220210325.

Tiny Star Unleashes Monstrous Beam of Matter and Anti-Matter

Pulsar PSR J2030+4415 X-Ray and Optical

J2030 X-Ray and Optical. Credit: X-ray: NASA/CXC/Stanford Univ./M. de Vries; Optical: NSF/AURA/Gemini Consortium

  • A city-sized collapsed star has generated a beam of matter and antimatter that stretches for trillions of miles.
  • Data from NASA’s Chandra X-ray Observatory revealed the full extent of this beam, or filament.
  • This discovery could help explain the presence of positrons detected throughout the Milky Way galaxy and here on Earth.
  • Positrons are the antimatter counterpart to the electron.

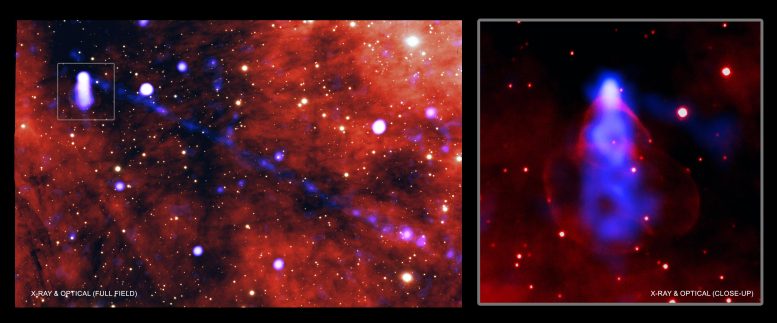
This image from NASA’s Chandra X-ray Observatory and ground-based optical telescopes shows an extremely long beam, or filament, of matter and antimatter extending from a relatively tiny pulsar. With its tremendous scale, this beam may help explain the surprisingly large numbers of positrons, the antimatter counterparts to electrons, scientists have detected throughout the Milky Way galaxy.

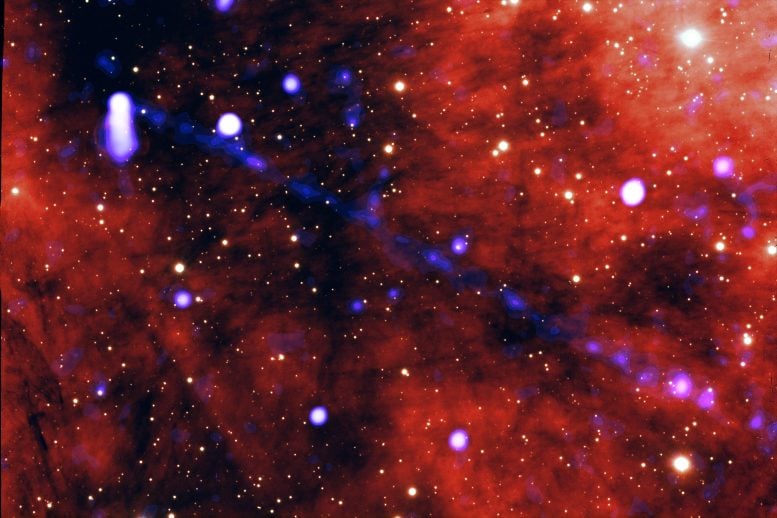
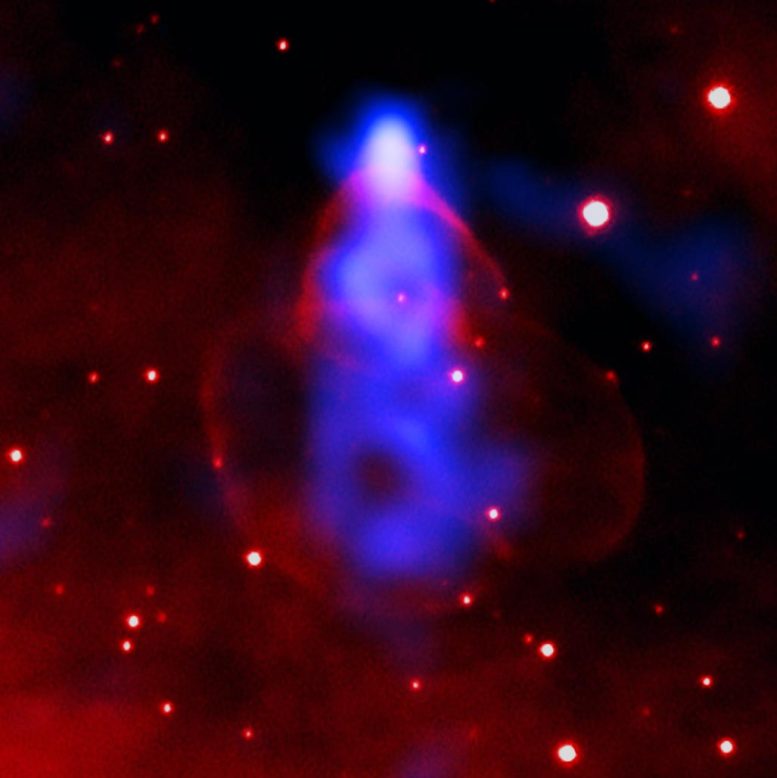
In the image at the top of the page, the panel on the left displays about one third the length of the beam from the pulsar known as PSR J2030+4415 (J2030 for short), which is located about 1,600 light years from Earth. J2030 is a dense, city-sized object that formed from the collapse of a massive star and currently spins about three times per second. X-rays from Chandra (blue) show where particles flowing from the pulsar along magnetic field lines are moving at about a third the speed of light. A close-up view of the pulsar in the right panel shows the X-rays created by particles flying around the pulsar itself. As the pulsar moves through space at about a million miles an hour, some of these particles escape and create the long filament. In both panels, optical light data from the Gemini telescope on Mauna Kea in Hawaii have been used and appear red, brown, and black. The full length of the filament is shown in a separate image (below).

Pulsar PSR J2030+4415 X-Ray and Optical Wide Field

J2030 X-Ray and Optical wide fieldCredit: NASA/CXC/Stanford Univ./M. de Vries

The vast majority of the Universe consists of ordinary matter rather than antimatter. Scientists, however, continue to find evidence for relatively large numbers of positrons in detectors on Earth, which leads to the question: what are possible sources of this antimatter? The researchers in the new Chandra study of J2030 think that pulsars like it may be one answer. The combination of two extremes — fast rotation and high magnetic fields of pulsars — lead to particle acceleration and high energy radiation that creates electron and positron pairs. (The usual process of converting mass into energy famously determined by Einstein’s E = mc2 equation is reversed, and energy is converted into mass.)

Pulsar PSR J2030+4415 X-Ray Full Field

J2030 X-Ray full field. Credit: NASA/CXC/Stanford Univ./M. de Vries

Pulsars generate winds of charged particles that are usually confined within their powerful magnetic fields. The pulsar is traveling through interstellar space at about half a million miles per hour, with the wind trailing behind it. A bow shock of gas moves along in front of the pulsar, similar to the pile-up of water in front of a moving boat. However, about 20 to 30 years ago the bow shock’s motion appears to have stalled and the pulsar caught up to it.

Pulsar PSR J2030+4415 X-Ray and Optical Close Up

J2030 X-Ray and Optical close-up. Credit: X-ray: NASA/CXC/Stanford Univ./M. de Vries; Optical: NSF/AURA/Gemini Consortium

The ensuing collision likely triggered a particle leak, where the pulsar wind’s magnetic field linked up with the interstellar magnetic field. As a result, the high-energy electrons and positrons could have squirted out through a “nozzle” formed by connection into the Galaxy.

Previously, astronomers have observed large halos around nearby pulsars in gamma-ray light that imply energetic positrons generally have difficulty leaking out into the Galaxy. This undercut the idea that pulsars explain the positron excess that scientists detect. However, pulsar filaments that have recently been discovered, like J2030, show that particles actually can escape into interstellar space, and eventually could reach Earth.

For more on this discovery, see Tiny Star Unleashes Gargantuan Beam of Matter and Anti-Matter That Stretches for 40 Trillion Miles.

Reference: “The Long Filament of PSR J2030+4415” by Martijn de Vries and Roger W. Romani, Accepted, The Astrophysical Journal.
arXiv:2202.03506

A paper describing these results, authored by Martjin de Vries and Roger Romani of Stanford University, will appear in The Astrophysical Journal. NASA’s Marshall Space Flight Center manages the Chandra program. The Smithsonian Astrophysical Observatory’s Chandra X-ray Center controls science operations from Cambridge, Massachusetts, and flight operations from Burlington, Massachusetts.

Solar Orbiter Spacecraft Captures the Full Sun in Unprecedented Detail

Solar Orbiter Close Approach Sun

Animation of ESA’s Sun-explorer Solar Orbiter. Credit: ESA/Medialab

Solar Orbiter’s latest images shows the full Sun in unprecedented detail. They were taken on March 7, 2022, when the spacecraft was crossing directly between the Earth and Sun.

One of the images, taken by the Extreme Ultraviolet Imager (EUI) is the highest resolution image of the Sun’s full disc and outer atmosphere, the corona, ever taken.

Another image, taken by the Spectral Imaging of the Coronal Environment (SPICE) instrument represents the first full Sun image of its kind in 50 years, and by far the best one, taken at the Lyman-beta wavelength of ultraviolet light that is emitted by hydrogen gas.

The images were taken when Solar Orbiter was at a distance of roughly 75 million kilometers, half way between our world and its parent star. The high-resolution telescope of EUI takes pictures of such high spatial resolution that, at that close distance, a mosaic of 25 individual images is needed to cover the entire Sun. Taken one after the other, the full image was captured over a period of more than four hours because each tile takes about 10 minutes, including the time for the spacecraft to point from one segment to the next.

Solar Orbiter Captures Sun in Extreme Ultraviolet Light

The Sun as seen by Solar Orbiter in extreme ultraviolet light from a distance of roughly 75 million kilometers. The image is a mosaic of 25 individual images taken on March 7, 2022, by the high resolution telescope of the Extreme Ultraviolet Imager (EUI) instrument. Taken at a wavelength of 17 nanometers, in the extreme ultraviolet region of the electromagnetic spectrum, this image reveals the Sun’s upper atmosphere, the corona, which has a temperature of around a million degrees Celsius. An image of Earth is also included for scale, at the 2 o’clock position. Credit: ESA & NASA/Solar Orbiter/EUI team; Data processing: E. Kraaikamp (ROB)

In total, the final image contains more than 83 million pixels in a 9148 x 9112 pixel grid. For comparison, this image has a resolution that is ten times better than what a 4K TV screen can display.

EUI images the Sun at a wavelength of 17 nanometers, in the extreme ultraviolet region of the electromagnetic spectrum. This reveals the Sun’s upper atmosphere, the corona, which has a temperature of around a million degrees Celsius.

Taking the Sun’s Temperature

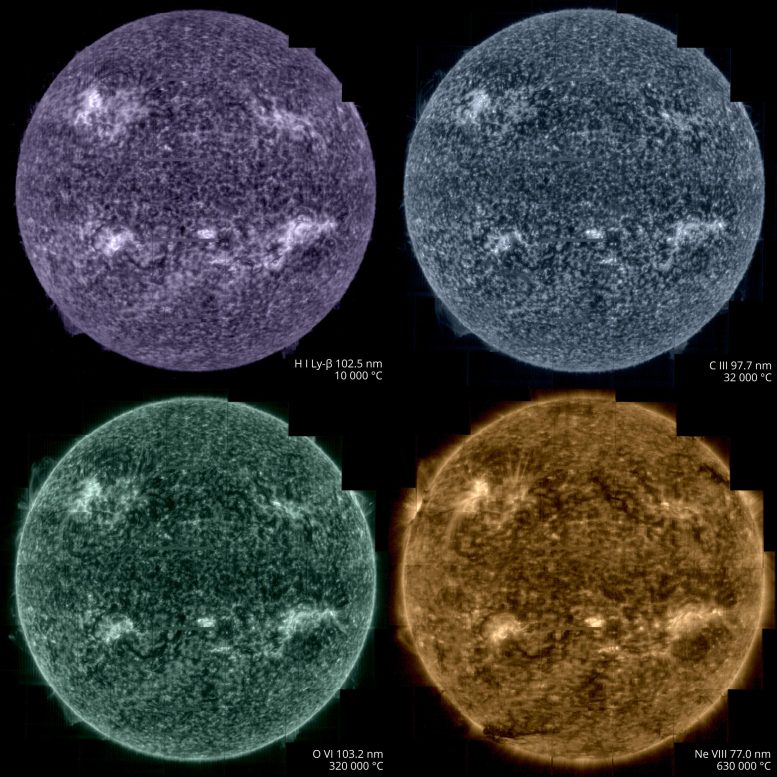
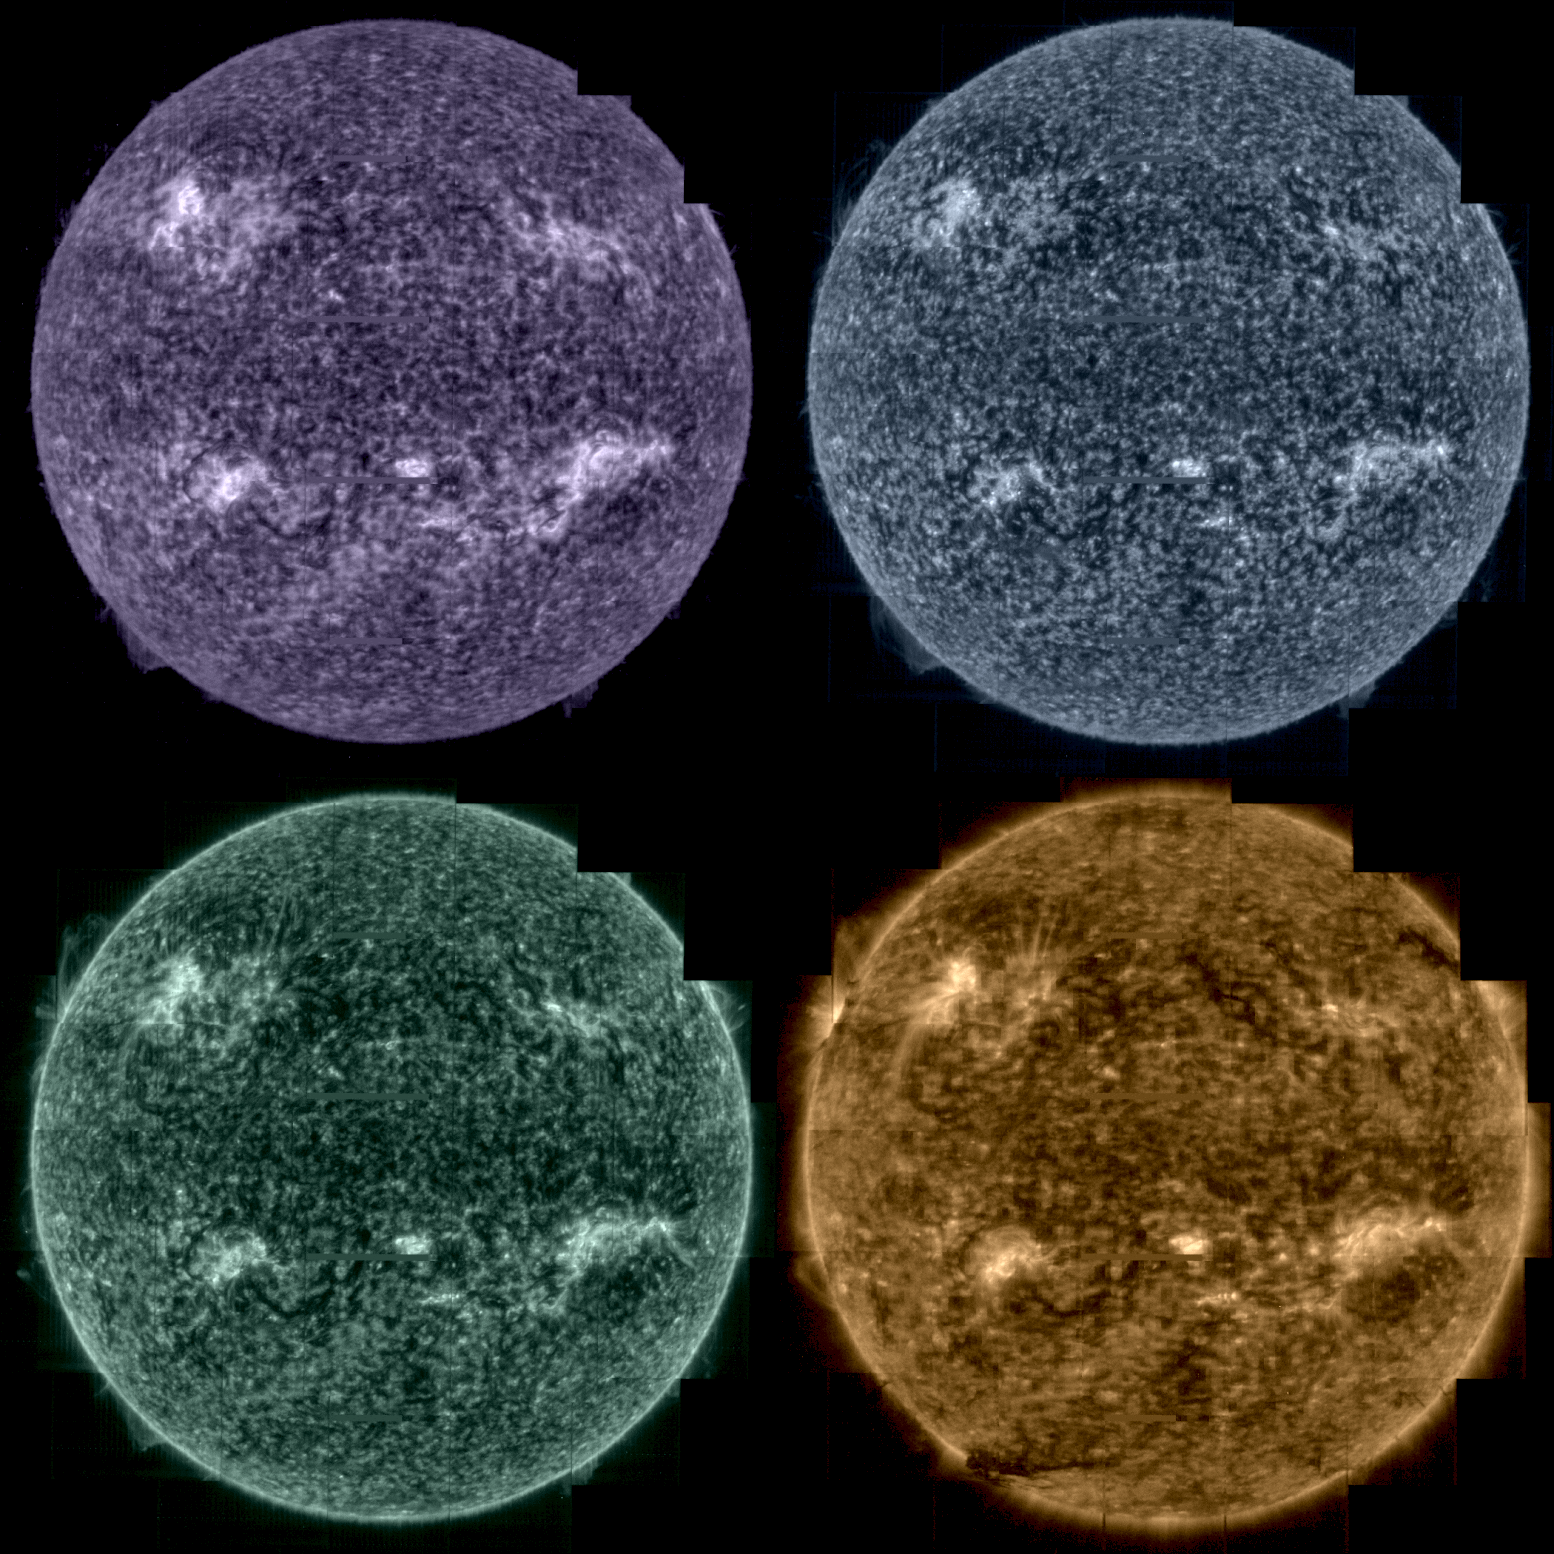
Solar Orbiter took images of the Sun on March 7, from a distance of roughly 75 million kilometres, using its Spectral Imaging of the Coronal Environment (SPICE) instrument. SPICE takes simultaneous “spectral images” at several different wavelengths of the extreme ultraviolet spectrum by scanning its spectrometer slit across a region on the Sun. The different wavelengths recorded correspond to different layers in the Sun’s lower atmosphere. Purple corresponds to hydrogen gas at a temperature of 10,000°C, blue to carbon at 32,000°C, green to oxygen at 320,000°C, yellow to neon at 630,000°C. Each full-Sun image is made up of a mosaic of 25 individual scans. It represents the best full Sun image taken at the Lyman beta wavelength of ultraviolet light that is emitted by hydrogen gas. Credit: ESA & NASA/Solar Orbiter/SPICE team; Data processing: G. Pelouze (IAS)

At the 2 o’clock (near the image of the Earth for scale) and 8 o’clock positions on the edges of the Sun, dark filaments can be seen projecting away from the surface. These ‘prominences’ are prone to erupt, throwing huge quantities of coronal gas into space and creating ‘space weather’ storms.

In addition to EUI, the SPICE instrument was also recording data during the crossing. These too needed to be pieced together as a mosaic.

SPICE is designed to trace the layers in the Sun’s atmosphere from the corona, down to a layer known as the chromosphere, getting closer to the surface. The instrument does this by looking at the different wavelengths of extreme ultraviolet light that come from different atoms.

Taking the Sun’s Temperature

Taking the Sun’s temperature. Credit: ESA & NASA/Solar Orbiter/SPICE team; Data processing: G. Pelouze (IAS)

In the SPICE sequence of images purple corresponds to hydrogen gas at a temperature of 10,000°C, blue to carbon at 32,000°C, green to oxygen at 320,000°C, yellow to neon at 630,000°C.

This will allow solar physicists to trace the extraordinarily powerful eruptions that take place in the corona down through the lower atmospheric layers. It will also allow them to study one of the most puzzling observations about the Sun: how the temperature is rising through the ascending atmospheric layers.

Usually the temperature drops as you move away from a hot object. But above the Sun, the corona reaches a million degrees Celsius whereas the surface is only about 5000°C. Investigating this mystery is one of the key scientific objectives of Solar Orbiter.

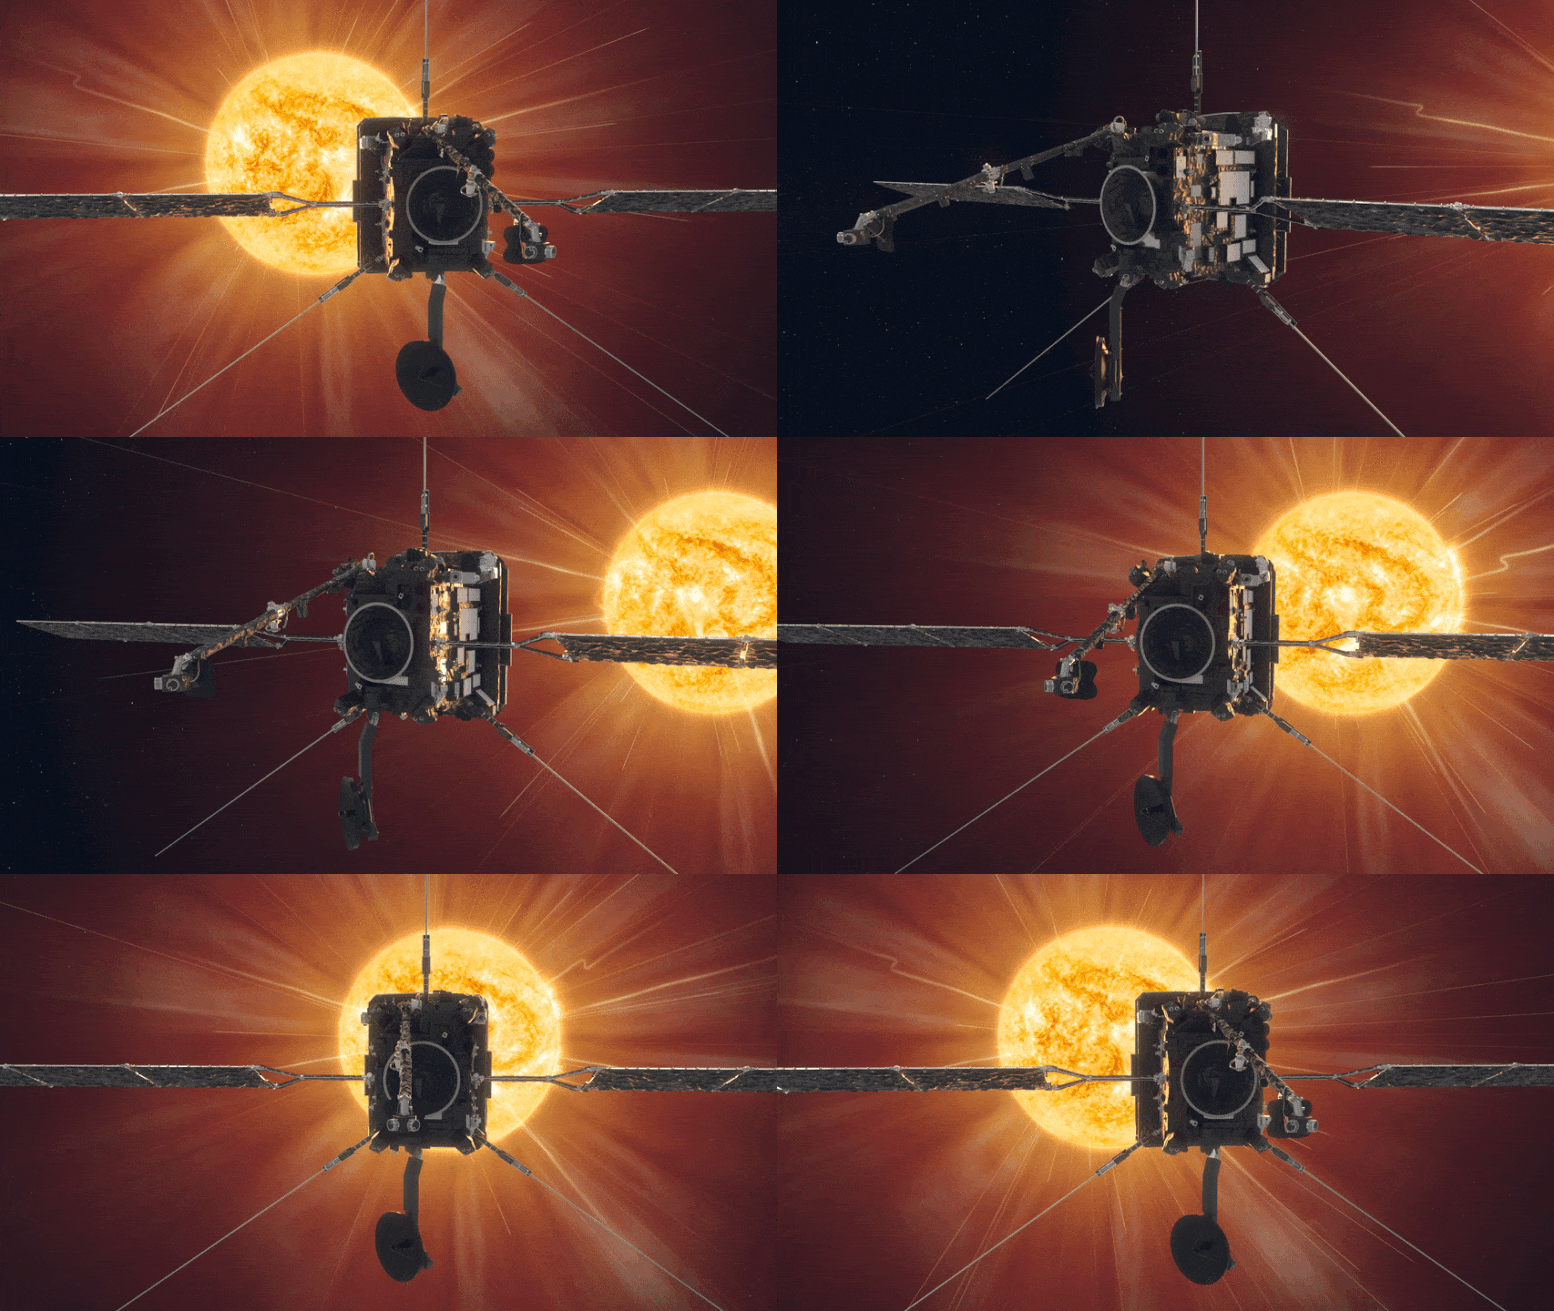
ESA Solar Orbiter Facing Sun

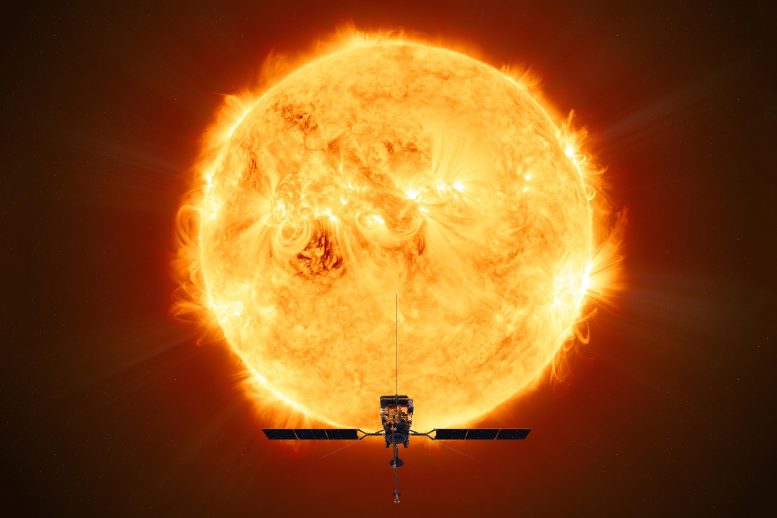
ESA’s Solar Orbiter. Credit: ESA/ATG medialab

The images were taken on 7 March, precisely when Solar Orbiter crossed the Sun-Earth line, so the images can be compared with Earth-bound solar instruments and cross-calibrated. This will make it easier to compare results from different instruments and observatories in future.

On March 26, Solar Orbiter reaches another mission milestone: its first close perihelion. The spacecraft is now inside the orbit of Mercury, the inner planet, taking the highest resolution images of the Sun it can take. It is also recording data on the solar wind of particles that flows outwards from the Sun.

And this is just the start, over the coming years the spacecraft will repeatedly fly this close to the Sun. It will also gradually raise its orientation to view the Sun’s previously unobserved polar regions.

Solar Orbiter is a space mission of international collaboration between ESA and NASA.


Solar Orbiter: Tracking Sunspots Up Close

Tracking Sunspots Up Close Infographic

The ESA/NASA Solar Orbiter spacecraft just made its historic first close pass of the Sun, which happened midday on March 26, 2022.

In the days leading up to and around ‘Perihelion passage’, teams at ESA worked intensively on an observation campaign, and all ten instruments will be operating simultaneously to gather as much data as possible.

This effort will include using its remote sensing instruments, like the Extreme Ultraviolet Imager to image the Sun, as well as in-situ instruments to measure the solar wind as it flows past the spacecraft.

Observing specific targets of scientific interest on the Sun requires close coordination between flight control teams and the flight dynamics experts at ESA’s ESOC mission control centre, in Germany, and teams at the science operations center at ESAC, in Spain.

ESA teams are using the full-disc telescopes on board Solar Orbiter to identify dynamic activity – like moving sunspots – on the surface, then will use these specific locations to calculate accurate pointing of the narrow-angle imager for later detailed observation.

Since the instruments are fixed in place to the spacecraft body, the entire spacecraft must be pointed with high precision to point to specific sunspots.

This cycle of using wide-angle images to select specific narrow-angle targets, then feeding the needed pointing back into flight control instructions takes place daily, with each iteration taking three days from initial imaging to uplink of new pointing instructions.

While such close coordination happens throughout the mission, the cycle is much speeded up during perihelion passage to ensure the best possible scientific value from ‘up close’ to the Sun.

Nearby Star Could Help Explain Sunspot Mystery That Has Baffled Scientists for 300 Years

11 Year Sunspot Cycle

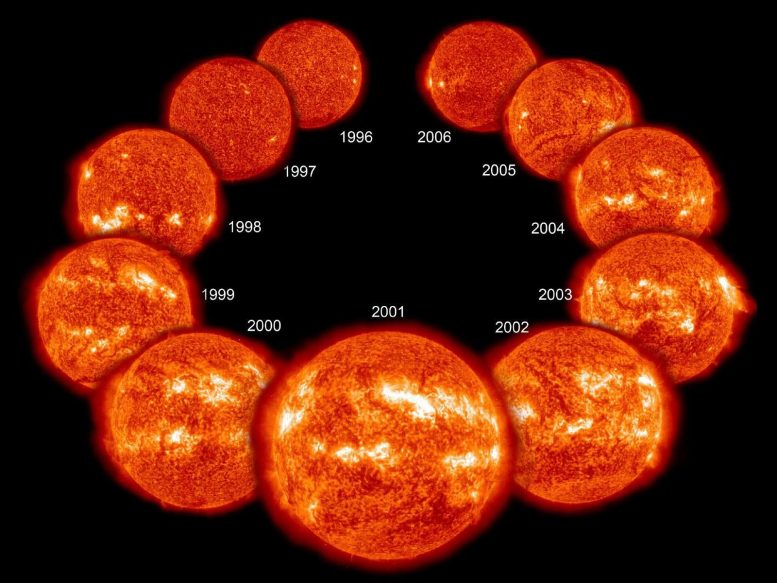
A new study has identified a nearby star whose sunspot cycles appear to have stopped. Studying this star might help explain the period from the mid 1600s to the early 1700s when our sun paused its sunspot cycles. This image depicts a typical 11-year cycle on the sun, with the fewest sunspots appearing at its minimum (top left and top right) and the most appearing at its maximum (center). Credit: NASA

The number of sunspots on our sun typically ebbs and flows in a predictable 11-year cycle, but one unusual 70-year period when sunspots were incredibly rare has mystified scientists for 300 years. Now a nearby sun-like star seems to have paused its own cycles and entered a similar period of rare starspots, according to a team of researchers at Penn State. Continuing to observe this star could help explain what happened to our own sun during this “Maunder Minimum” as well as lend insight into the sun’s stellar magnetic activity, which can interfere with satellites and global communications and possibly even affect climate on Earth.

The star — and a catalog of 5 decades of starspot activity of 58 other sun-like stars — is described in a new paper that appears online in the Astronomical Journal.

Starspots appear as a dark spot on a star’s surface due to temporary lower temperatures in the area resulting from the star’s dynamo — the process that creates its magnetic field. Astronomers have been documenting changes in starspot frequency on our sun since they were first observed by Galileo and other astronomers in the 1600s, so there is a good record of its 11-year cycle. The exception is the Maunder Minimum, which lasted from the mid-1600s to early 1700s and has perplexed astronomers ever since.

“We don’t really know what caused the Maunder Minimum, and we have been looking to other sun-like stars to see if they can offer some insight,” said Anna Baum, an undergraduate at Penn State at the time of the research and first author of the paper. “We have identified a star that we believe has entered a state similar to the Maunder Minimum. It will be really exciting to continue to observe this star during, and hopefully as it comes out of, this minimum, which could be extremely informative about the sun’s activity 300 years ago.”

The research team pulled data from multiple sources to stitch together 50 to 60 years of starspot data for 59 stars. This included data from the Mount Wilson Observatory HK Project — which was designed to study stellar surface activity and ran from 1966 to 1996 — and from planet searches at Keck Observatory which include this kind of data as part of their ongoing search for exoplanets from 1996 to 2020. The researchers compiled a database of stars that appeared in both sources and that had other readily available information that might help explain starspot activity. The team also made considerable efforts to standardize measurements from the different telescopes to be able to compare them directly and otherwise clean up the data.

The team identified or confirmed that 29 of these stars have starspot cycles by observing at least two full periods of cycles, which often last more than a decade. Some stars did not appear to have cycles at all, which could be because they are rotating too slowly to have a dynamo and are magnetically “dead” or because they are near the end of their lives. Several of the stars require further study to confirm whether they have a cycle.

“This continuous, more than 50-year time series allows us to see things that we never would have noticed from the 10-year snapshots that we were doing before,” said Jason Wright, professor of astronomy and astrophysics at Penn State and an author of the paper. “Excitingly, Anna has found a promising star that was cycling for decades but appears to have stopped.”

According to the researchers, the star — called HD 166620 — was estimated to have a cycle of about 17 years but has now entered a period of low activity and has shown no signs of starspots since 2003.

Christoph Scheiner Illustration

Sunspots were first observed in the 1600s by using a modified telescope called a helioscope. The instrument projects an image of the sun onto a surface, where dark sunspots can be observed. This illustration was produced by Christoph Scheiner in the 1600s for his book “Rosa Ursina sive Sol.” Credit: Christoph Scheiner

“When we first saw this data, we thought it must have been a mistake, that we pulled together data from two different stars or there was a typo in the catalog or the star was misidentified,” said Jacob Luhn, a graduate student at Penn State when the project began who is now at the University of California, Irvine. “But we double- and triple-checked everything. The times of observation were consistent with the coordinates we expected the star to have. And there aren’t that many bright stars in the sky that Mount Wilson observed. No matter how many times we checked, we always come to the conclusion that this star has simply stopped cycling.”

The researchers hope to continue studying this star throughout its minimum period and potentially as it comes out of its minimum and begins to cycle once again. This continued observation could provide important information about how the sun and stars like it generate their magnetic dynamos.

“There’s a big debate about what the Maunder Minimum was,” said Baum, who is now a doctoral student at Lehigh University studying stellar astronomy and asteroseismology. “Did the sun’s magnetic field basically turn off? Did it lose its dynamo? Or was it still cycling but at a very low level that didn’t produce many sunspots? We can’t go back in time to take measurements of what it was like, but if we can characterize the magnetic structure and magnetic field strength of this star, we might start to get some answers.”

A better understanding of the surface activity and magnetic field of the sun could have several important implications. For example, strong stellar activity can disable satellites and global communications, and one particularly strong solar storm disabled a power grid in Quebec in 1989. It has also been suggested that sunspot cycles may have a connection to climate on Earth. Additionally, the researchers said that information from this star could impact our search for planets beyond our solar system.

“Starspots and other forms of surface magnetic activity of stars interfere with our ability to detect the planets around them,” said Howard Isaacson, a research scientist at the University of California, Berkeley, and an author of the paper. “Improving our understanding of a star’s magnetic activity might help us improve our detection efforts.”

The curated database of the 59 stars and their starspot activity from this research has been made available for researchers to further investigate.

“This research is a great example of cross-generational astronomy, and how we continue to improve our understanding of the universe by building upon the many observations and dedicated research of astronomers that came before us,” said Wright. “I looked at starspot data from Mount Wilson and Keck Observatory for my thesis when I was a graduate student, Howard looked at starspot data from the California Planet Survey for his master’s thesis, and now Anna has stitched together all the data for a more comprehensive look across the years. We are all excited to continue studying this and other promising stars.”

Reference: “Five Decades of Chromospheric Activity in 59 Sun-like Stars and New Maunder Minimum Candidate HD 166620” by Anna C. Baum, Jason T. Wright, Jacob K. Luhn and Howard Isaacson, 22 March 2022, Astronomical Journal.
DOI: 10.3847/1538-3881/ac5683

Researchers discover a mysterious, new type of wave in the Sun whose speed defies explanation


Date: March 25, 2022
Source: New York University

Researchers from NYU Abu Dhabi's (NYUAD) Center for Space Science have discovered a new set of waves in the Sun that, unexpectedly, appear to travel much faster than predicted by theory.

In the study, "Discovery of high-frequency-retrograde vorticity waves in the Sun," published in the journal Nature Astronomy, the researchers -- led by Research Associate Chris S. Hanson -- detailed how they analyzed 25 years of space and ground-based data to detect these waves. The high-frequency retrograde (HFR) waves -- which move in the opposite direction of the Sun's rotation -- appear as a pattern of vortices (swirling motions) on the surface of the Sun and move at three times the speed established by current theory.

The interior of the Sun and stars cannot be imaged by conventional astronomy (e.g. optical, x-ray etc.), and scientists rely on interpreting the surface signatures of a variety of waves to image the interiors. These new HFR waves may yet be an important puzzle piece in our understanding of stars.

Complex interactions between other well known waves and magnetism, gravity or convection could drive the HFR waves at this speed. "If the HFR waves could be attributed to any of these three processes, then the finding would have answered some open questions we still have about the Sun," said Hanson. "However, these new waves don't appear to be a result of these processes, and that's exciting because it leads to a whole new set of questions."

This research was conducted within NYUAD's Center for Space Science in collaboration with the Tata Institute of Fundamental Research (TIFR) and New York University, using NYUAD and TIFR's computational resources. By studying the Sun's interior dynamics -- through the use of waves -- scientists can better appreciate the Sun's potential impact on the Earth and other planets in our solar system.

"The very existence of HFR modes and their origin is a true mystery and may allude to exciting physics at play," said Shravan Hanasoge, a co-author of the paper. "It has the potential to shed insight on the otherwise unobservable interior of the Sun."

Journal Reference:
Chris S. Hanson, Shravan Hanasoge, Katepalli R. Sreenivasan. Discovery of high-frequency retrograde vorticity waves in the Sun. Nature Astronomy, 2022; DOI: 10.1038/s41550-022-01632-z