It’s possible that I shall make an ass of myself. But in that case one can always get out of it with a little dialectic. I have, of course, so worded my proposition as to be right either way (K.Marx, Letter to F.Engels on the Indian Mutiny)
Saturday, March 07, 2026
U.S. Gasoline Surges to Highest Under Trump as Iran War Roils Oil Market
The national average price of gasoline in the United States has jumped to the highest level seen during either of President Donald Trump’s terms in office, per GasBuddy data, as the de facto closure of the Strait of Hormuz is holding back millions of barrels of crude and fuel supplies and leading to price spikes.
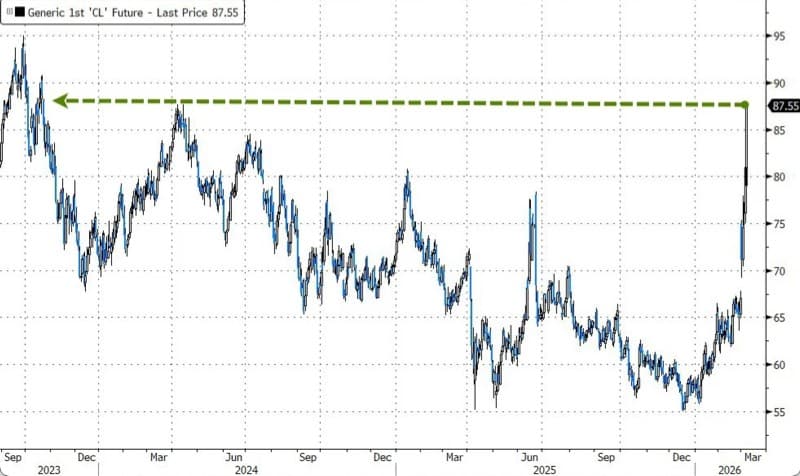
WTI Crude, the U.S. benchmark, jumped from $67 per barrel on February 27, just before the Iran war started, to above $84 per barrel a week later as of early Friday. Oil prices are on track for at least a 16% weekly jump in the biggest one-week rally since the Russian invasion of Ukraine in 2022.
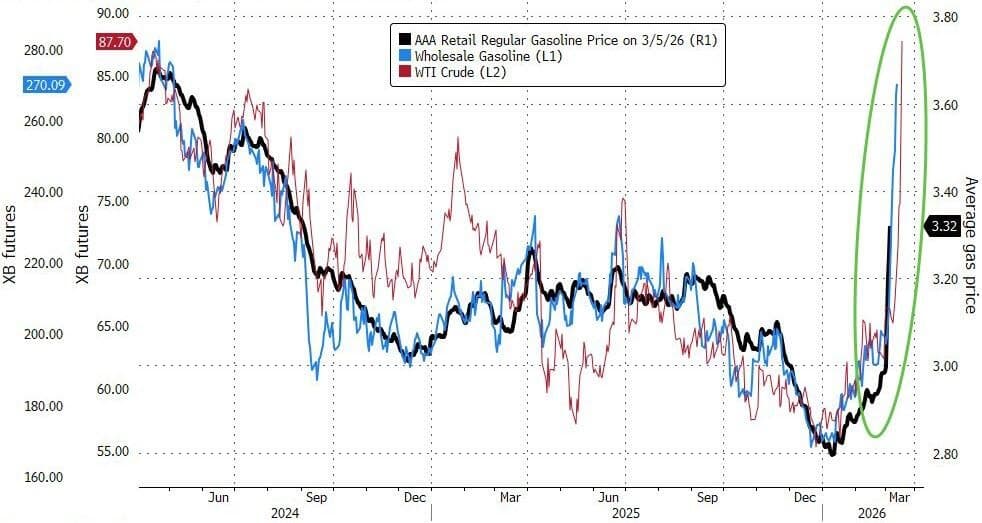
With crude prices being the main component of gasoline price formation, U.S. prices at the pump have jumped this week, too. The price spike from the Iran war is being compounded by the more expensive summer-grade gasoline that refineries are now producing for the summer driving season.
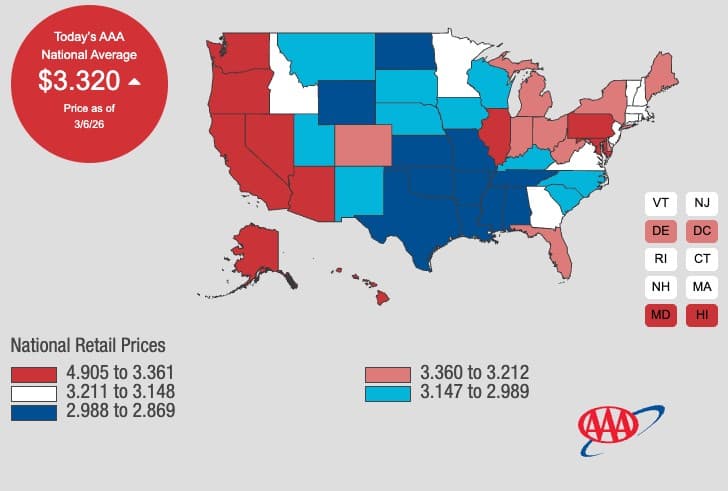
Late on Thursday, the national average had surged to $3.262 per gallon— the highest level recorded during either of Trump’s terms in office, according to live GasBuddy data, said Patrick de Haan, head of petroleum analysis at GasBuddy.
The number of U.S. states with average gas prices over $3 per gallon has jumped from about eight on Sunday to 33 as of late Thursday, with the list likely to grow to 40 in the next few days, de Haan noted.
The price of diesel, which globally faces more acute physical disruption and pressure from the Middle East war, has surged more than gasoline.
The U.S. national average price of diesel soared to $4.124 per gallon, the highest level since December 2023, according to GasBuddy data.
“The diesel market is simply tighter, and with drone attacks on a Saudi refinery, Qatar shutting down natural gas production, boosting heating oil use, and lower U.S. inventories amidst cold weather, diesel has out-rallied gasoline,” GasBuddy’s de Haan said.
Americans are experiencing a sharp rise in gas prices this week, with the national average gasoline price posting its largest weekly jump since the early days of the Russia-Ukraine war. If fuel prices continue to climb as the U.S.-Israeli Operation Epic Fury intensifies against Iran, the fallout for consumer sentiment may weigh on the broader economy and affect voting polls in the near term.
The surge in gasoline and diesel prices at pumps nationwide doesn't appear to be a concern for President Trump (at least not yet).
"I don't have any concern about it," the president told Reuters in an interview on Thursday evening when asked about rising prices.
"They'll drop very rapidly when this is over, and if they rise, they rise, but this is far more important than having gasoline prices go up a little bit."
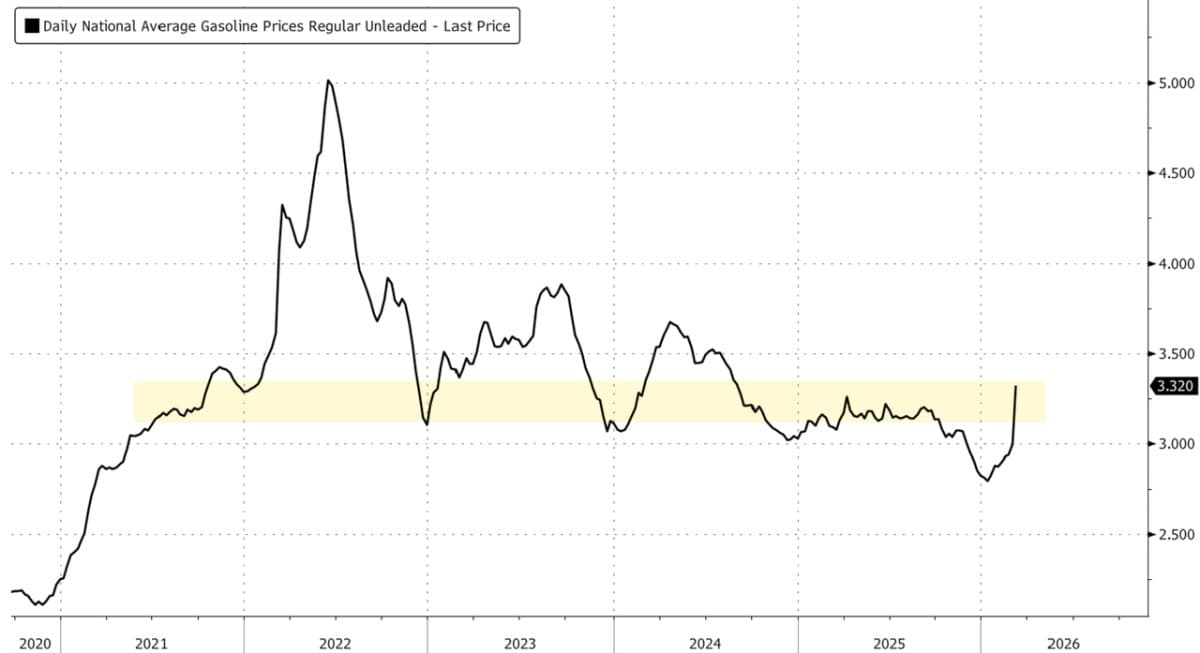
The president's comments come as the national average gas price at the pump has jumped nearly 11% this week to $3.32 per gallon, according to the latest figures from the travel organization AAA.
The nearly 11% surge in the national average is the biggest weekly jump since the week of March 6, 2022, when there was a 12.6% spike due to energy market chaos stemming from the war in Eastern Europe.
Surging WTI futures on Friday morning, now at $86/bbl (Brent crude futures above $90/bbl), suggest that pump prices could be headed higher into the weekend. This is a very big concern for the Trump administration, despite Trump downplaying the whole price surge.
"We have slightly higher oil prices for a little while, but as soon as this ends, those prices are going to drop, I believe, lower than ever before," Trump told reporters in the Oval Office on Tuesday.
Current WTI futures pricing suggests $3.80-ish for gas at the pump.
Trump has often touted low pump prices as one of his major accomplishments in making the economy more affordable for Americans after the inflation storm during the four years of the Biden-Harris administration. To be fair, gas prices nationwide are still relatively low compared to those years.
On Wednesday, Energy Secretary Chris Wright told Fox News that any increase in pump prices would be a temporary bump and a "very small price to pay" for accomplishing Trump's goals in the Middle East. The U.S. is more sheltered than ever to withstand a global energy shock, thanks to Trump's 'pump baby pump' pro-energy policies.
To mitigate the incoming energy shock created by the paralyzed Strait of Hormuz, Trump ordered the government to provide risk insurance for tankers transiting the waterway earlier this week. However, as we have already explained, and as Qatar's energy minister warned this morning, the risks of both an energy shock and a financial shock are soaring.
By Zerohedge.com
IMF: Oil Price Shock Tests Global Economic Resilience
The surge in oil and LNG prices as a result of the Middle East war is testing the resilience of the global economy once again, IMF Managing Director Kristalina Georgieva said on Friday.
“The world economy has been remarkably resilient. Shock after shock, and yet growth is at 3.3%,” Georgieva told Bloomberg Television in an interview.
“But this resilience is being tested yet again,” the IMF’s top official added.
If energy prices sustain just a 10% increase over a period of one year, this would add 0.4 percentage point to inflation and slow economic growth by 0.1%-0.2%, Georgieva told Bloomberg on the sidelines of the Asia in 2050 Conference in Bangkok, Thailand.
The IMF is already in discussions with the most vulnerable energy importers to potentially assist them financially if energy prices and uncertainty further spike, she said.
“This conflict, if it proves to be more prolonged, has obvious potential to affect global energy prices, market sentiment, growth, and inflation, placing new demands on policymakers,” Georgieva said at the conference in Thailand on Thursday.
“For most of Asia, what is at stake is energy security and, through that, confidence. Stock markets are already reacting,” the IMF’s Managing Director added.
For example, in South Korea, the world’s best-performing equities market for 2025, volatility hit new highs this week.
The Seoul market saw on Wednesday its biggest-ever crash with selloffs focused on chip makers and technology stocks. Traders are concerned that the escalating war in the Middle East and the surge in oil and gas prices would reignite inflation and slow economic growth rates.
Investors in Asia are dumping technology stocks as they brace for an inflation shock from the surging oil prices that would delay interest rate cuts.
Asia is particularly vulnerable to the current energy shock as most of its top oil and gas buyers, including China, Japan, South Korea, and India, rely on Middle Eastern crude and LNG being transported via the Strait of Hormuz.
Recent worldwide energy consumption growth has been insufficient to keep up with population increase, resulting in a concerning decline in the per-capita energy supply available to support higher standards of living.
The supply of vital resources, particularly diesel and jet fuel, which are essential for international trade and food production, is being squeezed even more than the overall energy supply.
Advanced Economies face unique challenges, including falling per-capita electricity production and a reliance on imported critical minerals, suggesting a difficult shift toward greater electrification and a rise in global tension as countries compete for limited resources.
A few years ago, I analyzed the growth of world energy consumption, breaking it down into (a) the growth in energy consumption needed to support the growth in world population, and (b) the growth in energy consumption available to support higher standards of living. This analysis covered the period 1820 to 2020. I found that periods of low growth tended to coincide with wars, depressions, and collapses. This is not surprising in a world economy governed by the laws of physics. Every part of the economy requires adequate energy of appropriate kinds.
Figure 1. Chart from 2021, showing average annual growth in world energy consumption for 10-year periods. These increases were divided into the portion needed to cover the population increase, and the remaining amount available to support an increase in living standards.
In this post, I analyze data for 5-year periods, ending in 2024, to obtain an updated view of recent energy consumption and population trends. My conclusion is that total energy consumption growth in recent years has not been sufficient to forestall major problems. A more detailed analysis reveals that growth in certain vital resources (the diesel+jet fuel part of oil supply, and critical minerals related to electricity production and usage) is particularly problematic.
These findings indicate that the economy is already beginning to hit energy limits. Because of energy-related shortages that are already being encountered, national economies are beginning to act like the players in a game of musical chairs, with one too few chairs. Leaders have taken to building up armies, cutting off exports of critical minerals, imposing tariffs, and bombing other countries, even though these actions might not make sense to peace-loving citizens.
[1] Figure 2 is a stacked bar chart showing similar indications to Figure 1.
Figure 2. Average worldwide growth in energy consumption, divided into two segments: (a) the portion needed to provide for existing population at the current standard of living, and (2) the portion available to support growth in worldwide living standards. This chart displays the same data as Figure 1, differently.
The total of the red and blue segments is the average annual increase in world energy consumption over a particular 10-year period. The blue amounts (usually at the bottom) are those necessary to provide services at the same level as in the past, given the population increase. The red amounts (usually at the top) are determined by subtraction. Large red caps are good, while red caps below the zero line are very bad. They indicate that the per-capita energy supply is declining.
[2] The largest increases in Figure 2 correspond to favorable economic times.
The vertical text in Figure 1 provides examples of how low points in energy consumption have proven to be very bad. In this section, I show that the opposite is also true: High points tend to correspond to very good times economically.
One peak in Figures 1 and 2 coincides with the 1901 to 1910 period. This period corresponds to early electrification and advances in the mechanization of agriculture. It was before 1913 when the United Kingdom hit peak coal, limiting the amount of coal that could be profitably extracted. Germany hit peak hard coal shortly before World War II. After peak coal was reached, less coal was available per capita. Leaders felt the pressure of “not enough coal to go around” and opted for war.
In Figures 1 and 2, rapid energy growth occurred after World War II, during the 1950s, 1960s and 1970s. The lower peak in the 2001-2010 period coincided with much greater use of coal after China was added to the World Trade Organization (WTO) in late 2001. High-wage countries started transferring their industry to China because costs would be lower in two ways: Wage costs were lower, and coal was an inexpensive fuel, reducing energy costs. Furthermore, by transferring industry, including manufacturing and mining, to China, high-wage countries could also lower their own CO2 emissions, as required by the 1997 Kyoto Protocol.
We would expect the patterns we are seeing in Figures 1 and 2 if the world economy is governed by the laws of physics. The availability of plenty of inexpensive energy, of kinds that match built infrastructure, is what is needed to allow the world economy to grow.
[3] Figure 3 shows more recent world energy data organized by 5-year periods. It shows how small the “red caps” of the types leading to favorable economic outcomes have been in the last decade.
Figure 3. Chart showing similar information to that in Figure 2, calculated for 5-year periods, instead of 10-year periods. Underlying data is from the 2025 Statistical Review of World Energy, published by the Energy Institute.
The latest two 5-year periods comprise the years 2015 to 2024. The short red caps on these two 5-year periods mean that the economy is already being squeezed in the direction of not-enough-to go-around.
[4] Viewed on this same basis, diesel and jet fuel supplies are being squeezed even more than the overall supply of energy products.
Diesel and jet fuel are somewhat similar in composition. They are grouped together in some energy reports as “middle distillates.” They are relatively heavy oil products that come out of oil refineries. If there is a shortage of one, there likely is a shortage of the other as well.
Figure 4. Chart showing similar information to Figures 2 and 3, calculated for 5-year periods, with respect to “middle distillates,” a category that includes diesel and jet fuel. The underlying data is from the 2025 Statistical Review of World Energy, published by the Energy Institute.
Diesel and jet fuel are of concern because, since 2015, there has been an actual shrinkage in the amount of these fuels available relative to population. In fact, every five-year period since the 2000 to 2004 period has shown less growth in diesel and jet fuel than in the overall world energy supply. (Compare Figures 3 and 4.)
The low growth of diesel+jet fuel is particularly concerning because these fuels are essential for international transportation. With too little of these oil types, trade across the Atlantic and Pacific needs to shrink back. The physics of the situation makes tariffs look like an attractive solution for reducing trade.
Figure 5. Chart made by the author, pointing out the need for shorter trade routes.
Another concern is that diesel is essential for food production and transportation. Even if some other types of energy are available in plentiful supply, we cannot get along without food. While wind and solar are popular energy types today, they are not very useful for either international transport or for operating modern agricultural equipment.
[5] The underlying problem is that populations tend to outgrow their resource bases, including energy supplies.
The issue of the world not being able to support endlessly rising human population is an issue that no politician, auto maker, or economist wants to mention. The standard work-around is to show energy supplies without using an adjustment to a per-capita basis. This tends to make the energy situation look much better than it really is. Figure 6 is an example of such a chart.
Figure 6. World energy divided between fossil fuels and other types, based on data from the 2025 Statistical Review of World Energy, published by the Energy Institute.
Figure 6 emphasizes how modest the recent add-ons to the fossil fuel supply really are. These add-ons are made possible by fossil fuels; they would tend to disappear if fossil fuels were to disappear. Nuclear, which is the largest of the add-ons, requires both uranium and fossil fuels. The category “Wind+Solar” is the tiny green stripe at the top of Figure 6. In 2024, Wind+Solar amounted to 2.8% of world energy supply.
[6] It is easy to make electricity look like a growth area that can continue its pattern forever.
Figure 7 is a world electricity chart that, like Figure 6, is not on a per-capita basis.
Figure 7. World electricity divided between fossil fuels and other types, based on data from the 2025 Statistical Review of World Energy, published by the Energy Institute.
There are a few details that are easy to miss:
(a) Current electricity production is quite small compared to the total energy supply. As counted by the Energy Institute, electricity amounts to only about 20% of total energy, varying by year and by part of the world. It is already incorporated in Figure 6.
(b) Almost all the non-fossil fuel part of the energy supply (“Add-Ons”) is electricity. In Figure 6, the only type of non-fossil energy shown that is not electricity is biofuels. These are mostly ethanol and biodiesel.
(c) Another detail that is easy to miss is the fact that the growth in the world’s electricity supply, as shown in Figure 7, has been almost exclusively outside the Advanced Economies–that is, members of the Organization for Economic Co-operation and Development (OECD). The Advanced Economies group includes the US, most of Europe, Japan, Australia, and several other countries.
Figure 8. Electricity generation divided between Advanced Economies and Other Economies, based on data from the 2025 Statistical Review of World Energy, published by the Energy Institute. The amounts are not per capita.
Figure 8 shows the growth in electricity generation separately for the Advanced Economies and the Other Economies. The chart shows that generation of electricity by the Advanced Economies grew until 2007 but flattened after that date. Electricity generation by the Other Economies has grown the entire time since 1985. The rate of electricity production growth of Other Economies became noticeably more rapid after China joined the WTO in 2001.
Also, population growth since 1985 has disproportionately taken place in Other Economies, as contrasted with Advanced Economies.
Figure 9. Population of Advanced and Other Economies, based on the population assumptions underlying the per capita calculations shown in the 2025 Statistical Review of World Energy, published by the Energy Institute.
[7] In the Advanced Economies, electricity production has recently been falling on a per capita basis, making a shift to greater electrification seem difficult.
A major issue is that the Advanced Economies are already seeing their electricity supplies per capita declining as shown on Figure 10 below. This is true for all five of the selected economies. Some of the lower consumption is due to efficiency improvements, but some is the result of the offshoring of jobs and industries to low-wage countries.
Figure 10. Per capita electricity production in five selected Advanced Economies, based on data from the 2025 Statistical Review of World Energy, published by the Energy Institute.
In comparison, electricity production per capita of other economies, with typically lower wages than Advanced Economies and often accompanied by more rapid population growth, has tended to rise, as shown on Figure 11.
Figure 11. Per capita electricity production in four selected economies, not included in Advanced Economies, based on data from the 2025 Statistical Review of World Energy, published by the Energy Institute.
The four “Other Economies” are less similar to each other than the five Advanced Economies. But what is striking is that they all have shown growth in per-capita electricity production since 1999. In 2024, Saudi Arabia’s electricity production had risen to about the per-capita level of the US’s electricity production. By 2024, China’s per-capita electricity production had surpassed that of both the EU and the UK. Russia was part of the Soviet Union before the latter collapsed in 1991. Once Russia’s economy had started recovering from the collapse, about 1999, its per-capita electricity production also began to rise.
[8] Other issues are also making a continued shift to electrification appear difficult, particularly for the Advanced Economies.
Trying to work around using fossil fuels leads to the need for more specialized minerals to produce high tech electrical goods and electricity transmission. The problem faced by Advanced Economies is that they produce practically none of these minerals; they must import them. The US has a long list of minerals it considers critical.
Some of these minerals aren’t rare in the earth’s crust. Part of the problem is the lack of industrial capacity in Advanced Economies today, as industry has been moved overseas to reduce costs and local CO2 emissions. For example, the US used to be a major producer of aluminum, but this production has dwindled; other countries, including China, can produce aluminum at lower cost.
Another issue is that China produces the majority of quite a few of these minerals. The US, and probably the other Advanced Economies, had planned to buy what they needed on the world market. Now, production is not keeping up with the amount the world could easily use. In 2025, China announced export restrictions on some minerals, including gallium, germanium and antimony. It has become clear that if Advanced Economies want to have adequate supplies of high-demand minerals (including silver, copper, platinum, rare earth minerals, and uranium, among others), they need to start producing them themselves.
Diesel is used in extracting many of these minerals. If diesel is in short supply, that adds another layer of problems. All these issues may lie behind President Trump’s interest in Greenland.
[9] We don’t hear about these issues partly because academic researchers live in ivory towers, and partly because politicians don’t dare explain the issues to voters.
Part of the problem is that economists don’t understand how tightly the various parts of the world economy are interconnected through the laws of physics. Economists tend to believe that if there is a shortage, prices will rise, and these higher prices will solve nearly all problems. This is not necessarily the case. Buyers cannot purchase more than they can afford. Prices may spike temporarily and then fall back. Production of fossil fuels or minerals may end because prices do not rise high enough, for long enough, for producers to depend upon the higher prices for the long term.
In the case of a shortage, most people assume that the only change the economy will make is in prices. However, the economy is tightly interconnected. It can move production to a different part of the world, where wages and energy costs are lower. An indirect result, in the country losing jobs, may be more wage and wealth disparity. The US seems to be experiencing this issue now, with fewer young people being able to find a job that pays well.
Needless to say, politicians aren’t willing to admit, “We have difficulties for which we can see no solution.” Even leaders of universities are reluctant to suggest that there might be major problems ahead. They don’t want to frighten students or their parents. University officials want all problems to be ones their students can work on, with the hope of solving them in the next few years.
[10] What is happening now is similar to the outcome of a game of musical chairs, when there is one fewer chair than the number of players.
In the game of musical chairs, players walk around a group of chairs until the music stops. At the end of each round, one chair is removed, leaving one fewer chair than the number of players. In the next round, the remaining players all scramble for the chairs available, which often leads to small fights over who gets a chair. This not-enough-to-go-around problem explains the poor relations we see today among countries and political parties. It is also the underlying reason for the interest in imposing tariffs and in bombing other countries.
Financial markets tend to perform well during periods of economic growth. However, if certain kinds of essential resources are in short supply, this will tend to hold back growth. Debt defaults and falling stock markets could result. For these reasons, problems in financial markets may be ahead.
Major governmental changes may be ahead. Representative governments require more energy than simpler types of organizations, such as dictatorships. Furthermore, citizens do not like disorder; they may want to overthrow leaders who seem to allow too much disorder. They may vote them out of office or even try to assassinate them. The problem of resource inadequacy is structural, however. Getting rid of a particular leader doesn’t necessarily help the situation.
Everywhere in the world, at least part of today’s problem is that there are not enough jobs available that pay well. Economists have told us to expect high prices if there are shortages. In a way, not having enough jobs that pay well is the opposite problem. But from a physics standpoint, the result is the same. Only a few people can afford many of the goods that are available. The economists’ misinterpretation of what is going wrong further confuses people’s understanding of our current situation.
Mainstream media needs to cater to advertisers. Because of this issue, we cannot expect them to tell us what is happening. That task seems to fall to bloggers, like me. I try to write an article approximately every month. I hope that the graphs and other figures I have presented in this article will help readers understand why we are currently seeing more types of disruptions, such as tariffs and bombings.